This Statement is FalseCharting is amazing. The excitement it gives me is far greater than the satisfaction a good trade could ever give me. It is easy for me to state this fact since I don't trade. I consider the stock market as a super-long-term strategy. A strategy that lasts for generations, not a career. After all, the most wealthy have ancestors heavily invested in the stock market decades ago.
Charting can be prone to showing ghosts when there are none.
We tend to believe a crisis is coming, when in fact it is ending.
No wonder the yield curve is super important. With specific adjustments to rates, the FED manages to accelerate and decelerate the economy.
I recently found out about the following chart:
SPX-equal-weight vs SPX-market-cap
This chart represents "democracy" in wealth distribution between the 500 members of SPX.
The higher the chart, the more spread out the wealth distribution.
Now we are apparently reaching what appears to be a significant floor.
There is a lot of ground to cover regarding this chart above.
First things first, there appears to be a significant correlation between yield rates and wealth spread. There also appears to be a lag on this chart. First there is a wealth distribution change, and then the yield rates change appropriately.
The charts above state that high yield rates go hand-in-hand with higher wealth distribution.
At first this may seem counter-intuitive. How on earth do high yield rates help the markets? We all know that equities suffered last year because of the rapid rate hike.
It is simple, really. High yield rates encourage banks to lend money.
High yield rates help spread money from the few to the many.
As a historical analogue we could compare the SPX/DJI chart.
This chart is false.
The many vs the few is not what you think it is.
There is one caveat with this chart. SPX is a market-cap index while DJI is a stock-price index.
With that in mind we should consider the following:
-- The SPX/DJI chart is not 100% comparable. It may even represent the "average cost" of a stock. Since Market-Cap (money) is divided by Stock-Price (stock).
-- In hindsight, we realize that the Great Depression happened in a period of ample and cheaper stocks, with market cap diminishing. It might have been the absolute definition of a bubble. Buyers bought progressively more and more stocks that came into existence out of thin air.
Does this story ring any bells? Has anyone heard about derivatives?
The RSP/IVV chart we talked before had an excellent behavior and correlation to yield rates.
All was well, until now. Now we have an issue...
The RSP/IVV ratio, which appears to lead yield rates is rapidly dropping. With that in mind, the FED should have lower yield rates into what the market prices them.
Right now, the FED attempts killing the market.
A conclusion is hard to make. Both the SPX/DJI charts, and the RSP/IVV-yield-rate chart suggest that yield rates are significantly overextended upwards.
Have we leaped too fast too quick? Has the FED overreacted?
Does wealth distribution suggest lower rates in the months to come?
Has the market settled with a low-rate hyper-inflationary future?
Will the RSP/IVV floor give-in?
Is a roaring '20s-like bubble brewing? Just like our "friend" Musk called...
Tread lightly, for this is hallowed ground.
-Father Grigori
DJI

The Emperor's New ClothesYou don't need to believe in fairytales to realize that there are kings, queens and peasants.
As if not a single day has passed since the Medieval times. Poor get poorer, and rich get richer.
As the folklore said, the emperor decided that he needs new clothes.
And so he demanded from the entire kingdom that he finds the finest.
Two swindlers arrive at the capital city of an emperor who spends lavishly on clothing at the expense of state matters. Posing as weavers, they offer to supply him with magnificent clothes that are invisible to those who are stupid or incompetent.
Source: Wikipedia
And here we are. Looking at the magnificent clothes of the naked emperor.
The emperor however is still an emperor, no matter what he wears.
And he gets to enjoy the fruit of his peasants' labor.
Post 2020 profits for the naked few.
Until today, we are too smart not to see the clothes of the emperor.
No sane person can possibly call themselves incompetent.
The ghost of the emperor lives on...
...until one child realizes, that there are no clothes in the first place.
We have reached the very last days of the emperor's dignity.
Trend change begins when only one changes direction. Others soon follow.
Volatility increases after a tiny "butterfly-event" causes one member to destabilize.
SPX Stability:
Then volatility swallows everyone.
Parasites have riddled the economy.
There is only a limited amount of time for parasites to feast.
The time will come, when there will be no food left.
It is at that time when the real "fun" begins...
Tread lightly, for this is hallowed ground.
-Father Grigori

DOW JONES Consolidation leading to a Christmas rally?Dow Jones / US30 spent all week above the 1day MA50, in fact Friday's rebound took place exactly on it (Support A at 33850).
This is potentially an Inverse Head and Shoulders pattern and with the 1day RSI at 60.00 and over its MA, it draws comparisons with the June 15th pattern, which peaked at +6.08%.
That pattern has same measurements as the current Inverse Head and Shoulders and formed the Right Shoulder in 3 weeks, supported by the 1day MA50.
After that another +6.15% leg brought the price to the 1.786 Fibonacci extension.
Similarly, the current Inverse Head and Shoulders may target the 1.786 Fibonacci, which in this case will be a little under the 35700 Resistance B high.
Buy and target 35500 (a little under Fibonacci 1.786).
Previous chart:
Follow us, like the idea and leave a comment below!!

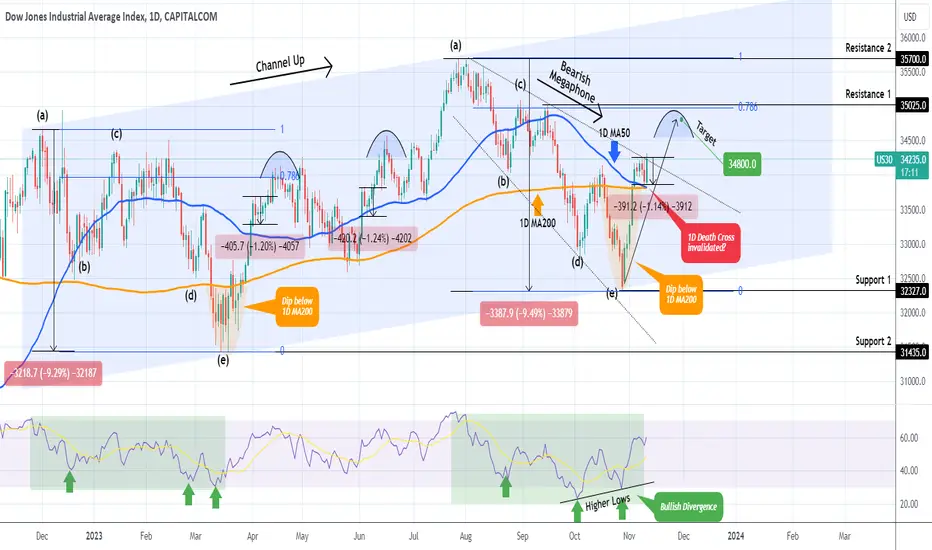
DOW JONES Strong rebound on the 1D MA50!Dow Jones (DJI) is having an excellent rebound ever since our October 31 buy signal (see chart below), which we issued after the index bottomed on the Higher Lows trend-line of the 12-month Channel Up:
The price broke today even above the 3-month Bearish Megaphone, which was the pattern that executed the Channel Up correction. Today's rebound is being done after the index hit and held the 1D MA50 (blue trend-line), which is in fact on top of the 1D MA200 (orange trend-line). If it continues, we may see this 1D Death Cross (a technically bearish pattern) getting invalidated.
However, we do lower our medium-term target from 35000 to 34800 as this rebound is coming off a -1.15% pull-back, which resembles those of June 06 and April 04, that topped on the next rise and then pulled-back to the 1D MA50.
-------------------------------------------------------------------------------
** Please LIKE 👍, FOLLOW ✅, SHARE 🙌 and COMMENT ✍ if you enjoy this idea! Also share your ideas and charts in the comments section below! This is best way to keep it relevant, support us, keep the content here free and allow the idea to reach as many people as possible. **
-------------------------------------------------------------------------------
💸💸💸💸💸💸
👇 👇 👇 👇 👇 👇
Are we about to see a new era of expansion for the tech sector?This is the Nasdaq to Dow Jones ratio (NDX/DJI) on the 1W time-frame (with the RSI on the 1M), which offers very interesting conclusions as to where we are on the large scale of things, which can be particularly helpful now as the shorting bets have been increased to the most in 5 years.
The recent pull-back since the July Highs, have made market critics call for a stronger correction. for the NDX/DJI pair, this has just been a consolidation. Going back to 2000, the tech sector witnessed a 'biblical' Bear Cycle as the Dotcom Bubble popped. It wasn't until November 2021 that the NDX/DJI ratio reached this 0.47 All Time High (ATH) Resistance but again as we saw, the inflation crisis happened and had a 1 year Bear Cycle.
Now the ratio is almost back to the ATH Resistance and just formed a 1W Golden Cross, which is a very bullish pattern, the first since October 2007. What's really interesting is that this consolidation on a 1W Golden Cross is quite similar to the July 1991 pattern. That fractal was basically the expansion phase that led to the Dotcom Bubble burst. The 1M RSI sequences are similar between the two fractals.
This chart shows us that such expansions take place inside Channel Up patterns. The 1W Golden Cross and a potential break above the 0.47 Resistance, may be the signal telling us that the technology market is starting a new era of expansion and it won't be surprising even fundamentally. Among other technological advancements and inventions, we are in the era of A.I. and that can be the vehicle to grow the market to unprecedented highs just like the internet was in the 1990s fractal that led to the 2000 Dotcom bubble.
Do you think the time to invest in tech long-term is now?
-------------------------------------------------------------------------------
** Please LIKE 👍, FOLLOW ✅, SHARE 🙌 and COMMENT ✍ if you enjoy this idea! Also share your ideas and charts in the comments section below! This is best way to keep it relevant, support us, keep the content here free and allow the idea to reach as many people as possible. **
-------------------------------------------------------------------------------
💸💸💸💸💸💸
👇 👇 👇 👇 👇 👇

Global Economic Recession SPX CRASHSPX is finishing a 1-2-3-4-5 wave for new highs. Whales are ready to push the stock market to new highs. This will get the majority of traders very bullish while whales exit the stock market and flip the trade. One of the worst recessions in history is in the making. Pattern: Inverse H&S

DOW JONES: Final pump before correction.Dow Jones turned bullish on its 1D technical outlook (RSI = 59.241, MACD = -34.600, ADX = 33.114) after more than three weeks as it smashed past our target and even crossed over the R1 level (34,150). The inevitable formation of a Golden Cross on the 4H timeframe, indicates that this sequence has one more High left to give on the LH and HH trendlines cross.
The 4H MACD Bearish Cross is very much like October 12th, both took off on a Double Bottom Bullish Cross. This is our last short term buy (TP = 34,500).
See how well our prior idea has worked:
## If you like our free content follow our profile to get more daily ideas. ##
## Comments and likes are greatly appreciated. ##

Dow Jones And Fibonacci SequencesDow Jones has broken an important fibonacci sequence (28000) and ready to hit 46000 as next resistance. when dow jones is bullish all markets will rise.

Dow Jones vs. DXY Q1 of 2024 Crash ScenarioCrude chart depicting what a crash in the Q1 of 2024 may look like as it relates to TVC:DXY
Similar scenarios could occur across multiple markets including the BNC:BLX and OANDA:XAUUSD
Depicted here showing TVC:DJI making a double top with a slightly higher ATH as the US Dollar Index re-tests monthly support and the top of a falling wedge before rocketing up above its recent highs and heading towards its 1985 ATH.
Below are a few more detailed looks at TVC:DXY - its falling wedge, an older weekly chart talking about this, and finally zooming way out to see its potential for revisiting the '85 ATH, or higher:
Dollar Index Falling Wedge Breakout
Original Post - Market Recoveries be Wary of DXY
Potential for Revisiting ATH and/or breaking it
Also, a couple of examples of how it correlates with the Bitcoin BNC:BLX & Crypto Market, plus a crude example similar to the one in this post showing Gold Spot Market OANDA:XAUUSD
Macro Negative Correlation with Bitcoin
Crude Example - Gold Spot Market

DOW JONES Above the 1day MA50 after almost 2 months!Dow Jones / US30 crossed on Friday over the 1day MA50 for the first time since September 15.
It hit Resistance A (34150) which was the October 17th High and completed so far 5 green days in a row almost at the top of the Bearish Megaphone.
The long term pattern is a Channel Up, so there is still considerable upside left.
The 1day RSI also crossed over its Falling Resistance much like the March 29th fractal, which after a short consolidation on Resistance A, it hit Fibonacci 0.786.
Buy if the price crosses over the Bearish Megaphone and target 34950 (0.786 Fibonacci).
Previous chart:
Follow us, like the idea and leave a comment below!!

Combined US Indexes Bounced UP!Heads up that there is a significant development in the market structure, as observed by the last two weeks of activity.
Previous week, the weekly candle broke down two support lines, and closed well below. In addition, there was support from the TD Sequential counts for a downward momentum. This was also corroborated by the MACD and the VolDiv.
However, despite the technical indications, the market movement was totally opposite that started with a gap up, and ended with strong upside momentum. There are two very clear indications of a trend change:
1. The opposing candlestick is large and closed above the last six close; and
2. The TD Sequential reversed and started the opposing Setup.
Taken together, this are the first indications of a real trend change.
Next, this would need to follow through, and break above the trendline, and then the marked resistance.

Dow Jones Industrial (Bullish Swing View)TVC:DJI
Entry: 33029.12 (Higher High)
Stoploss: 32585
Target: 34083

DOW JONES: Started rising, at least on the short term.Dow Jones went from oversold to neutral on its 4H technical outlook (RSI = 51.457, MACD = -63.520, ADX = 28.038) as the price bottomed on the LL trendline of the three month Channel Down and rebounded straight to the 4H MA50 today. This is the short term Resistance, a closing above it confirms the 2nd part of the rally to the 4H MA200.
The 4H MACD is on the same Double Bullish Cross bottom formation as October 4th. The rally that followed rose by +4.05%. Consequently our bullish target (TP = 33,500) is under a max +4.05% range, as well as the 4H MA200 and the dashed LH trendline.
## If you like our free content follow our profile to get more daily ideas. ##
## Comments and likes are greatly appreciated. ##

Dow Jones Formed A Leading Diagonal?Dow Jones Industrial sector is the strongest this week and we can see sharp and impulsive intraday stabilization that can cause a bigger recovery in upcoming weeks, but ideally only within a higher degree A-B-C corrective rally in wave B after we spotted a larger leading diagonal from the highs into wave A. So, we will still have to be aware of another sell-off on stocks, but maybe later, at the end of 2023 or beginning of 2024.

DOW JONES Time to buy the dip again.Dow Jones / US30 reached our desired buy level based on our last idea (chart at the bottom), which is exactly at the bottom of the 11 month Channel Up.
It kept the 1week MA200 intact once again (has been since October 2022), so that maintains the long term trend bullish.
The shorter pattern is a Bearish Megaphone and as mentioned previously, our target is for the time being and until a break out takes place, inside this pattern.
Target 33600, which is under the 1week MA50, under which all of October's candles have closed.
Previous chart:
Follow us, like the idea and leave a comment below!!

SPY (Stocks) Should See a Nice Bounce This WeekTraders,
As mentioned in several of my previous posts and last video, SPY has now reached its downside target. This level at 410 provides strong support and correlates with our level of support on the RSI. I expect this week to be an up week for the S&P 500 and the stock market in general.
Best,
Stew

DOW JONES Best buy entry on a 7 month basis.Dow Jones is approaching Support (1) and the Rising Support of the 2023 Channel Up.
The Support (1) level has been holding for 5 months.
Based on the Falling Resistance that initated the current correction and the rejection on the MA50 (1d), the price action is identical to November 2022 - March 2023 so far.
Trading Plan:
1. Buy on the current market price.
Targets:
1. 34800 (Falling Resistance).
Tips:
1. The Sine Wave tool very accurately displays the Cycle of peaks and bottoms since late 2022 and shows the price is on the most optimal bottom buy level time wise.
Please like, follow and comment!!
Notes:
Past trading plan:

$NDX breaking atm, $SPX will follow, can $DJI & $RUT hold?TVC:NDQ looks to be in SERIOUS trouble at the moment.
IF this is the case then the SP:SPX likely will follow.
DJ:DJI can hold, to a degree but wouldn't bet on it.
Let's focus on AMEX:SPY
Oversold daily BUT WEEKLY it has more room to go.
Also, in comparison to 2022, #stockmarkets are likely FURTHER along than anticipated. The chart we've been showing for some time.
Unless change FAST = 💀

S&P Double TopHistory and Introduction
Everyone in the market today remembers broadly the financial response to C19. It We see it every time that we look at the price chart and we see the spike down and the V recovery. What a lot of people may not remember is the investigation into SoftBank for essentially causing a short squeeze by use of call options and gamma hedging. When that news story came out my long term assumption was we would be returning to the C19 low and that has informed every idea I have put out since then.
News story
www.investmentwatchblog.com
An Explain Like I am 5 From Reddit
When you write a call as a seller you essentially take a short position against the stock delta wise When SoftBank bought loads of calls that were out of the money then the writers had large negative delta positions against these tech stocks.
One common way to offset a negative delta is you can hedge with owning shares to offset the negative position from the calls you write. As the calls were heavily wrote then shares were added to offset risk which contributed towards momentum. As the stock positions were entered it drove up price of stock which put those out of the money options closer to the money leading to more share purchases while SoftBank continued to purchase more and more calls leading to an increased share price between delta hedging and general market momentum. Someone can correct me if I’m off but that’s my broad description
www.reddit.com
Essentially when that news story came out I, personally, understood all these gains were unsustainable and were going to be given back. This was in addition to all of the other stimulus spending that was going on. There was still gains to be made or lost speculating in swing trading but my ultimate goal was to not buy the top and not to sell bottoms.
Main Chart Analysis
The main chart has been left pretty simple. We have the Gaussian Channel on top and we can see that in the 70s there were two points in time investors or traders got to buy below the gaussian channel. Fortunes could be made by buying below the channel and merely selling above the guassian channel. Loading up on dividend stocks would have also been very prudent. We can also see the opportunity came again in the 2000s.
We can also see in purple the tops where the ADX has been at 20 or below. The 70s dip had the low ADX but the 2000s did not. It is not a necessary condition that the ADX be low for price to go below the gaussian channel, but it is suggestive that with the current low monthly ADX we have a fair shot of getting there.
We also see that similar to the 1970s the ADX has been declining over each high for over the last decade. Not a good set of circumstances to be in.
The right side of the chart shows the double top itself without any indicators and on the weekly time frame. As it stands right now it looks like a “lower high” double top but price could rally up 17% from the current level and this idea is still valid. The last top took over 300 days to develop and start to sell off to create the valley low. We can still have a significant amount of sideways as bulls get exhausted.
Double Tops
Double tops are suppose to have a flat base before the uptrend begins and then return to the flat base per Bulkowski, who is broadly considered to have written one of the modern trading “bibles.” www.thepatternsite.com
The chart below shows what I consider the flat base to be. The fib draw on the double top does get us right into that range. Another thing to remember is that we don’t need to see an impulse that looks strait down. It is quite probable that price action takes out the valley low and then rally to test previous support as resistance.
Here is an example of a double top on bitcoin from the 2018 bear market. The 4-hour chart provides the detail of a double top that developed over 25 days from the time the began to top to rejection oat previous support.
So, not only could price action go sideways for some 300 days as the second half of the double top is created, but once price sells off we could spend considerable time in a suckers rally as price returns to previous support and tests it as resistance.
Quarter Chart
Long term, we have a chance to buy in the quarterly gaussian channel. This would require significant sidewise-ish or channel-ish price action for a decade.
Dow Theory
Basic Dow theory on bull markets has three phases, accumulation (smart money), public participation, and excess. From there we enter distribution, public participation, and panic. One tenant of Dow theory is indices must confirm one another. www.investopedia.com
My linked idea will show that I thought that NDX would have a bull trap. That idea has been invalidated because rather than forming a classic bull trap NDX is likewise in a double top. But having both NDX and SPX in a topping formation suggests that we are in distribution.
Since we are talking about Dow theory lets look at the DJI. T Guess what? he Dow looks like it is in a double top as well. Having all three indices appear to be topping within 5 percent of previous ATH is pretty bad.
NASDAQ/S&P
Since the Nasdaq is more volatile than the S&P we can look for bearishness in the NDX/SPX pair to see broader bearishness in the market. I am personally staying away from the Nasdaq as an investment as possible until it reaches its own double top target against the S&P.
Crypto Assets
Since I believe the SPX is a index that could be topping for over 300 days and having several consolidations on the way down I would expect some assts to go crazy as investors rotate and individual assets have blow off tops. I expect some massive rallies with some select cryptos and then a lot of despair. A lot of movement can happen in crypto over the lifespan of this idea.
Here is bitcoin. What is the traditional target of a rising wedge? The beginning of the wedge. And there is no guarantee that bitcoin will set a higher high. If it does I am selling and probably never returning.
Conclusion
As someone who thinks the United States have been off sound money since the creation of the Federal Reserve I see all of this as the consequences of late-stage socialism. Subsidies to support government initiatives, transfer payments, bloated public services, debasement of the money supply all lead to public excess in the stock market. The United States as been more resilient than a lot of other countries in warding off the pernicious influence of socialist actors but once the Federal Reserve was created the ultimate conclusion was clear, it was just a matter of timing. Of course, due to inherent theory and model failure of most socialists they don’t realize it is the socialist policies that got the market here. Just like most don’t realize we are in distribution.
The distribution phase can take a long time and I expect to be ignoring a lot of news. It’s a distraction. I am going to make the trades and investments as I see them. The main chart focuses on what happened to the SPX in two bear markets, one in the 70s and another in the 2000s. What happened to sound money (precious metals) in the 70s and 2000?
Quite simply they went crazy. What happened to the Gold/SPX ratio? They reached muti-decades lows. If the SPX is topping then I would expect to see a massive upside pattern on gold. And I do. There is a cup and handle or ascending triangle. Based on that the time for me to rotate back into the S&P generally would be when the SPX/Gold ratio hits a double bottom from the low of 2011
Likewise with Silver and the S&P
I think it is a decent time to take my kids to the precious metals store.

SonTrader - BUY US30 Dow JonesEntry : 33165
SL : 33000
TP : 34000
RRR : 1/5
Every trade has risk!! So please set SL with your own caution and always follow my orders at Tradingview !!
Support Broker with me in the Bio section

DOW JONES: Support Zone intact. Buyers are favored short term.Dow Jones is volatile on the 4H timeframe (RSI = 37.485, MACD = -170.620, ADX = 29.943) after almost testing the S1 level (32,813) yesterday but following a 4H MACD Bullish Cross formation, it is a low risk buy opportunity. The rejection of the previous rise took place on the 4H MA200, so that is our target again. Buy and TP = 33,700.
## If you like our free content follow our profile to get more daily ideas. ##
## Comments and likes are greatly appreciated. ##

Dow Jones BuyThe Dow Jones is trading in a downward direction, approaching a demand area, and upon arrival, the harmonic (penny) pattern will be completed, and we will open a buy deal upon the appearance of a Price Action candle.

Macro Monday 17~Bear Market Confirmed? Macro Monday 17
The Dow Theory Confirms Bear Market
Today’s post may be thee most important Macro Monday of 2023 as it may be a key moment where we received technical confirmation of a change to a bear trend.
What’s Got Me Rustled?
Manuel Blay, the lead economist and editor from the Dow Theory has recently confirmed an S&P500 bear trend change to his subscribers. Why is this so important? Historically, the Dow Theory has provided some of the best signals for market participants. From 1920 to 1975 the Dow Theory signals captured 68% of the moves in the Industrial & Transportation Averages and 67% of those in the S&P 500 Composite Index.
Over recent years I have been keeping an eye on The Dow Theory’s predictions and they were one of the few who signalled a warning in early 2001 before the Dot.Com Crash in Sept 2001, and they signalled a warning prior to March 2020 COVID-19 Crash. They were also one of the few who turned bullish on the market from November 2022 when bears were out in their droves.
The Dow Theory has a proven track record of outperforming the stock market with significant drawdown reduction (less skin in the game during downturn periods). The Dow Theory is one thee most top ranked investment letters and people will pay very close attention to this recent release by Manuel Blay.
What is Dow Theory and How Does It Work?
There are many elements to the Dow Theory and I am going to try and explain some of the basics with the help of some charts.
In basic terms the Dow Theory is a technical framework that predicts when the market is in an upward trend if one of its averages (Such as Dow Jones Transportation Average) advances above a previous important high, accompanied or followed by a similar advance in another corresponding average (such as Dow Jones Industrial Average).
The theory is predicated on the notion that the market discounts everything, consistent with the Efficient Market Hypothesis. Efficient Market Hypothesis is something I live by, it is the hypothesis that states that share prices reflect all information, price being the aggregation of everything that’s happening. Price over everything, over the news and any other outside factors. Consistent alpha generation is possible focusing only on price. This hypothesis chants “the market knows best” or “trust the intelligence of the market/price”). The Dow Theory uses a combination of markets to help achieve agreement for the overall market trend using price.
In such a paradigm, different market indices must confirm each other in terms of price action and volume patterns until trends reverse. This means that one chart can lead another. It also means that if multiple charts are confirming a particular trend, this adds weight to the probability that that the new price direction is the new trend. This is important to understand as today we will see that out of the four most common charts used by the Dow Theory, three of them are confirming the bear trend and the fourth is leaning bearish (the final confirmation outstanding).
“The Dow Theory for the 21st Century” by Jack Schannep should be your go for a more detailed understanding of the Dow Theory or visit the TheDowTheory.com and become a subscriber.
The Bearish Signals are here
As noted above the Dow Theory mainly focuses on the price movements of four major market indices all of which we will individually cover on today’s Macro Monday:
1. S&P500 – Three Bearish Signals
2. Dow Jones Industrial Average Index – Three Bearish Signals
3. Dow Jones Transportation Average Index – Three Bearish Signals
4. NYSE Arca Major Markets Index – Two Bearish Signals (one pending)
S&P500 - SP:SPX
The price and price structure on the S&P500 chart has provided us with 3 key bearish confirmations (see Chart 1 Above)
Dow Jones Industrial Average Index - TVC:DJI
The DJI is significantly more bearish than the S&P500 as it failed to make a new high since its high in Jan 2022 whilst the S&P500 broke to new highs in July 2023. We could consider this as a negative divergence with the DJI providing us an advance warning due to its failure to establish a new high in July 2023, instead it confirmed a lower high.
The price and price structure on the TVC:DJI Chart has provided us with 3 key bearish confirmations also (see Chart 2 Below).
Dow Jones Transportation Average Index - DJ:DJT
Similar to the Dow Jones Industrial Average (DJI), the DJT also confirmed a lower high in July 2023 compounding the bearish signal already observed in the DJI. These could also be considered double tops with a lower high for the latter two.
The price and price structure on the TVC:DJI Chart has provided us with 3 key bearish confirmations also (see Chart 3 Below).
NYSE Arca Major Markets Index - TVC:XMI
Similar to the S&P500 the XMI chart made a higher high in July 2023 however this was a false break out followed by a throw over with price then falling through the 21 week moving average.
The price and price structure on the TVC:XMI Chart has provided us with 2 key bearish confirmations with the third pending confirmation, however with the 21 week moving average sloping downwards and with the three other charts above already having breached the diagonal resistance line, it is highly probable that the XMI will follow suit and breach its diagonal support line (see Chart 4 Below).
As you can see all charts are strongly suggesting that we have started to turn into bearish trend and all have an heir of a double top pattern. To be clear, this is using the Dow Theory approach which historically has been very effective at getting us on the right side of probability but there are no guarantees, there are times the Dow Theory has been completely wrong. Given that three of the charts are in complete agreement with the fourth looking liking to confirm a similar bearish path, probability strongly in the favour of the bears. For those who appreciate this theory they would now start to make some changes to their portfolios to protect themselves from a drawdown event, as noted in the introduction protection from drawdown events is where The Dow Theory really shines.
The Halloween Effect might fool us all
The Halloween effect on the markets is based on the historical tendency for the stock market to perform better between Halloween Oct and May Day (the "winter" months) than in the other six months of the year ("summer" months). It closely related to the oft-repeated advice to sell in May and go away. In particular the months of Oct – Dec are some of the best return months impacted by the Halloween effect. I will follow up with a chart in the comments that illustrate the % return of the Halloween effect versus the summer months.
In the past the Dow Theory and other market indicators have provided confirmation of a bear trend and the market has made higher highs thereafter only to be thrown over into a longer bear market many months later confirming the original bear trend thesis. The point being is that it is probable we are going to see some impact from the Halloween Effect and this could in fact press prices higher in the short term, and in some cases we can even make higher highs. We need to be extremely cautious if we make reasonable progress during the Halloween Effect period, perhaps this could be seen as an opportunity to take some profits and de-risk some of your portfolio.
I have covered the XMI, DJT, XMI and DJI charts in detail previously on Tradingview and here. Please review them if you would like to get more familiar with their components and historical performance.
As always folks, stay nimble in this market and reduce risk where possible
PUKA
