DJI

#SP500 UpdateAlthough the count may look complete, the scenario allows that there can be one more wave down before resuming the uptrend.

NDX - Rising Trend Channel [MID-TERM]🔹Rising trend breaking downwards in medium long term.
🔹Support at 13700 and Resistance at 15800.
🔹Technically positive for the medium long term.
Chart Pattern:
🔹DT - Double Top | BEARISH | 🔴
🔹DB - Double Bottom | BULLISH | 🟢
🔹HNS - Head & Shoulder | BEARISH | 🔴
🔹REC - Rectangle | 🔵
🔹iHNS - inverse head & Shoulder | BULLISH | 🟢
Verify it first and believe later.
WavePoint ❤️

SPY - Rising Trend Channel [MID-TERM]🔹Rising trend breaking downwards in medium long term
🔹Support at 430 dollars, indicating a potential positive reaction as it rises to 477 or more.
🔹Technically positive for the medium long term.
Chart Pattern:
🔹DT - Double Top | BEARISH | 🔴
🔹DB - Double Bottom | BULLISH | 🟢
🔹HNS - Head & Shoulder | BEARISH | 🔴
🔹REC - Rectangle | 🔵
🔹iHNS - inverse head & Shoulder | BULLISH | 🟢
Verify it first and believe later.
WavePoint ❤️

DJI - Rising Trend Channel [MID-TERM]🔹Rising trend breaking downwards in medium long term.
🔹Support level is around 34425, indicating good buying opportunities.
🔹Support at 34200, potentially indicating a POSITIVE reaction, but a break downwards through 34200 indicating a NEGATIVE signal.
🔹Technically positive for the medium long term.
Chart Pattern:
🔹DT - Double Top | BEARISH | 🔴
🔹DB - Double Bottom | BULLISH | 🟢
🔹HNS - Head & Shoulder | BEARISH | 🔴
🔹REC - Rectangle | 🔵
🔹iHNS - inverse head & Shoulder | BULLISH | 🟢
Verify it first and believe later.
WavePoint ❤️

Dow Jones Industrial Average Key MomentMACRO MONDAY
Dow Transportation Average Index DJ:DJT
The Dow Jones Transportation Average (DJT) is a price-weighted average of 20 key transportation stocks traded in the United States.
The transportation sector acts as a leading indicator as it is further up the value chain ahead of the final products being sold by companies in Dow Jones Industrial Average $DJI. For this reason, in some circumstances we can use the DJT as a helpful leading indicator for the direction of the economy
Currently we are at a critical juncture on the DJT chart as we are testing significant resistance levels
- The DTJ Index is at a critical diagonal and horizontal
resistance level
- A break through or rejection of the resistance will
provide insight into the direction of the economy
- There is a potential Head and Shoulders pattern
that needs to be validated or invalidated which will
be defined by the price reaction to the resistance
zone.
We can observe what happens over the coming weeks and how price reacts to the resistance. Can it break above it and turn it into support?
When the DJI is climbing higher while the DJT is falling, it can be a signal of economic weakness ahead. A divergence of this sort means goods are not being transported at the same rate they are being produced, suggesting a decline in nationwide demand.
This type of divergence occurred prior to the March 2020 crash with the DJT making its ATH in Dec 2020, thereafter the DJI made a new ATH in February 2020 whilst the DJT was closing almost 5% lower making a lower high. Those that study Dow Theory were key observers of the divergence and acted accordingly safeguarding their portfolios.
Thankfully, at present there is no divergence. I will follow up in the comments with a chart showing that the DJI and the DJT are currently very closely aligned. Regardless paying close attention for a divergence could be very beneficial for your portfolio. I will certainly be on the look out and notify you in the event of.
Thanks for reading and welcome to Macro Mondays
PUKA

Hellena | DJI (4H): Short to support area 34628Dear colleagues, I anticipate that the price will continue to decline towards the support area at 34628.
Manage your capital correctly and competently! Only enter trades based on reliable patterns!

Michael Burry Bets $1.6B On Market Crash - Dow Jones Down 500+Michael Burry has placed a substantial $1.6 billion bet on an imminent stock market crash, representing 90% of his firm's assets.
Known for his accurate prediction of the 2008 US housing market crash which netted him $100 million, Burry's recent move follows a 500-point drop in the Dow Jones in just two days.
Despite this downturn, the Dow Jones has shown a positive trend in 2023, rising over 1,500 points. It's vital for investors to discern between short-lived market shifts and long-term trends.
An in-depth analysis of the Dow Jones reveals a robust support level from December 2022 at $34,712, further reinforced by the daily 50 SMA just beneath.
This strong support could be pivotal in pushing the index upwards, potentially eclipsing its January 2022 record high of $36,952.

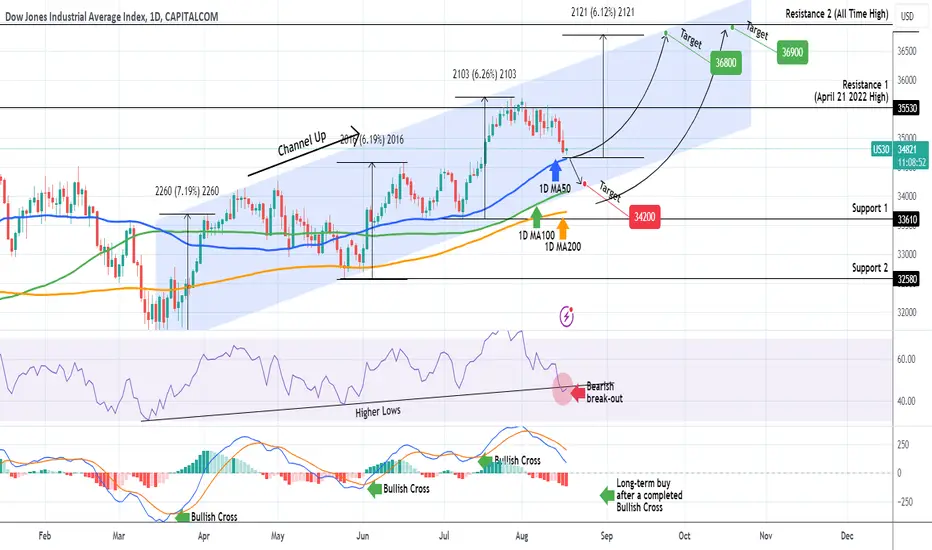
DOW JONES First time near the 1D MA50 since July 10.Dow Jones is having the strongest pull-back since late May, so far still within the technical boundaries of the 5 month Channel Up. In doing so, it is only a few points before hitting the 1D MA50 (blue trend-line), which has been intact since the July 10 Low. Despite that contact, the index hasn't closed a 1D candle below the 1D MA50 since June 01, which was at the start of that Channel Up Higher Low.
As a result, we remain bullish aiming at a +6.10% rise to 36800, as long as the 1D candle closes above the 1D MA50. If it fails we will take the small loss and quick sell instead towards the 1D MA100 (green trend-line) at 34200, which is exactly at the bottom of the 5-month Channel Up.
If that scenario is materialized, then we will only buy again after the 1D MACD completes a Bullish Cross, most likely (but not necessarily) closer to the 1D MA200 (orange trend-line). In that case our buy target will be 36900, just below the All Time High of 2021.
P.S. The 1D RSI already broke below its Higher Lows trend-line, potentially an early bearish warning.
-------------------------------------------------------------------------------
** Please LIKE 👍, FOLLOW ✅, SHARE 🙌 and COMMENT ✍ if you enjoy this idea! Also share your ideas and charts in the comments section below! **
-------------------------------------------------------------------------------
💸💸💸💸💸💸
👇 👇 👇 👇 👇 👇
Stocks still struggling - $SPX copying late 2021?The risk in #stocks is still not to the upside.
Took a trade before this rally, but that's it, a trade, already done too.
Lower low today, still expect to be positive for the day, but until we get some sort of reversal, the risk is still to downside. TVC:DJI AMEX:UDOW
NASDAQ:NDX is trying to find a bottom but here's not best place. Very light support.
CBOE:SPX looks weakest of the 3.
We could very well be doing what happened in late 2021. One last hurrah & then kaput.

$DJI has been weak, can it keep going lower?We almost called top on the #indices.
DJ:DJI AMEX:DIA
Daily
Few days ago stated that it could drop 1k points.
Weekly
Yellow areas are the best risk reward entries, for a bounce or if we continue higher.
Monthly
Choppy action is 100% normal since 2018 (Only after CV crash it went straight up). This was not the norm prior to 2018. Usually had few months of up or down patterns.
#stocks AMEX:UDOW AMEX:SDOW

$DJI is at do or die hereDAILY
TVC:DJI is really struggling to hold the green moving avg. (see profile for more info)
#Dowjones RSI is holding the 50 area - Yellow Box.
NOW, pay close attention
IF they break we're looking at likely trendline retest, white line.
That's where the possible 1k point drop idea comes from, mentioned yesterday.
Weekly support, Red Mov Avg, shows another view for the possible, roughly, 1k point drop for the Dow.
#stocks AMEX:DIA AMEX:UDOW AMEX:SDOW

DJI yearly CRASH or Sideways incoming??Looking at past times on DJI yearly time frame where Stoch rsi has crossed below the 80line it has resulted in major market crashes or dead sideways markets for long periods.. With how the economy is world wide at the moment id say things are about to get pre ugly for the markets.
Monthly time frame also trying to set a Lower High.. Not feeling too optimistic
Any thoughts on subject is welcome and would love to hear others opinions on the current state

$DJI holding better than other indicesAMEX:DIA has been pretty resilient lately. Stronger than TVC:NDQ , SP:SPX , & $RUT.
IMO
Even if #inflation goes up, #stocks can follow. Historically, many countries have shown, this has been the case. Eventually, when the music stops it's ugly. But, we'll deal with that when we get there.
Risk is not as bad as it was a few days ago. Risk is waning again.
Let's say, for giggles, 1k more drop for TVC:DJI , not so bad.

DOW JONES The Inverse Head & Shoulders no-one is talking about.The Dow Jones (DJI) index remains within its 5 month Channel Up pattern that started in mid March and recently hit its top. What the majority of the market is missing is a stronger pattern on the wider 1W time-frame. This long-term chart shows that an Inverse Head and Shoulders (IH&S) pattern priced its Head (bottom) when the Channel Up started and completed the Right Shoulder on the first week of July.
As a result, the aggressive 3 week rally that followed is a natural consequence of the completion of that pattern, similar to the October - November 2022 rally that led to the start of the IH&S. Such patterns can technically target as high as the 2.0 Fibonacci extension level, which sits just above the 36975 All Time High. As the 1W RSI is bounce on a Pivot level (formerly a Resistance), we have more reasons to continue to be bullish in this market and target first the 35900 Resistance and ultimately the ATH at 36975, potentially all within the boundaries of the Channel Up.
-------------------------------------------------------------------------------
** Please LIKE 👍, FOLLOW ✅, SHARE 🙌 and COMMENT ✍ if you enjoy this idea! Also share your ideas and charts in the comments section below! **
-------------------------------------------------------------------------------
💸💸💸💸💸💸
👇 👇 👇 👇 👇 👇

Dow Jones - 10/08Pair : DJI - Dow Jones
Description :
Completed " 123 " Impulsive Wave
Falling Wedge in STF and Rejection from UTL
S / R Level
Fibonacci Level - 38.20% / 50.00%
Divergence - RSI

DIA - Rising Trend Channel [MID-TERM]🔹Achieved target at 351 after breaking Rectangle formation.
🔹Supports 342 in NEGATIVE reaction.
🔹RSI curve shows rising trend, supporting positive trend.
🔹Technically POSITIVE for medium long term.
Chart Pattern;
🔹DT - Double Top | BEARISH | 🔴
🔹DB - Double Bottom | BULLISH | 🟢
🔹HNS - Head & Shoulder | BEARISH | 🔴
🔹REC - Rectangle | 🔵
🔹iHNS - inverse head & Shoulder | BULLISH | 🟢
Verify it first and believe later.
WavePoint ❤️

#SP500 Update #SPYThe outlook remains unchanged supported (biased) by similar patterns that I see in precious metals that chose to correlate with US markets thus far.

Hellena | DJI (4H): Short to diagonal lineDear colleagues, I believe that wave 3 has completed and the price is undergoing a correction to at least the 35000 area.
Manage your capital correctly and competently! Only enter trades based on reliable patterns!

NDX - Rising Trend Channel [MID -TERM]🔹Index shows NEGATIVE signal from double top formation, broke support at 15426.
🔹Signals further decline to 15057 or lower.
🔹Supports 13600 and resistance at 15800
🔹Technically NEUTRAL for medium long-term.
Chart Pattern;
🔹DT - Double Top | BEARISH | 🔴
🔹DB - Double Bottom | BULLISH | 🟢
🔹HNS - Head & Shoulder | BEARISH | 🔴
🔹REC - Rectangle | 🔵
🔹iHNS - inverse head & Shoulder | BULLISH | 🟢
Verify it first and believe later.
WavePoint ❤️

✅ Daily Market Analysis - FRIDAY AUGUST 04, 2023Key News:
USA - Average Hourly Earnings (MoM) (Jul)
USA - Nonfarm Payrolls (Jul)
USA - Unemployment Rate (Jul)
Canada - Employment Change (Jul)
Canada - Unemployment Rate (Jul)
European markets faced a challenging day yesterday, witnessing a continuation of losses. The DAX marked its fourth consecutive day of decline, while the FTSE100 closed lower for the third straight session. Despite the persistent downward trend, there was a glimmer of hope as both indices managed to recover slightly from their day's lows, suggesting a hint of resilience in the market.
DAX indices H4 chart
FTSE100 indices daily chart
In the US, the trend of market declines continued for the third consecutive day. Despite the US dollar reaching a fresh four-week high, it ended the day unchanged. The Dow also closed lower on Thursday, influenced by rising Treasury yields reaching multi-month highs. This increase in yields dampened investor sentiment as they awaited the upcoming jobs report scheduled for release on Friday.
Dow Jones Industrial Average Index daily chart
Despite positive earnings reports from tech giants Apple and Amazon after the market's close, market sentiment hasn't seen a notable surge as we approach the weekend.
One potential factor contributing to this week's market weakness is the recent Fitch downgrade of the US AAA rating to AA+. While the downgrade itself didn't provide any new information, it might have impacted investor confidence. Nevertheless, the overall state of the US economy appears to be robust, with the services sector showing resilience, even amidst concerns about the manufacturing sector.
The July ISM survey further demonstrated the economy's strength, with a solid performance. Prices paid increased, indicating ongoing inflation concerns, which may result in sustained elevated interest rates for an extended period. The employment component of the survey, however, ticked lower, suggesting potential cautiousness in hiring practices.
Despite these factors, the market sentiment remains cautious as the weekend approaches. Investors are likely to keep a close eye on any developments that could impact the overall market outlook going forward.
US nonfarm payrolls
The focus of the day lies on the release of the July jobs report in the US, which comes after the recent 25 basis points rate hike by the Federal Reserve, possibly the final hike of the current cycle. Market expectations are for the report to highlight the continued strength and resilience of the US economy.
Analysts anticipate the addition of approximately 200,000 jobs to the US economy, with the unemployment rate remaining steady at 3.6%. However, there might be a slight dip in average hourly earnings, dropping from 4.4% to 4.2%.
Meanwhile, Canada's jobs report is also expected to show robust numbers, following the addition of 59,000 jobs in June.
The pound experienced a volatile trading day yesterday, touching a one-month low before staging a strong rebound to finish unchanged.
The Bank of England's recent decision to raise interest rates by 25 basis points, bringing them to a new 15-year high, has raised some questions. There are indications that rates might stay at their current levels for an extended period. Comments from Deputy Governor Ben Broadbent have suggested that the UK's rate policy is already restrictive and that interest rates might now be above the neutral rate. Future rate hike decisions will likely depend on the upcoming CPI inflation reports, with the first one due in under two weeks.
In the forex market, the GBP/USD pair is showing a positive outlook, breaking a four-day losing streak during the early Asian session on Friday.
GBP/USD daily chart
Today, gold prices saw a modest rise as traders exercised caution in anticipation of the release of crucial labor data that could have an impact on US monetary policy decisions. The market remains watchful, and the outcome of the labor data is likely to influence investor sentiment and the direction of gold prices in the near term.
XAU/USD daily chart
Earlier this week, the price of gold experienced a notable decline, primarily driven by concerns surrounding a potentially hawkish stance from the Federal Reserve, which in turn strengthened the US dollar. As the market perceived the US economy to exhibit resilience, expectations of further interest rate hikes by the Federal Reserve increased, with the belief that there is ample room for additional economic adjustments. These factors have played a significant role in shaping the recent movements of gold prices in the market.

✅ Daily Market Analysis - MONDAY JULY 31, 2023Key News:
China - Manufacturing PMI (Jul)
Eurozone - CPI (YoY) (Jul)
The Dow Jones Industrial Average celebrated a third straight weekly gain, rising 0.5% or 176 points. The surge was driven by investors' interest in leading tech and chip stocks. The market rally was fueled by declining Treasury yields and signs of inflation deceleration, leading to optimism that the Federal Reserve had concluded its interest rate hike. Nasdaq soared 1.9%, and the S&P 500 climbed 1% in response to the positive news. Despite short-term gains, investors remain cautious of potential challenges like geopolitical uncertainties and supply chain disruptions.
DJI indices daily chart
Nasdaq indices daily chart
S&P500indices daily chart
The Dow Jones Industrial Average continued its winning streak, largely propelled by significant gains in big tech companies, including Apple Inc (NASDAQ: AAPL), Meta Platforms Inc (NASDAQ: META), Alphabet Inc Class A (NASDAQ: GOOGL), and Microsoft Corporation (NASDAQ: MSFT). These tech giants showcased a positive performance, backed by a decline in Treasury yields, triggered by a notable slowdown in a key Fed inflation measure.
The personal consumption expenditures, a crucial inflation indicator, displayed a considerable deceleration, growing at a 0.2% pace in June, compared to 0.1% in the previous month. Moreover, the annual pace for the same period stood at 3%, significantly lower than the 3.8% recorded in the prior month. This data served to reinforce the market's belief that the Federal Reserve might pause its monetary policy tightening.
As investor confidence in a potential Fed pause grew, both the 2-year and 10-year Treasury yields slipped. Investors adjusted their expectations, reducing the likelihood of further rate hikes in the near future.
The positive performance of tech giants and the decline in Treasury yields contributed to the Dow Jones' third consecutive weekly win. This market rally signifies growing optimism among investors, but potential challenges, such as geopolitical uncertainties and supply chain disruptions, warrant cautious consideration. Staying informed and employing prudent investment strategies will remain essential as the market continues to evolve.
US02Y Treasury yields
US10Y Treasury yields
In a week marked by volatility and month-end trading, the US Dollar experienced a noteworthy surge of 1.6% against the Japanese Yen, reaching 141.15, up from 139.50. However, the Dollar's performance against other major and emerging market currencies presented a more mixed picture.
The Dollar's substantial gain against the Japanese Yen was likely influenced by various factors, including shifts in market sentiment, economic data releases, and geopolitical developments. The Yen is often considered a safe-haven currency, sought by investors during times of uncertainty. Therefore, any fluctuations in global sentiment may have prompted investors to move funds into or out of the Yen, influencing its exchange rate against the Dollar.
On the other hand, the Dollar's performance against other currencies was less uniform. This could be attributed to varying economic conditions and policy outlooks in different countries, as well as diverging interest rate expectations. Central banks' monetary policies, economic indicators, and geopolitical events all play a role in shaping currency valuations and exchange rate movements.
USD/JPY daily chart
The Bank of Japan (BOJ) caught the markets off guard during its recent meeting by making an unexpected adjustment to its Yield Curve Control policy. The BOJ announced its intention to purchase 10-year Japanese Government Bonds (JGBs) at a yield of 1.0% every day. This move led to market turbulence as investors reacted to the surprising tweak in the central bank's bond-buying program.
Despite this adjustment, Japan's Policy Rate remained unchanged at -0.10%. The Policy Rate represents the interest rate at which financial institutions can borrow from the central bank, and the BOJ's decision to keep it steady indicates its commitment to maintaining an accommodative monetary policy stance.
BOJ Governor Ueda sought to clarify the central bank's intentions during a subsequent press conference. He emphasized that the recent adjustment in the Yield Curve Control policy should not be interpreted as a step towards rate normalization. In fact, Governor Ueda assured that the BOJ has no immediate plans to raise interest rates and, instead, aims to weaken the Yen.
The BOJ's actions are driven by a desire to support Japan's economy and achieve its inflation target. By purchasing JGBs at a fixed yield, the central bank aims to influence borrowing costs and stimulate economic activity.
Meanwhile, in Australia, unexpected declines in both June Retail Sales and Producer Prices had a negative impact on the Australian Dollar (AUD). The AUD dropped from its Friday opening level of 0.6710 to close at 0.6650, reflecting investors' concerns about the country's economic performance.
The decline in Retail Sales indicates weaker consumer spending, which is a crucial component of economic growth. Additionally, lower Producer Prices may signal reduced business profitability and potential downward pressure on inflation. Both factors combined to create uncertainty about Australia's economic outlook, leading to the AUD's depreciation.
Currency markets are highly sensitive to economic data releases, central bank decisions, and global events. As demonstrated by the recent developments in Japan and Australia, unexpected news and policy changes can result in significant currency fluctuations.
AUD/USD daily chart
he Australian Dollar (AUD) experienced turbulence in response to unexpected economic data releases in Australia. June Retail Sales recorded a significant decline of -0.8%, falling short of the anticipated 0% growth. Moreover, the Producer Price Index (PPI) on a year-on-year basis dropped to 2.0%, considerably lower than the previous figure of 5.2% and below estimates of 2.9%. These surprises in economic indicators raised concerns about the country's economic performance and resulted in fluctuations and uncertainties in currency markets during the week and month-end trading.
As a result of the AUD's depreciation, it dropped from its Friday opening level of 0.6710 to close at 0.6650 against other major currencies, reflecting investors' cautious stance.
In the midst of economic uncertainties, gold prices remained relatively stable, trading within a narrow range on Monday. Investors adopted a wait-and-see approach, anticipating further significant indicators regarding the state of the US economy for the week ahead. The previous week had seen gold prices close relatively unchanged after the Federal Reserve's expected interest rate hike and its reaffirmation of plans for at least one more rate increase later in the year.
Gold, often seen as a safe-haven asset, tends to respond to changes in interest rates and economic uncertainties. The Federal Reserve's decision to raise rates as part of its monetary policy tightening can impact the opportunity cost of holding gold, as higher interest rates may make other interest-bearing assets more attractive to investors.
XAU/USD daily chart
Inflation Eases, Nonfarm Payrolls Awaited: Impact on Rates and Gold Prices
Last week, a report revealed that inflation, particularly measured by the Fed's preferred gauge, eased further in June. This development may lead to a less aggressive approach from the central bank in terms of rate hikes.
Investors are now focused on the release of key US nonfarm payrolls data this week, as it is expected to provide insights into the strength of the labor market. Despite the Fed's intention to cool down the labor market with rate increases, US employment has remained robust throughout the year, possibly prompting the central bank to adopt a more hawkish stance.
Minneapolis Fed President Neel Kashkari's comments suggested a data-driven approach to future rate hikes, indicating that decisions would depend on incoming economic data. He expressed positive sentiments on inflation but also anticipated some cooling in the labor market this year.
For gold, any potential pauses in the Fed's rate hike cycle could have a positive impact, as rising interest rates tend to increase the opportunity cost of holding the precious metal. However, strong US economic readings from last week put downward pressure on gold prices, as concerns arose that the strength in the US economy might allow the Federal Reserve to continue hiking rates.
As the markets eagerly await the nonfarm payrolls data and closely monitor inflation trends, the US Federal Reserve's future actions will likely heavily influence both currency and commodity markets. Investors should closely follow economic indicators, central bank communications, and geopolitical events to make informed decisions amidst the evolving economic landscape.

$DJI $NDX $SPX $RUT closesHow #indices closed last week.
TVC:DJI
After a BEARISH ENGULFING it then closed Friday with a doji = battle for the bulls and bears which is unresolved
NASDAQ:NDX
Fighting back but it is still showing Negative RSI Divergence.
SP:SPX
Suffering from Negative Divergence. We''ll how #SPX trades over the next few days, weeks. AMEX:RSP (Equal weight) was weaker. This means that the usual big boys pulled more weight.
TVC:RUT needs big move soon, lower highs.
Lots of earnings this week! Have a great trading week!
