DJI being squeezed into a long term bearish wedgeI know, I sound like a bear monger when the market looks very bullish and at best possible technical support. Nothing wrong with taking advantage of it, but shouldn't forget the bigger picture. The market valuation has been pushed up by easy money since GFC and valuation. The covid money printing made it worse. Bigger the bubble, bigger the burst
With recession around the corner and many hedge funds are facing margin calls, the risks are highest from all metrics, market/GDP, Pe ratios, real income growth, jobs are all slowing down, Debt to GDP has only accelerated. Fringe Economist have been crying wolf since GFC and they are not wrong but when ? This year ?
The market could rally one last leg up to finish in a ending diagonal (if you know wave theory)
DJI

DOW JONES Will the 1week MA200 save the day?Dow Jones / US30 almost reached its 1week MA200 today and immediately rebounded.
Last time it approached it so closely was on October 23rd 2023 and last it crossed under it was September 19th 2022.
The most recent was the first higher low of the 3 year Channel Up and the latter was the bottom of the last bear market.
The 1week RSI hasn't been this low since June 13th 2022, which was again a near 1week MA200 test that caused an immediate rebound to the 1week MA50 before the rejection to the eventual bear market bottom.
As long as the 1week MA200 holds and closes the candles over it, we expect the Channel Up to start a near bullish wave like post October 2023.
Target 45200 (same as the March 2024 rally) which is around the All Time High.
Follow us, like the idea and leave a comment below!!

DJI - Rising Wedge + Double TopDJI showing a rising wedge which is a bearish pattern on this Daily chart
Also right before the prior down movement is a double top in red
Breakdown further out of this rising wedge pattern

Just In: The Dow Jones Industrial Average (DJI) Dip 1,300 PointsOverview
The Dow Jones Industrial Average, also known as the DJIA or simply the Dow, is a market index frequently used to gauge the overall performance of the U.S. stock market. Indexes like the DJIA track the prices of a group of securities.
The Consumer index saw a downtick of 1300 points representing a 5.5% dip. This was days after Donald Trump declared a new set of tariffs targeting 185 countries, including major U.S. trading allies.
Tariffs Concern
The US stocks are poised to continue their bloodbath as futures signaled more fear over President Donald Trump's tariffs. Administration officials and Trump himself signaled on Sunday that they won't back down from their aggressive decisions. Meanwhile, an inflation report is due later this week as well as bank earnings.
Wall Street remained in fear mode over President Donald Trump's tariffs on Sunday evening as futures pointed to more steep losses.
The S&P 500 futures also sank 3.9% and Nasdaq futures dived 4.9%. That follows a devastating week that saw the worst selloff since the early days of the COVID-19 pandemic.
Similarly, the 10-year Treasury yield dropped 8.5 basis points to 3.906%, and US crude oil prices fell 3.7% to $59.72 a barrel.
Countries affected by the tariff rates are:
China (34%), the European Union (20%), and Japan (24%). Fitch Ratings estimated that the effective tariff rate could hit 25% on average — the highest in more than 115 years.
In an X post on Sunday, Former Treasury Secretary Larry Summers cautioned, saying there's a very good chance of more market turbulence similar to what was seen on Thursday and Friday.
Those sessions represented the fourth largest two-day drop in the last 85 years, Summer said. The selloff wiped out about $6 trillion in market cap.
“A drop of this magnitude signals that there’s likely to be trouble ahead, and people ought to be very cautious,” Summers wrote.
Meanwhile, Trump administration and the president himself defended the tariffs.
Technical Outlook
as of the time of writing, the The Dow Jones Industrial Average (DJI) Dip index point is down 5.5% trading in tandem with the support point that aligns with the 38,000 points. On a bearish case scenario, a break below this axis could be canning for the stock market as it will lead to panic selling in the industries concerned.
Similarly, should the bulls manage to thrust the DJI points up to the 42,000 points, we should experience a respite from the bears and possibly increased momentum might sent the stocks soaring higher. With the RSI at 23, this is hinting to a weak momentum with more downside ahead.

Is This a Bear Market or a Golden Opportunity?The indices have plummeted sharply, and whether you believe this is due to Trump’s tariffs or would have happened anyway, regardless of the trigger, the reality remains the same.
Both the S&P 500 and Nasdaq 100 are officially in bear market territory— defined by a decline of more than 20% from their peaks . Meanwhile, the Dow Jones Industrial Average is down approximately 15%.
Given these facts, the big question is: Are we in a bear market, or is this a fantastic buying opportunity? 📉📈
Now, let's break down the key levels, potential scenarios, and how to approach the current market environment. 🚀
Dow Jones 30 (DJI): Navigating Key Support and Resistance Levels
On the weekly chart, DJI has been in an uptrend since the pandemic lows of 2020. The double top formation from 45k measured target has already been exceeded, and the index is now approaching a critical confluence support zone between 37k and 37,700.
📌 My Outlook:
• I believe this support will hold in the near future, presenting a buying opportunity.
• Resistances: 40k and 41,600 are important technical levels and potential targets for bulls.
💡 Alternative Scenario:
• If DJI starts rising without testing the long-term confluence support, I will focus on selling opportunities, particularly around the 41,500 zone, as we have 2 unfilled gaps from last week.
________________________________________
S&P 500 (SPX): Bear Market Territory, But Still Holding Uptrend (posted main chart)
According to classical theory, SPX is now officially in bear market territory. However, we are still above the ascending trend line established from the 2020 pandemic low, and approaching a confluence support zone around 4,820 - 4,900.
📌 My Outlook:
• I will be looking for buying opportunities if the index continues its decline towards the 4,820 - 4,900 zone next week.
• Target: Filling the first gap at 5,400.
💡 Alternative Scenario:
• If the week begins positively, and SPX doesn’t reach the 4,900 support zone, I will focus on shorting opportunities on gap filling, aiming for a return to 5,000.
________________________________________
Nasdaq 100 (Nas100): Hovering Above Key Support
Unlike DJI and SPX, Nas100 is still well above the ascending trend line from the 2020 pandemic low. However, it is nearing an important horizontal support defined by the 2021 ATH and the 2024 lows.
📌 My Outlook:
• Drops towards 17k or slightly lower could present good buying opportunities, anticipating a potential rise to fill the gaps.
💡 Alternative Scenario:
• If the price rises above 18.500k zone without dipping under 17k I will look for selling opportunities.
Disclosure: I am part of Trade Nation's Influencer program and receive a monthly fee for using their TradingView charts in my analyses and educational articles.

Combined US Indexes - Lower High Lower Low checked; What next...As previously expected, a lower low has been achieved.
What was not expected was the speed, magnitude and extent of the fallout.
Next up, since it is about 3.5 Standard Deviations out, we can start looking for a consolidation, although there might be slightly more downside and we need a higher low in the expected range within box. Having said that, it is possible to see it overextend downwards briefly.
There is a long term support, Fibonacci downside target zone just below.
So expecting a short term bounce between Monday to Wednesday at the earliest, and following that a consolidation area formation.

Combined US Indexes - Lower High checked; Lower Low next...As expected from previous analysis, there is a lower high likely as the TD Sell Setup is Perfected. This just missed the target but has the TD Bear Trend intact
Following, a Bearish Engulfing pattern plus a Gap Down occurred yesterday.
Breaking back into Extension Zone box... and likely to protrude out the other side.
MACD is turning down in the bearish zone too.
So, looking for a lower low now...

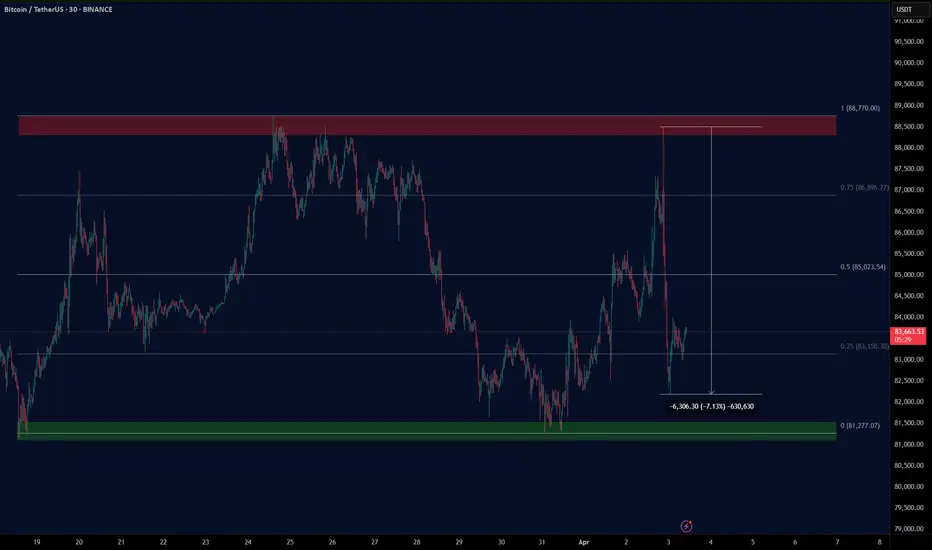
BTC TARIFF TALKAs President Trump steps up on the stage to deliver his tariff plan BTC had a steady price rise going into the talk, a nice HH & HL LTF structure up into range high/ last weeks high, then as the speech began all of the progress made throughout the day wiped in less than 2 hours to reset BTC's price to Tuesdays low.
In the end the news event gave volatility as expected but ultimately the structure remains the same, rangebound. As the Tax year comes to an end it would be a hard ask for this choppy price action to shift bullish when institutions are going to be window dressing their portfolios for the next financial year.
In essence A continued LTF range with an overall HTF bearish trend looks to continue, this is compounded by yet another failed attempt at the 4H 200 EMA which had temporarily been broken but sent back below by the tariff announcements.
The SPX, DJI & NASDAQ Futures pre-market is looks dreadful so a revisit on the range low is probable on the cards at some stage today.
DOW JONES: 4 week bottom on the 1W MA50. Best time to buy.Dow Jones turned neutral again on its 1D technical outlook (RSI = 46.611, MACD = -297.980, ADX = 37.851) as it is recovering today and more importantly keeps its price action above the 1W MA50. This is the 4th straight week that it trades and holds the 1W MA50, which is shaping up to be the natural long term support. That is keeping the 1W RSI neutral (47.224), which technically suggets that it is the most low risk level to buy. The 1W RSI made a double bottom due to this consolidation and the 1W MACD printed the first light red bar, all of which are similar to the October 23rd 2023 bottom.
Both have been bottoms after bearish waves of the 1.5 year Channel Up and as a matter of fact similar in decline rate (-9.50%). The highest probability level for a rebound and start of the new bullish wave is this, and based on the previous, it should aim for the 2.0 Fibonacci extension (TP = 49,000).
## If you like our free content follow our profile to get more daily ideas. ##
## Comments and likes are greatly appreciated. ##

Weekly Market Forecast: SELL THE INDICES!In this video, we will analyze the S&P 500, NASDAQ, AND DOW JONES Futures for the week of March 31st - April 4th.
The equity markets took a bearish turn last week. This is likely to continue for the upcoming week.
Monday is the end of March. Tuesday brings a new week and new opportunities. April 2nd brings... potentially market flipping volatility. The day the Trump tariffs are implemented.
Be careful. Let the market give you direction, and then get involved.
Enjoy!
May profits be upon you.
Leave any questions or comments in the comment section.
I appreciate any feedback from my viewers!
Like and/or subscribe if you want more accurate analysis.
Thank you so much!
Disclaimer:
I do not provide personal investment advice and I am not a qualified licensed investment advisor.
All information found here, including any ideas, opinions, views, predictions, forecasts, commentaries, suggestions, expressed or implied herein, are for informational, entertainment or educational purposes only and should not be construed as personal investment advice. While the information provided is believed to be accurate, it may include errors or inaccuracies.
I will not and cannot be held liable for any actions you take as a result of anything you read here.
Conduct your own due diligence, or consult a licensed financial advisor or broker before making any and all investment decisions. Any investments, trades, speculations, or decisions made on the basis of any information found on this channel, expressed or implied herein, are committed at your own risk, financial or otherwise.

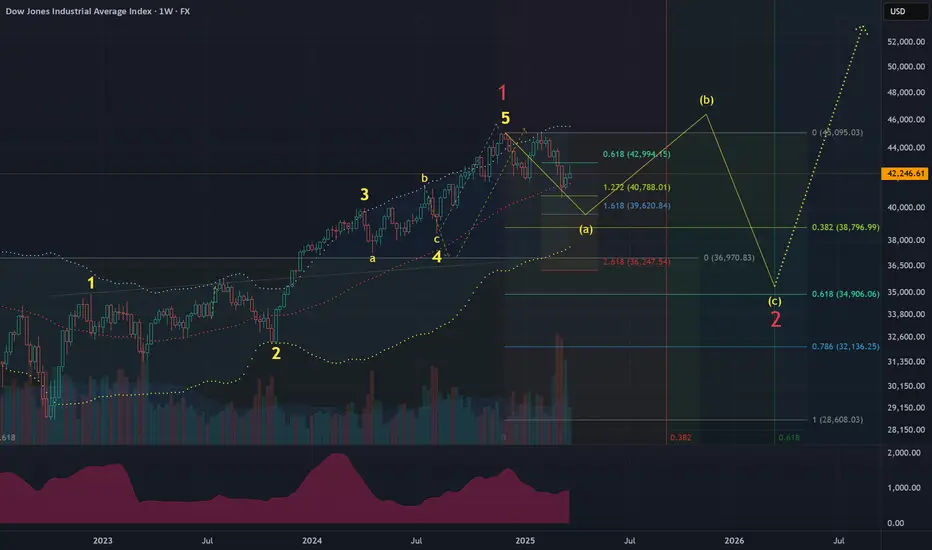
DJI US stock market forecast 2025-2026Assumption:
oct-22 — nov-24 (1-2-3-4-5) wave is over.
correction (a)-(b)-(c) is expected.
likely structure is a 3 wave regular flat.
Time:
the correction is expected to last until at least sep-25.
Price:
it's too early to predict final price for wave (c).
anticipated range is 35000-39000.
wave (a) shall reach 39600.
Long term waves:
Major uptrend lasts 25 years.
Major correcting downtrend lasts 9 years.
Next major downtrend is expected to start in 2033-2034.
BITCOIN - The Bearish Scenario - Sign's of a Possible Top...In this video, I explore the possibility that Bitcoin may have already hit a temporary peak.
My perspective comes from initially building a bullish case—only to uncover subtle flaws that I chose to set aside.
But as I meticulously documented my observations, those cracks in the bullish argument became impossible to ignore. When I switched to a bearish wave count, some thing began to align, shedding light on areas of the chart that previously seemed uncertain.
These market waves are intricate, requiring patience and a fresh perspective to decipher where we truly stand in the broader pattern.
Only after stepping back and allowing time for meaningful price action does the picture start to come into focus.
I also touch on Ethereum's pattern and the Dow Jones.

Weekly Market Forecast SP500 NASDAQ DOW: Short Term BUYS!In this video, we will analyze the S&P 500, NASDAQ, AND DOW JONES Futures for the week of March 24 - 28th. We'll determine the bias for the upcoming week, and look for the best potential setups.
The equity markets have been choppy lately, but this week may be different. The economic calendar shows a smooth week ahead, as there are no NFP, FOMC, or similarly volatile news ahead to potentially reverse a market out of the blue. The indices show potential to break consolidation and move upwards. So we wait until there are definitive market structure shifts to occur, acting as confirmations.
Only then do we pounce!
Enjoy!
May profits be upon you.
Leave any questions or comments in the comment section.
I appreciate any feedback from my viewers!
Like and/or subscribe if you want more accurate analysis.
Thank you so much!
Disclaimer:
I do not provide personal investment advice and I am not a qualified licensed investment advisor.
All information found here, including any ideas, opinions, views, predictions, forecasts, commentaries, suggestions, expressed or implied herein, are for informational, entertainment or educational purposes only and should not be construed as personal investment advice. While the information provided is believed to be accurate, it may include errors or inaccuracies.
I will not and cannot be held liable for any actions you take as a result of anything you read here.
Conduct your own due diligence, or consult a licensed financial advisor or broker before making any and all investment decisions. Any investments, trades, speculations, or decisions made on the basis of any information found on this channel, expressed or implied herein, are committed at your own risk, financial or otherwise.

Combined US Indexes - Time to make a Lower HighFrom the last time, the Combined US equity indexes did keep into the Extension Zone (EZ) as marked out. This Zone is defined from the lowest point of the TD Setup and the range is determined by the range of the candle that has the lowest point, this case being Candle 9 (4 March).
So after the expected two week in the EZ, we see an indication of the week ahead to continue the Sell Setup and break out of the EZ for the week, at least from mid-week where it would be candle 9.
According to TD rules, this Sell setup is NOT bullish, and can be expected to turn further down from resistance (Orange Line). This orange line is determined from the weekly chart where there is an ongoing TD Buy Setup (bearish) that needs to be kept intact for the trend to continue.
So, based on the techincals, the combined US equities may be seeing a last week of bullishness which goes through the yellow ellipse, then face strong resistance and continue the main Bearish trend (as depicted by the prevailing Buy Setup (20Feb to 4Mar). Noted that the main trend changed to Bear once the TDST was broken down on 3Mar.
Here are very good live examples for those keen on (Thomas) Demark indicators; watch and wait for it to develop...

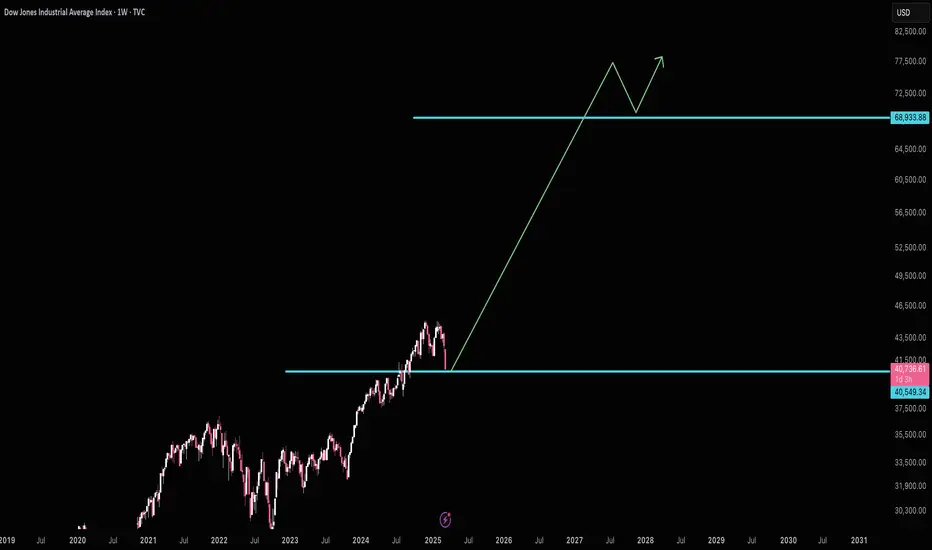
DOW JONES targeting 50000 on this final Bull yearDow Jones / US30 posted the first green weekly candle after hitting last week the 1week MA50.
This is obviously a critical support level as it has been holding since the October 30th 2023 rebound.
As this chart shows, Dow has been repeating the same patterns, Cycle after Cycle.
Right now it has entered the Final Year of Bull, which is the part where it rises aggressively to form the Top before the new Bear begins in the form of a Megaphone pattern.
The previous Bull peaked on the 2.382 Fibonacci extension of the Megaphone.
This means that a 50000 Target for Dow is perfectly plausible by the end of 2025.
Follow us, like the idea and leave a comment below!!

DOW JONES: MA50-100 Bearish Cross says we've bottomed.Dow Jones is almost neutral on its 1D technical outlook (RSI = 43.171, MACD = -608.620, ADX = 62.568), rising aggressively since last week. Technically that was the bottom no just on the 8 month Channel Up but also on the LL trendline. We've seen the very same LL bottom on the October 2023 and March 2023 lows, all of which had oversold 1D RSIs. The 1D MA50-100 Bearish Cross marked those bottoms and today we've completed a new one. Technically the index can rise as high as the 2.0 Fibonacci extension (TP = 49,000).
## If you like our free content follow our profile to get more daily ideas. ##
## Comments and likes are greatly appreciated. ##

Dow Jones 3-daily OutlookLooks like a confirmed double-top, might turn into a Head/Shoulders even.
Head Shoulders:
A common scenario with these is, it looks like a double top, then has a strong reclaim of the neckline, which is around 41.9k, and then a 2nd loss of it shortly after w/ yet another re-test with failure to reclaim.
Double Top:
Another common scenario is just a re-test and failure to reclaim, and this is a textbook double-top.
50/200 3-daily EMAs and MAs:
After losing the 50 EMA and MA, we keep dropping below the 200 EMA and MA on the 3 daily chart during stronger dips, and then finally recovering back above both.
Recovery or Recession?
Recovery:
If we want to see a recovery, we need to do that again. So, a strong move back above the 200 and 50 EMAs/MAs after losing both, down to around 38.5k and then 37.5k, possibly as low as 36.3ish.
Or, for a more immediate flip to bullish, we need to reclaim ~41.9k during any re-tests, and then head to a new ATH above 45k.
Recession:
If we don't bounce from just below the 200 EMA and MA, we might see an extended move down or even a recession.

Dow 200 Points from Major SupportThe Dow Jones is just about 200 points from major support. I should caution there's often a move through support and slightly below, but this is where all the buyers are.
(I should have drawn the arrow to hit the next major resistance/support around 2031 lol, but you get the idea)
Good luck!
Bearish Cypher on the Daily DJI?Ruh oh. It's probably not a given considering the flip floppy nature of the Trumpian markets, where every move hinges on his every word, but my whiskers are twitchin'. That's usually not good.
What do you think?
Owhooooo!

Flat correction in DOW JonesA flat correction differs from a zigzag in that the sub wave sequence is 3-3-5, as shown in chart. Since the first actionary wave, wave A, lacks sufficient downward force to unfold into a full five waves as it does in a zigzag, the B wave reaction, not surprisingly, seems to inherit this lack of countertrend pressure and terminates near the start of wave A. Wave C, in turn, generally terminates just slightly beyond the end of wave A rather than significantly beyond as in zigzags.

Dow Jones: A Make-or-Break Buy Setup with Smart Money BackingDow Jones Industrial Average - Buy Setup
Technical: U.S. markets have struggled recently due to uncertainty over tariffs imposed by President Trump. While the S&P 500 and NASDAQ have broken key support levels, the Dow remains resilient, holding the critical 41,648 support. A break below would confirm a large double-top pattern, signaling a bearish outlook. This is a pivotal moment. The rebound from overnight lows is encouraging, but with the U.S. CPI release tomorrow, caution is warranted. While speculative, COT and seasonal data favour a short-term move higher.
Fundamental: The latest Commitment of Traders (COT) Report shows increasing long interest in the Dow, suggesting "smart money" accumulation.
Seasonal: Historically, from March 12 – May 2, the Dow has posted gains 84% of the time, averaging +3.68% over the past 25 years.
Setup:
Entry: 41,800 – 42,000
Stop Loss: 41,285 (below the Nov 2024 low at 41,648)
Target: 44,290
Disclosure: I am part of Trade Nation's Influencer program and receive a monthly fee for using their TradingView charts in my analysis.

Its Been A Long Time Hasn't It?I see a possible horrible set up coming. But also an incredibly easy set up for the current US Administration to revert policy at a certain level.
I start to wonder if they are actually not looking at the market like they said. Its not like you need to look at the market for more than 5 minutes a day after doing a SINGLE in depth analysis on a longer time frame.
We will se what happens.

Combined US Indexes - Breakdown and JittersMarked out previously, the US indexes broke down a tad earlier and retested to fail only to drop further based on jitters and jitter-induced expectations.
While the candlestick is long and solid pretty much, there is an extension zone to expect more of the downside to overreach and be oversold before a bounce.
You should be able to see that the Buy Setup is pretty much done and can expect a bounce reversal soon... but only after momentum ebbs and a base support is found.
Watch for it...
