Combined US Equities - Put away all technicals for now.Oddly enough, I did not follow one of the great events of 2024. And prior analyses was made on technical indication.
When a reversal like this happens, it is rather extreme, and technicals can be put aside. With the election outcome, markets are suddenly RISK ON and very bullish.
You see this bullishness with a Marubozu type candle that broke through two resistance levels in one day - breaking into and out of the Decision Box marked.
MACD is now skewed to the bullish side although VolDiv has yet to follow. This means price moved a lot before volume.
Previous projection is redundant now.
The only indication was that the day before yesterday, a nice small bullish candlestick was suggesting a breakout to the upside.
Going forward, just enjoy the ride, and make sure you have rules to adhere to!
All the best!
DJI

TRUMP is the 47th President! Is this bullish for the markets?Donald Trump is the new (47th) President of the United States, coming into office for his 2nd time. The practical question on the investor's mind is of course how will the stock markets react?
Even though there is no definitive way to approach this, the fact that Trump will resume power for a 2nd term, gives us a historic data set to have grounds for comparison. Fundamentally anything can be discussed on policies and strategies etc but technically the picture is more objective.
As you can see on this Dow Jones (DJI) chart displayed on the 1W time-frame, Trump's 1st Presidential win was on November 08 2016. At that time, the market was trading within a Channel Up that started after a 1W MA200 (orange trend-line) double test on January 19 and February 08 2016. Right before the Elections, the index experienced a natural 'Pre-election volatility' phase.
The picture during the current election period isn't very different from 2016. As you can see, Dow started a Channel Up pattern after a 1W MA200 test and half-way through the year started to experience the usual 'Pre-election volatility' phase. During that time both in 2024 and 2016, the 1W MA50 (blue trend-line) was supporting and stayed intact. Notice how even the 1W RSI sequences between the two fractals are similar from the time the Channel Up started until the elections.
So naturally you are asking what does that mean for us moving forward? Well after the November 08 2016 elections and Trump's 1st win, Dow started to rise aggressively immediately and by March 2017 it almost reached the patterns top (Higher Highs trend-line) before the new medium-term relief pull-back. The post-election Bull Phase was concluded in January 2018, upon completing a +71% rise from the Channel's bottom and 7.0 Fibonacci extension from the volatility phase.
So if symmetry acts its part, we may see 47000 by March 2025 and 55000 (+71% from the October 2023 bottom) by the end of 2025. Is this projection definitive? Of course not, nothing is 'absolute' in investing/ trading. But history has shown that the stock market has reacted more than positively after the U.S. elections, particularly in the case of a Trump win.
What do you think? Will Trump's 2nd term be bullish?
-------------------------------------------------------------------------------
** Please LIKE 👍, FOLLOW ✅, SHARE 🙌 and COMMENT ✍ if you enjoy this idea! Also share your ideas and charts in the comments section below! This is best way to keep it relevant, support us, keep the content here free and allow the idea to reach as many people as possible. **
-------------------------------------------------------------------------------
💸💸💸💸💸💸
👇 👇 👇 👇 👇 👇

DOW JONES: Important 1H breakout that is targeting 43,000Dow Jones has turned neutral again on its 1D technical outlook (RSI = 48.701, MACD = -64.350, ADX = 34.811) as it formed the new bottom on the 3 month Channel Up and that pushed the price into a rally which today crossed over the LH trendline and the 1H MA200 for the first time since October 22nd. The 1H RSI was on a Bullish Divergence (HL) against the LL of the price, so all indicators are bullish and calling for more upside. The 0.786 Fibonacci level is the next short term target (TP = 43,000).
See how our prior idea has worked out:
## If you like our free content follow our profile to get more daily ideas. ##
## Comments and likes are greatly appreciated. ##

DOW JONES Quick sell signal before the elections result.Dow Jones is trading inside a Channel Down since October 21st.
Following the rejection on the MA200 (1h), it started the new bearish wave.
Trading Plan:
1. Sell on the current market price.
Targets:
1. 41400 (-2.70% decline like the first bearish wave of the Channel).
Tips:
1. The RSI (1h) is also printing a Rising Support pattern like the one during the previous bearish wave.
Please like, follow and comment!!
Notes:
Past trading plan:

Market Leading Indicators - suggests DOWNThis is my most summarized panel of leading indicators which I use to assist in the determination of market projections, over and above technical indicators.
The SG10Y is about to break out
The JNK bonds are breaking down
Both TIPS and TLT have already broken down the uptrend support (bearish trend now)
The SOXL (semicon ETF) and the combined US Equities are just about to keel over.
Leads have turned down or are at the turning point.
Heads up!

Stock Market CrashGann 144 Bars from 2019 low to 2020 top before crash.
Gann 576 Bars from 2020 low to 2024 top before crash.

DOW JONES: Bottom of the Channel Up.Dow Jones turned bearish on its 1D technical outlook (RSI = 42.00, MACD = 51.000, ADX = 21.000) as it almost hit the bottom of the Channel Up pattern. It is about to form a Death Cross on the 4H timeframe, which will be the first since August 8th that was technically the bottom of July's correction and start of the current Channel Up. We expect the bottom to be priced either today or tomorrow and the RR is good enough to buy. We aim for the 1.5 Fibonacci level (TP = 44,000), which priced the previous two HH.
## If you like our free content follow our profile to get more daily ideas. ##
## Comments and likes are greatly appreciated. ##

DOW JONES Channel Up near its bottom. Solid buy.Dow Jones / US30 is trading inside a Channel Up since late August.
The price is about to enter the buy zone of the pattern.
The previous bearish leg made a -3.81% correction before it bottomed and initiated the bullish leg to the 1.618 Fibonacci extension.
We expect a strong rebound from the current prices, so buy and target 44100 (just under the 1.618 Fib).
Follow us, like the idea and leave a comment below!!

DOW JONES Bottom is being formed. Buy for 44000 immediate TargetDow Jones (DJI) eventually made a bullish break-out on our last analysis (October 08, see chart below) and hit our 43200 invalidation Target:
The 3-month Channel Up is still holding and the price is now on the 4H MA200 (orange trend-line) and near the bottom (Higher Lows trend-line) of the pattern. The 4H RSI has completed a bottoming sequence similar to the September 11 Higher Low.
As long as the 1D MA50 (red trend-line) supports (closes 1D candles above), this will be a buy opportunity. Our Target is 44000, which is the 1.236 Fibonacci extension, similar with the previous Higher High.
-------------------------------------------------------------------------------
** Please LIKE 👍, FOLLOW ✅, SHARE 🙌 and COMMENT ✍ if you enjoy this idea! Also share your ideas and charts in the comments section below! This is best way to keep it relevant, support us, keep the content here free and allow the idea to reach as many people as possible. **
-------------------------------------------------------------------------------
💸💸💸💸💸💸
👇 👇 👇 👇 👇 👇

Combined US Equities Lousy Breakout means BreakdownThe combined US equities chart failed to push significantly and is consolidating. when it does this, it looks like it is rolling over to fall off a cliff.
IF we look carefully, besides the weakening technical indicators, there is also weakening price action, with the second or third lower high in the hourly time frame.
That said, the decision box needs to be broken out of, and then the critical support (red line).
Once these give way, it would be too obvious and there should be a sizeable retracement to the previous support, now being the downside target.

Weekly Forex Forecast Oct 28th: S&P500, NASDAQ, & DOW This is the Weekly Forex Forecast for Oct 28 - Nov 1st.
The S&P500 and NASDAQ are neutral at the moment, but the trend is bullish. Patience will pay off if we wait for confirmations to bullish orderflow.
The DOW is looking weaker than the other two. It is clear the short term profit targets are to the sell side liquidity.
Check the comments section below for updates regarding this analysis throughout the week.
Enjoy!
May profits be upon you.
Leave any questions or comments in the comment section.
I appreciate any feedback from my viewers!
Like and/or subscribe if you want more accurate analysis.
Thank you so much!
Disclaimer:
I do not provide personal investment advice and I am not a qualified licensed investment advisor.
All information found here, including any ideas, opinions, views, predictions, forecasts, commentaries, suggestions, expressed or implied herein, are for informational, entertainment or educational purposes only and should not be construed as personal investment advice. While the information provided is believed to be accurate, it may include errors or inaccuracies.
I will not and cannot be held liable for any actions you take as a result of anything you read here.
Conduct your own due diligence, or consult a licensed financial advisor or broker before making any and all investment decisions. Any investments, trades, speculations, or decisions made on the basis of any information found on this channel, expressed or implied herein, are committed at your own risk, financial or otherwise.

Dow Jones (DJI) Primed for a Bullish Move – Fresh Long Entry!DOW JONES INDUSTRIAL (DJI) Technical Analysis:
In the 15-minute timeframe, Dow Jones Industrial (DJI) has signaled a fresh long trade entry at 42,406.00 with potential upside movement, supported by the break above the Risological dotted trendline.
Key Levels:
Entry: 42,406.00
Stop Loss (SL): 42,294.50
Target 1 (TP1): 42,543.81
Target 2 (TP2): 42,766.81
Target 3 (TP3): 42,989.81
Target 4 (TP4): 43,127.63
Observations:
The price has gained bullish momentum, with a clean break above the Risological trendline.
If momentum sustains, this trade could see all targets successfully hit.
A solid long trade entry is in play for DJI, with upside potential. The Risological dotted trendline serves as strong support, and if buyers maintain control, higher targets are likely to be reached.

DOW JONES (DJI) Slides Through TP1 & TP2! Eyes Set on TP3 & TP4!Technical Analysis:
On the 15-minute timeframe, the Dow Jones (DJI) short trade has already successfully hit TP1 and TP2, confirming strong downward momentum. Price continues to trade below the Risological dotted trendline, suggesting that the bearish trend is likely to continue.
Key Levels:
Entry: 42,997.92
Stop Loss (SL): 43,161.50
Target 1 (TP1): 42,795.74 (Done)
Target 2 (TP2): 42,468.58 (Done)
Target 3 (TP3): 42,141.42 (Pending)
Target 4 (TP4): 41,939.24 (Pending)
Observations:
After breaking below the Risological dotted trendline, the Dow Jones showed significant selling pressure.
Price continues to respect the downward trendline, supporting the case for further declines toward the remaining targets.
With TP1 and TP2 already hit, the Dow Jones looks primed to move towards TP3 and TP4. Traders should continue to monitor the bearish momentum as the setup points toward more downside potential.

Dow Jones - There Is A Lot More Upside!Dow Jones ( TVC:DJI ) is just starting the next bullish impulse:
Click chart above to see the detailed analysis👆🏻
The Dow Jones is anything but bearish and over the past couple of months, value stocks in general have actually been outperforming growth stocks significantly. I do expect all time highs on basically all major indices and the Dow Jones might even head for the $50.000 mark next.
Levels to watch: $50.000, $35.000
Keep your long term vision,
Philip (BasicTrading)

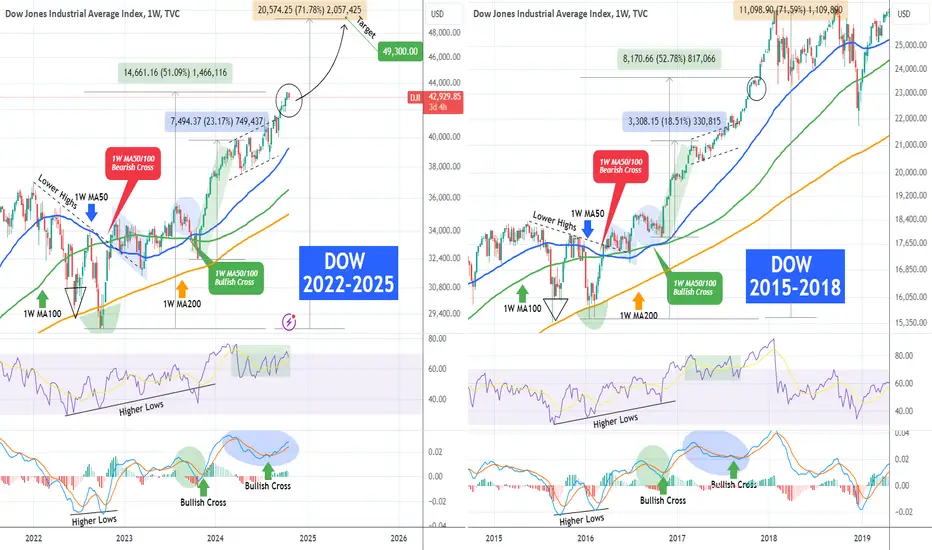
DOW JONES ahead of an huge rally based on the 2017 fractal.More than a year ago (September 13 2023, see chart below), we posted a long-term fractal comparison for Dow Jones (DJI) between the 2022 - 2025 and 2015 - 2018 periods:
As you can see the 1W MA50/100 Bullish Cross eventually placed the index on a huge rally (even though it had to go lower for a month) that hit Target 1 at 42000. The 1W RSI and MACD sequences in 2024 however evolved in such a how that we have to re-adjust the patterns in order to fit the 2017 price action.
The charts now display very symmetric fractals and it appears that we are now on a short-term consolidation (circle) after a +50% rise from the September 2022 bottom. In November 2017, that was the final consolidation before the most aggressive rally of the Bull Cycle that made Dow top and then pull back to test its 1W MA50 (blue trend-line).
As a result, we move our final target even higher at 49300, which represents a +71% rise from the 2022 bottom, similar to the rise that priced the January 2018 High.
-------------------------------------------------------------------------------
** Please LIKE 👍, FOLLOW ✅, SHARE 🙌 and COMMENT ✍ if you enjoy this idea! Also share your ideas and charts in the comments section below! This is best way to keep it relevant, support us, keep the content here free and allow the idea to reach as many people as possible. **
-------------------------------------------------------------------------------
💸💸💸💸💸💸
👇 👇 👇 👇 👇 👇
DJI- Correction to 40k zone?Since mid-September, the Dow Jones Industrial Average ( TVC:DJI ) has resumed its upward trend, reaching new all-time highs.
This recent rally reflects investor optimism and strong market momentum.
However, despite this bullish movement, the rise appears to be contained within a rising wedge pattern, which can often indicate a potential reversal or the weakening of an uptrend.
For traders and investors, a key confirmation of this potential correction would be a decisive drop below the 42,500-42,700 support zone. If the Dow30 breaks below this critical level, it could trigger a larger sell-off, possibly pushing the index down toward the 40,000 level—a significant psychological and technical support zone.
While it’s still too early to confirm whether this correction will take place, it’s important to keep an eye on the price action around the 42,500-42,700 range.
If the index fails to hold this zone, it could mark the end of the recent uptrend and the start of a broader market pullback.
In summary, while the Dow30 has been reaching new heights, caution is warranted due to the rising wedge pattern and key support levels.
If these signals confirm a correction, we may see the index retracing toward 40,000 in the near future.

DOW JONES 1hour Channel Up on its bottom. Buy.Dow Jones / US30 is trading inside a Channel Up and the price hit its bottom today.
By doing so it almost tested the 1hour MA200, which is holding since October 9th.
Also it completed a decline identical in % terms with the first one of the pattern.
This is a strong buy opportunity. Buy and target 43,450 (top of the Channel Up).
Follow us, like the idea and leave a comment below!!

DOW JONES: Turned the previous Resistance into Support.Dow Jones is bullish on its 1D technical outlook (RSI = 63.922, MACD = 449.140, ADX = 44.993) as it recovered yesterday's losses but more importantly it is rebounding at the top of the former Channel up. Having broken over it 3 sessions ago, two short term patterns emerged a Rising Wedge (HH, HL) and a Channel Up. If the HH trendline is crossed, it will be the perfect buy signal to target the top of the short term Channel Up (TP = 44,000). The 1D RSI shows that a rally similar to July 10th is possible.
See how our prior idea has worked out:
## If you like our free content follow our profile to get more daily ideas. ##
## Comments and likes are greatly appreciated. ##

BTC DAILY BREAKING OUT??After 7.5 months of what what amounts to a HTF bullflag pattern, seemingly endless chop, bitcoin looks like it's finally breaking out above and continuing the Bullrun.
This post doesn't need to be overly complicated, there are a few key factors on what is happening:
- Bullish continuation, a bull flag pattern is just that, after a strong rally the corrective structure looks exactly like how the chart looks before continuing the next stage of the rally. Bitcoin has hit the red zone 9 times before the current breakout move, now that the daily structure has shown repetitive higher highs and higher lows for the first time it's signalled that Bitcoin is ready to continue the move higher.
- US elections, every election year since 1928 traditional markets experience a rally, this year is no exception with the $S&P500, SKILLING:US100 & TVC:DJI all at ALL TIME HIGHS. As much as we crypto traders want crypto to be separate from Tradfi, reality is these markets matter and effect Bitcoin directly.
'21 ATH has been major resistance all year for bitcoin, I could see that being the target for this breakout (should it be a successful breakout) before a retest of trend channel at $66,500 on the daily.
All in all this is an exciting time in crypto, lots of volatility ahead come US election and beyond.
Good luck everyone!

20% Interest Rates Could Crash The Market 98%It’s been a while since I last posted, but I’ve got a good reason to start again.
If you take a close look at the charts in this video, you'll notice the potential for a significant market decline across the board.
By analyzing the Dow Jones and interest rates together, it becomes evident that we are nearing this point.
I'm not influenced by news or personal biases—I just prefer not to invest when the market is in this state.
Whether it’s stocks, precious metals, or crypto, I believe it’s wise to be cautious when these signals appear.
The long-term interest rate chart gives me strong reasons to believe we could see a historic drop in asset prices.
Basic concepts like mean reversion and resistance turning into support are some of the key factors that back my AriasWave analysis.
Stay tuned for more updates now that I’m back to sharing new ideas.

DOW JONES Channel Up is turning bearish gradually.Dow Jones is trading inside a Channel Up and is currently very close to its top.
So far the bullish wave is a +8.03% from the last Low.
The previous bullish wave topped after a +8.33% rise.
Technically the index is very likely to top now or on the next MA50 (4h) rebound.
Trading Plan:
1. Sell on the current market price.
Targets:
1. 42000 (above the 0.5 Fibonacci level, where the last Low was priced).
Tips:
1. The RSI (1d) just crossed below its MA trend line. This was the ultimate sell confirmation (September 3rd) on the previous High.
Please like, follow and comment!!
Notes:
Past trading plan:

Dow Jones Hits All Targets! Bullish Surge CompletesThe Dow Jones has demonstrated a strong bullish trend, with the long trade reaching and completing all profit targets.
Key Levels
Entry: 42078.17 – The long position was entered as the price broke above this level, confirming bullish sentiment.
Stop-Loss (SL): 41954.95 – Positioned below recent support to manage risk in case of a pullback.
Take Profit 1 (TP1): 42230.47 – The first target was achieved, confirming the continuation of the upward trend.
Take Profit 2 (TP2): 42476.91 – The second target was hit as the bullish momentum continued.
Take Profit 3 (TP3): 42723.35 – Momentum carried the price to the third target.
Take Profit 4 (TP4): 42875.65 – The final profit target was reached, signaling a strong rally.
Trend Analysis
The price is comfortably trading above the Risological Dotted trendline, confirming the strength of the bullish momentum. With all targets hit, the trend continues to reflect a strong upward movement, supported by positive market sentiment.
The long trade on the Dow Jones successfully hit all profit targets, with the final TP4 at 42875.65 marking the end of a highly profitable trade. Strong support from the Risological Dotted trendline and continuous upward momentum suggest that the market is favoring bulls in this period.

DOW JONES 15 year cheat-sheet that can make you rich!Dow Jones (DJI) is extending what seems a relentless rally since the August 05 Low, which was the most recent short-term correction, but in reality the index has been rallying very aggressively since the October 23 2023 Low.
That was when after a 3-month correction, it found Support above the 1W MA200 (orange trend-line) and 2 weeks later it reclaimed the 1W MA50 (blue trend-line), which has been supporting ever since. So basically the index has been on a 1W MA50 Support for 1 whole year!
What's more striking however and what short-term traders/ investors tend to ignore are the long-term Cycles of a financial asset. And Dow being one, is no exception. As mentioned, the 1W MA200 supported the October 23 2023 Low and in effect has been holding since October 10 2022 (so for 2 full years!), two weeks after the Inflation Crisis bottom. Since then we have been inside a Bull Phase.
This is part of a greater trading Cycle for Dow, one that started 1 year after the March 2009 market bottom of the historic Housing Crisis. As you can see, the pattern is recurring and the phases have a high symmetry and frequency among them.
First and foremost, they tend to do two Lows within a 1 year span, which is essentially the Bear Phase, which finds Support on the 1W MA200 (exception was of course the Black Swan of the COVID flash crash but it is of course a non-technical irregularity event) and then rebounds, effectively starting the Bull Phase.
The first 2 Bull Phases rose by +75.80%, while the most recent by +70.80%, so we are roughly around the same strength levels. Also as far as duration is concerned, the 1st Bull Phase lasted for 1239 days (177 weeks), the 2nd for 1134 days (162 weeks) and the 3rd for 1106 days (158 weeks). Again the time element is quite similar. Notice also the similar pattern that the 1W MACD prints every time Dow enters the final part of the Bull Phase.
As a result, if we apply those dynamic conditions on the current Bull Phase, we can see that a minimum rise of +70.80% from the bottom, should peak a little over 48000, and if it last a minimum of 1106 days (158 weeks) it should come to an end and price the top by October 06 2025.
This indicates that we have at least another full year of bullish trend ahead of us and a fair Target could be 48000.
As you realize, investors who are methodically following this 15 year old cheat-sheet, know where and when to buy/ sell and that achieves investing's two main principles: Profit Maximization and Risk Management. Patience and proper management within such Cycles are what "can make you rich" indeed.
-------------------------------------------------------------------------------
** Please LIKE 👍, FOLLOW ✅, SHARE 🙌 and COMMENT ✍ if you enjoy this idea! Also share your ideas and charts in the comments section below! This is best way to keep it relevant, support us, keep the content here free and allow the idea to reach as many people as possible. **
-------------------------------------------------------------------------------
💸💸💸💸💸💸
👇 👇 👇 👇 👇 👇
