Banish the Bears, 28 Apr 2023🖼 Daily Technical Picture 📈
➤ An aggressive pump higher today in equities, undoing all the Bear's work over the previous days. The Bears are banished...or are they?
➤ It does look like one-way traffic at the moment. The Bulls have control. The only issue I have so far is their inability to close a month beyond the Feb 2023 high. This monthly high close (and there's just one trading day left this month) would in my opinion seal the deal for the long-term Bullish scenario.
➤ If this doesn't happen in April we will have to wait for May...but May is known as the month of "sell and go away". If Bears can hold out for another month, the scales may tip in their favour.
➤ I took profit on my long positions. Unfortunately, my mistake as detailed yesterday diminished what would have been a good pay-day. I hold a small long position.
➤ Conclusion: 🐆 The Hunt was part failure part success. I'm still very hungry. I'm sure my Cubs are too.
EQUITY TREND:
⦿ Short-term (weeks) - UP
⦿ Medium-term (< 6 months) - UP
⦿ Long-term (>6 months) - DOWN
Djia

I Made A Boo Boo, 27 Apr 2023🖼 Daily Technical Picture 📈
➤ At an index level, equities couldn't hang on to early gains and retreated for another day. The price actually closed a minor gap from the previous uptrend as shown by the blue arrows. Note that there is a minor gap higher and a large gap lower from current levels in the SPY. The question is which one will get filled first? Comment below on what you think.
➤ This daily post is generally used to provide observations about the market and price action in pariticular but it also serves as a trading journal for myself. Today marks the first Trading Mistake I've made this year.
➤ I wrongly sized the current trade - double the size it should have been. That is why I cut my positions in half when this was realised. Of course, the Trading Gods have a habit of punishing mistakes to its maximum effect by taking that partial loss at the lows of the day! Unfortunately, I'm not alone with Copiers suffering the same fate. Sorry.
➤ Trading mistakes are part of the game. I accept that. The real issue here is that I didn't recognise the error straight away. I have now put in place a procedure to mitigate this from occurring again.
➤ Conclusion: 🐆 The consolation is that it was a surface scratch and not a deep wound.
EQUITY TREND:
⦿ Short-term (weeks) - UP
⦿ Medium-term (< 6 months) - UP
⦿ Long-term (>6 months) - DOWN

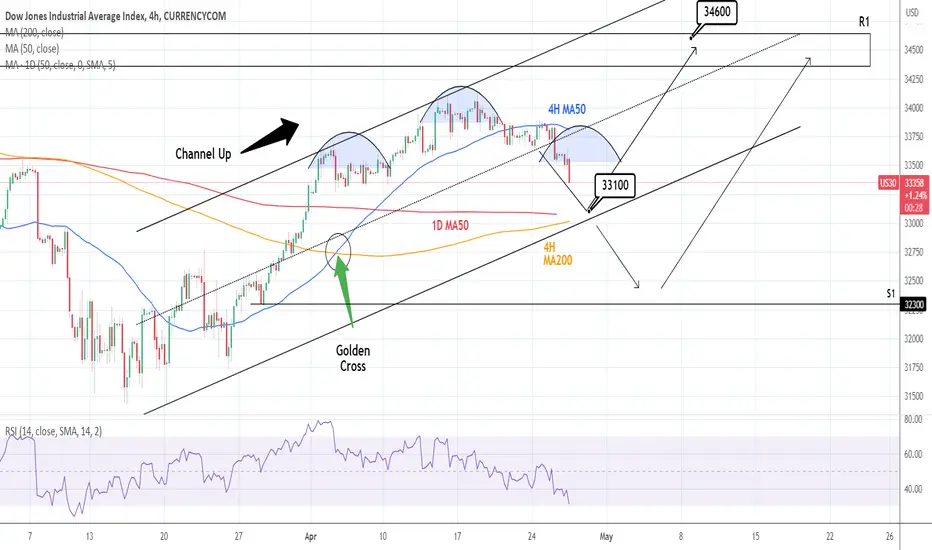
DOW JONES: Channel Up transitioning to a H&S? Dow Jones is still trading inside a Channel Up but the recent pullback has made the 4H technicals almost oversold (RSI = 32.864, MACD = -84.940, ADX = 57.885). The RSI on such levels is a technical buy but the Channel Up has more room to fall before bottoming around the 1D MA50 and 4H MA200. We are looking for a buy at 33,100 but if 4H closes under the 4H MA200 we will short to S1 and then buy. In either case the target will be the top of the R1 Zone (TP = 34,600).
## If you like our free content follow our profile to get more daily ideas. ##
## Comments and likes are greatly appreciated. ##
Pretty Ugly, 26 Apr 2023🖼 Daily Technical Picture 📈
➤ From sitting pretty to pretty ugly. Today's price action has upended the bullish thesis that I was building. However, one ugly day doesn't mean things will now completely reverse. We need two days...OK, I'm just kidding. But on a serious note, the balance of power between the Bulls and Bears have seriously swung towards the Bears.
➤ In after-hours, GOOGL and MSFT stock are being heavily supported post earnings release. Let's see if this can hold up on Wednesday in particular at a broader market/index level. Note that AMZN and META also release earnings this week Wed/Thu (but after market close).
➤ Clearly, the Regional Bank crisis is on-going with FRC in the spotlight. This may re-spark conditions that was experienced during the SVB phase of the crisis.
➤ I got a very short-term buy signal and that was executed dutifully. I am now moderately long and looking for a quick bounce.
➤ Conclusion: 🐆 Pounced. A successful or failed hunt? We will know soon.
EQUITY TREND:
⦿ Short-term (weeks) - UP
⦿ Medium-term (< 6 months) - UP
⦿ Long-term (>6 months) - DOWN

Sitting Pretty, 25 Apr 2023🖼 Daily Technical Picture 📈
➤ Equities is proof that the world is flat. Flat and dull. I'm kidding, that's just Singapore. Although just after US market close I felt a light shake of the building evidenced by the swaying window blinds. I believe that was the tremor caused by a large earthquake off Indonesia. That was pretty much all the "excitement" for the day.
➤ I'm of the strong opinion that this flat and dull inactivity is a show that the Bulls are sitting pretty awaitng the next leg higher. Why are they taking a time-out? Probably to suck in as many shorts as possible to load up on their positions.
➤ I currently hold a small long position.
➤ Conclusion: 🐆 Ready to pounce.
EQUITY TREND:
⦿ Short-term (weeks) - UP
⦿ Medium-term (< 6 months) - UP
⦿ Long-term (>6 months) - DOWN

The Chop, 24 Apr 2023🖼 Daily Technical Picture 📈
➤ Equities finished flat to down once more. Recent movement has been very low volatility as reflected by the VIX. I still favour further upside as price is well supported at these levels.
➤ That being said, my primary trading strategy did signal an exit and that was executed at end of Friday trade. An exit doesn't mean I am expecting to reverse and go Short. It just means the current trade has run its course. I still hold a long position with 20% of capital due to my secondary trading strategy.
➤ Let's have a quick overview of other assets:
⦿ USD (daily): Similar to the equity market, experiencing a small retracement. I expect further weakening, 1.13 being the target (EURUSD).
⦿ TLT (weekly): Still range bound. I favour the long-term downtrend meaning higher interest rates.
⦿ GOLD (daily): Also retracing but I expect all time highs.
⦿ NATGAS (weekly): Bounced higher to the 2.30 long term resistance zone. It doesn't look strong enough to breach the resistance. Further downside expected.
⦿ OIL (3-day): Bullish move may have peaked. If true, I expect a re-test of the low at a minimum at HKEX:64 (WTI)
⦿ BTC (weekly): As expected, we saw some profit taking. Price can drop further (pick your level) but the new bull trend is firmly in place.
➤ Conclusion: 🐆 Awaiting the next Primary trade signal...
EQUITY TREND:
⦿ Short-term (weeks) - UP
⦿ Medium-term (< 6 months) - UP
⦿ Long-term (>6 months) - DOWN

Just Another, 21 Apr 2023🖼 Daily Technical Picture 📈
➤ Equities lost ground after a weak open followed by an attempt to make up ground only to lose it all and more prior to a small bounce off the low at close. Overall, it was just another meaningless day.
➤ Meaningless in the context that the price action has not broken any structures that warrants attention e.g a breakout out of a range. Right now, this small drop from the 18th April high is just another retracement in the uptrend and does not look to have any sinister intent. The favoured conclusion is for price to rise further.
➤ My Secondary Trading Strategy gave another buy signal to build on that conclusion. We are now at maximum position sizing (20% of capital). It is a small allocation in the overall scheme of things but it is only intended to add a marginal return to compliment my Primary Strategy.
➤ My overall long exposure is now moderate.
➤ Conclusion: 🐆 As yet there's no evidence that the Bulls are done.
EQUITY TREND:
⦿ Short-term (weeks) - UP
⦿ Medium-term (< 6 months) - UP
⦿ Long-term (>6 months) - DOWN

Dow Activity Decelerating...For How LongI don't think it escapes anyone's attention that market activity levels (volatility) are exceptionally low compared to recent history.
The VIX dropped below 17 and the innate activity levels on the major indices (like the ATRs) have followed the same course. The medium-term activity reading on the Dow (20-day) has dropped to the lowest levels since before the market topped and reversed at the beginning of 2022.
That marries nicely to the very narrow range that the blue chip index has made recently. The AMEX:DJIA cleared the smallest three-day range in a long time this morning with the gap down, but it probably isn't signaling 'breakout' follow through expectations for many outside of those with 5 minute time frame charts.
What is remarkable to me is that the activity levels are still decelerating - meaning short-term volatility is still dropping faster than medium-term. Here is the ratio of the 5-day (1 week) to 20-day (1 month) ATR ratio. There is natural 'mean' to this acceleration/deceleration.

I Blinked First, 20 Apr 2023🖼 Daily Technical Picture 📈
➤ Kind of like opposite day with today's price action acting in reverse of Tuesday. Again, tight ranging and finishing flat. Yesterday I posed the question: Who Blinks First? Alluding to the idea that there is a regime shift incoming that will determine a period of Bullish prosperity or a brutal Bearish collapse.
➤ Whilst it is way too early to come to a conclusion, I must admit I have blinked first in the favour of the Bulls by adding a small long position using the $SPY. Let me explain why...
➤ Recall that I posted a recent note introducing a secondary Trading strategy to compliment my primary source of return. The long SPY position is its debut. One of the key reasons for implementing the secondary strategy is that on average it has a much longer holding period. This is especially true in the case of a long/buy position.
➤ An achilles heal of my primary strategy is that it is very sensitive to price movement. Trends can be bumpy along the way meaning that it sometimes does not allow me to ride the full extent of a huge trend (up or down). My secondary strategy does a better job at that.
➤ With that in mind, today's buy reflects a potential extension of the current up trend for a while longer. If true, that would give the Bulls the opportunity to close April beyond the Feb 2023 high. In my past notes, I have discussed the importance of such a monthly close and how that favours a return of a long-term Bullish market environment.
➤ Clearly, my buy signal could be wrong and exited soon. However, that is the state of play as I see it and the month is nearing drawing to a rapid close.
➤ Despite the new buy, my overall long exposure is still small.
➤ Conclusion: 🐆 Trust your signals, don't second guess.
EQUITY TREND:
⦿ Short-term (weeks) - UP
⦿ Medium-term (< 6 months) - UP
⦿ Long-term (>6 months) - DOWN

4-19-23 [dji]good afternoon,
there's a very wise man in this market named C who once asked me a question,
C asked:
"you know who loses the most amount of money in a bear market?"
i was like nah who,
C said:
"bears".
---
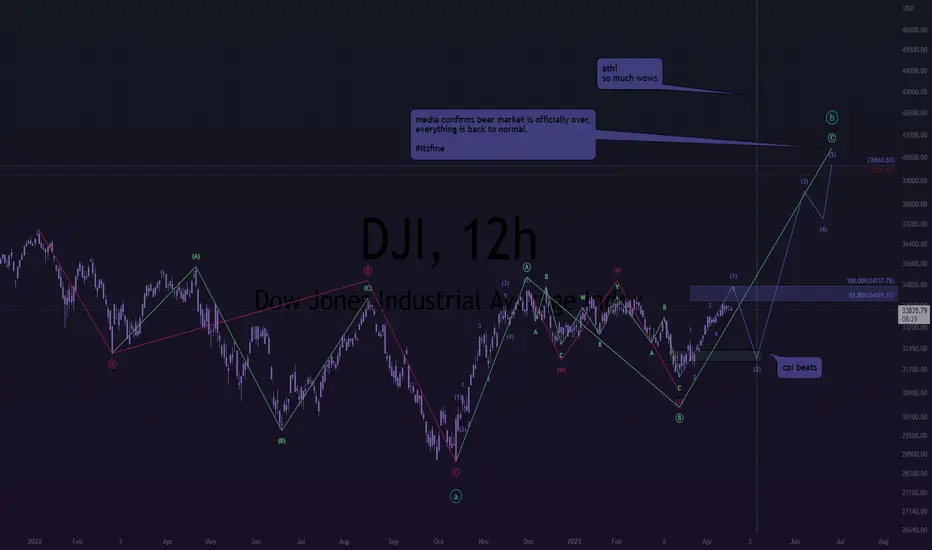
the dow bones came down from ath in a simple zig-zag (3 wave move)
i am theorizing that it's creating an equal sized move to the upside, but in 3 waves.
3-3-5 is all i'm going to say for now - this will either make sense to you, or it won't -
though, i promise not to leave you hanging when the time comes anon.
---
when the dow bones take out ath, euphoria will peak out in the entire world -
it won't make sense to 90% of the market, as they'll spend most of their time adding to their shorts,
wondering "how can this possibly be?".
---
here's how,
bears keep shorting,
market maker keeps squeezing,
and they keep squeezing until every last bear goes poof.
✌
Who Blinks First? 19 Apr 2023🖼 Daily Technical Picture 📈
➤ Equities ended slightly higher at the lower end of today's trading range. It was another one of those days that meant little by itself yet a story is unfolding within the context of a string of these days.
➤ When prices leapt higher from the March low, we saw the aggressive acceleration with large-sized daily moves and price gaps from day to day. A sign of excitement and enthusiasm. In recent days, we see the complete contrast with hesitative small daily moves creeping higher each day.
➤ With my best "tape" reading glasses on, I still cannot decipher which binary outcome it will be: Re-acceleration upwards explained by an upward accumulation phase or a Bearish trend reversal explained by the tiring progress into key resistance levels. Only one outcome can be true.
➤ I remain long with a small position.
➤ Conclusion: 🐆 Who will blink first?
EQUITY TREND:
⦿ Short-term (weeks) - UP
⦿ Medium-term (< 6 months) - UP
⦿ Long-term (>6 months) - DOWN

Price Projections, 18 Apr 2023🖼 Daily Technical Picture 📈
➤ Equities finished in a robust manner at the highs although it was a low volatility day. It looks like the price is digesting the break out of the short-term consolidation prior to jumping higher. The question is how much higher?
➤ I studied the Wyckoff Method some years ago under the teachings of well-known proponents Roman Bogomazov and Bruce Fraser at Wyckoff Analytics. Although I only apply some minor elements of Wyckoff philosophy in my trading strategy, it was a transformative educational experience that opened my mind to the inner workings of the market.
➤ The reason why I bring up Wyckoff is that the methodology does incorporate a price projection element using the "point & figure" chart. This chart is "old school" in that is was predominantly used by Traders in the physical trading pits at exchanges. It simplifies a messy chart by displaying price action in terms of movement rather by chronological time.
➤ So let's play around with the price projection. I used the Dec 2022 consolidation to calibrate the inputs and it gave me a price of 411.5 for the SPY. This is the projection from the Mar 2023 low. Obviously we have already met that target. In the Dec example, the price did spike a few points higher than the projection prior to actual price reversal in Feb 2023. We should apply the same leeway. Coincidentally that would allow the price to peak around 415-418 near the Feb 2023 high - an obvious point for a reversal.
➤ I remain long with a small position.
➤ Conclusion: 🐆 Let's see if the price is about to peak as suggested.
EQUITY TREND:
⦿ Short-term (weeks) - UP
⦿ Medium-term (< 6 months) - UP
⦿ Long-term (>6 months) - DOWN

The VIX Collapse, 17 Apr 2023🖼 Daily Technical Picture 📈
➤ On Friday the S&P500 held above short-term support on top of the trading range although it did give up earlier gains. That is not unsurprising as I did expect the support to be tested. The major feature was the collapse of the VIX to relatively low levels. My "A Regime Shift" post (linked) delves into what this may mean.
➤ A quick round up of other markets is warranted as we are sitting at interesting levels in many instances in their respective timeframes:
⦿ USD (daily): New low set, testing the breakdown. A successful test should see further weakening
⦿ TLT (weekly): Range bound. The bounce off the low looks corrective, the long-term downtrend is favoured
⦿ GOLD (daily): Choppy 2 steps up 1 step down but the uptrend is firmly entranched. I expect all time highs.
⦿ NATGAS (weekly): Testing resistance level. Unsuccessful so far. I expect further weakness if the test fails
⦿ OIL (3-day): Another week of gains would strengthen the bullish case with a Change of Behaviour, the first step for a true trend change
⦿ BTC (weekly): Testing long-term resistance. We may see some profit taking but the new bull trend is firmly in place.
➤ I have reduced my long equity positioning to minimum sizing to reflect a lower conviction on the short-term price movement.
➤ Conclusion: 🐆 Big flood of earnings should provide insight into further market direction.
EQUITY TREND:
⦿ Short-term (weeks) - UP
⦿ Medium-term (< 6 months) - UP
⦿ Long-term (>6 months) - DOWN

The Break Through, 14 Apr 2023🖼 Daily Technical Picture 📈
➤ Yesterday I said narrow price ranges don't last long. It lasted a day more than I had hoped for but today we saw the break through. S&P500 broke above the short-term trading range. Not only that, it also broke an assortment of resistance levels.
➤ Before we get carried away, we should note that there is usually a test of the support level (previously resistance levels). The test may fail and price reverses back into the range. When that happens, it is likely the price will keep moving down to at least the bottom of that range.
➤ 418.31 on the SPY is the upside level that I am looking at. A break through that level would be very meaningful indeed. Especially if price can hold above it at month end. Why at month end? In my view, a monthly close above that high will change my overall long-term Bearish stance to Bullish.
➤ I hold a moderate long position.
➤ Conclusion: 🐆 Look up. Short-term equity trend has been upgraded.
EQUITY TREND:
⦿ Short-term (weeks) - UP
⦿ Medium-term (< 6 months) - UP
⦿ Long-term (>6 months) - DOWN

USA stock markets secondary as Germany outperformAlthough the US stock markets are doing OK, including SPY and S&P 500, the DAX seems to be outperformed by a long shot. I just noticed this today out of curiosity since the euro is starting to exceed the British pound. This might be due to the more substantial German market overall.

Treading Water, 13 Apr 2023🖼 Daily Technical Picture 📈
➤ Equities failed to take advantage of the early bullish mood. Prices ended weakly for a solid down day.
➤ Yesterday I talked about the current state of the market and it being in a short-term consolidation phase. This is a situation where prices move up and down within a range treading water prior to breaking out higher or lower. Allowing for a new trend to emerge. Typically, the longer the consolidation phase the longer the subsequent trending phase. It's like a coiled spring releasing all its pent up energy.
➤ Today we saw the price fail to break above and continue to tread water. It is a delicate balance because the consolidation has a narrow range (high to low). Narrow ranges don't usually last very long.
➤ I've cut half of my long position in response to the further coiling of price. Short-term direction bias gets more cloudy the longer this goes on.
➤ Conclusion: 🐆 Tread lightly.
EQUITY TREND:
⦿ Short-term (weeks) - NEUTRAL
⦿ Medium-term (< 6 months) - UP
⦿ Long-term (>6 months) - DOWN

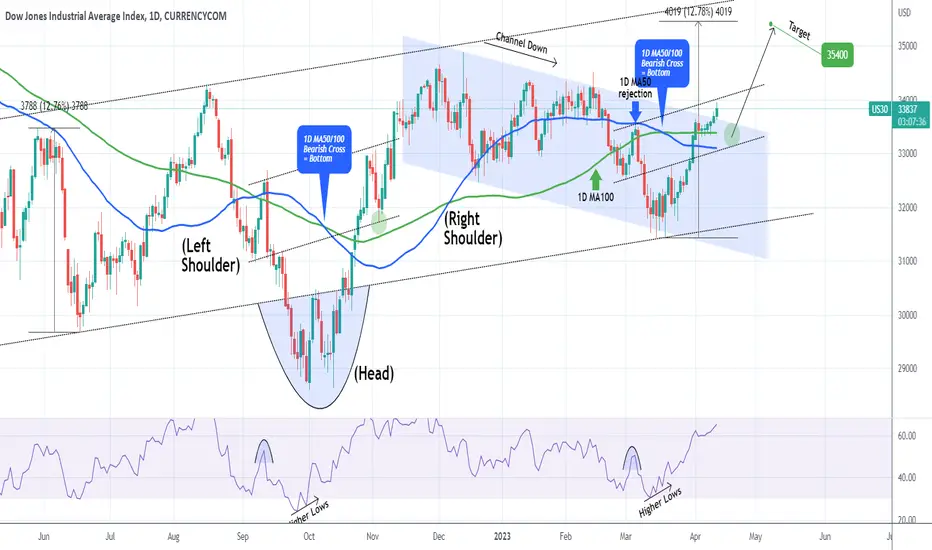
DOW JONES Broke above the Channel Down. Nothing can stop it.Almost a month ago we gave the most optimal buy entry for Dow Jones (DJI) exactly at the bottom of its 4-month Channel Down:
The price has hit our medium-term target and zooming out into the longer term horizon we can see the grand pattern being an Inverse Head and Shoulders (IH&S). This is a bullish reversal formation, in fact it may be characterized as the bottom formation of the 2022 Bear Phase.
The long-term target can be as high as the Shoulders Resistance, the Higher Highs trend-line. If it is inversely symmetrical to June, we can expect a +12.78% rise. This gives us a target for the next 4 weeks at 35400.
Note that if it follows the late October 2022 rally, then it is possible to give one last pull-back within the 1D MA50 (blue trend-line) and 1D MA100 (green trend-line) before our target is materialized.
-------------------------------------------------------------------------------
** Please LIKE 👍, FOLLOW ✅, SHARE 🙌 and COMMENT ✍ if you enjoy this idea! Also share your ideas and charts in the comments section below! **
-------------------------------------------------------------------------------
💸💸💸💸💸💸
👇 👇 👇 👇 👇 👇
Nothing Day, 12 Apr 2023🖼 Daily Technical Picture 📈
➤ A dull Tuesday for equities. There was nothing in the price action of importance. All eyes on Wednesday inflation day.
➤ Yesterday, a reader made the same comment about the low volume Easter Monday trade. I pretty much agree with that statement. Individually, each trading day may in itself have no particular bearing but together with other days there can be meaning.
➤ A very simple example: say today was a bullish day. If the next day is also bullish what do we think about the chances of the following day being bullish too? Statistically, it is slightly better than 50%. A string of bullish days builds momentum and it turns into a trend.
➤ Let's look at this in the context of the current market condition. The S&P500 has been trading sideways in a tight range. What does this mean? It is not in a trend, it is in a short-term consolidation. A break up or down out of the consolidation is the beginning of a trend. Which way will it break? I'm favouring the upside as reflected in my buy position. However, it could also keep moving sideways or down. With the latter two scenarios I would most likely fail on my hunt and realise a loss.
➤ Conclusion: 🐆 Nothing will turn into something.
EQUITY TREND:
⦿ Short-term (weeks) - NEUTRAL
⦿ Medium-term (< 6 months) - UP
⦿ Long-term (>6 months) - DOWN

A Round Trip, 11 Apr 2023🖼 Daily Technical Picture 📈
➤ Equities recovered (again) from an ugly start on Easter Monday. While half of the world were still on holidays, equities gradually fell prior to US market open only for the Bulls to come in to support the price at the critical levels. By the end of days' trade, the S&P500 made a round trip back to where it settled prior to the holidays.
➤ So what was all that price action about? Perhaps it is the jittery signs of the earning seasons proper and inflation data on Wednesday. It could be action to shake out the weak hands on the long and short side. Firstly, a drop to weed out the weak Bull and second to sucker in the Bears only to smack them in the face. Overall, the price action wasn't all that meaningful other than to point out that there is strong Bullish support at these levels. We shall see very shortly if this continues to hold true.
➤ I'm currently long with maximum position.
➤ Conclusion: 🐆 I've pounced on my prey. Will I succeed or fail on this hunt?
EQUITY TREND:
⦿ Short-term (weeks) - NEUTRAL
⦿ Medium-term (< 6 months) - UP
⦿ Long-term (>6 months) - DOWN

DOW Jones New Week Possible MovePair : DJI Dow Jones
Description :
Bullish Channel as an Corrective Pattern in Long Time Frame
Divergence
Break of Structure
Exp Fiat in Short Time Frame
Completed " ABC " Corrective Waves

Prey in Sight, 6 Apr 2023🖼 Daily Technical Picture 📈
➤ S&P500 has found it's footing once again at the minor support level at the 6 March high after threatening to fall off the edge. It was a clear case of risk-off mode today with DJIA blue chips supported and NASDAQ, RUSSELL 2000 sold-off. Still, there wasn't really much damage done to the bullish narrative.
➤ A lot is happening in other asset classes. Gold has broken out big time, USD is threatening weaken to new lows, Oil rebounded aggressively and NATGAS continues to fall apart. All this you can see in my previous posts. Oh yes, don't forget about bond prices too. I should take a good look at the charts there too. With all this commotion, equities is relatively calm. It probably won't be that way for long.
➤ With the current price action, I'm getting a clearer picture. I have the prey in my sight. Now I just need to find the right timing to pounce.
➤ Conclusion: Hunt is on.
EQUITY TREND:
⦿ Short-term (weeks) - NEUTRAL
⦿ Medium-term (< 6 months) - UP
⦿ Long-term (>6 months) - DOWN

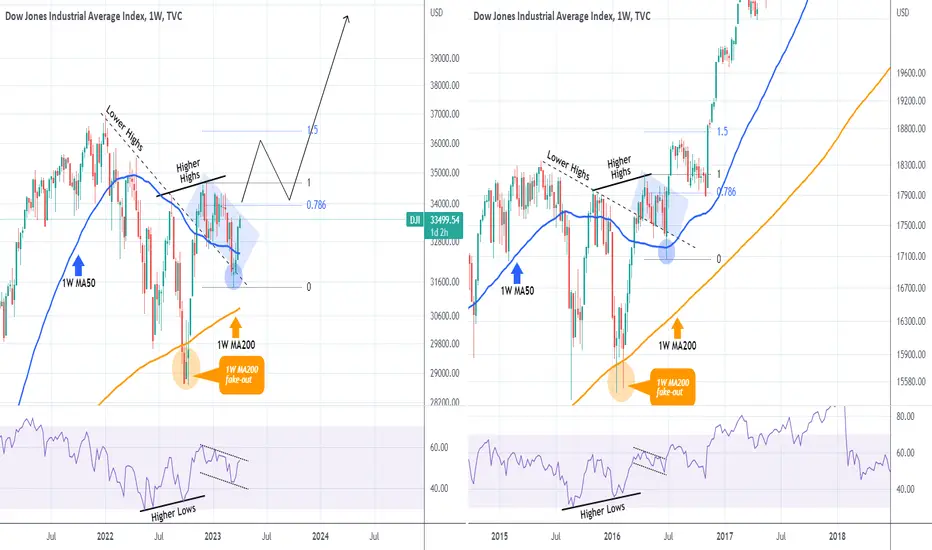
DOW JONES has started a rally that will amaze mostDow Jones is currently on the 3rd straight green 1W (weekly) candle above the 1W MA50 (blue trend-line), testing the top of the 4-month Channel Down. We have previously seen almost the same pattern during the 2015-2016 correction (E.U./ China/ Oil crisis). A fake-out below the 1W MA200 (orange trend-line) initiated a rebound above the correction's Lower Highs trend-line and formed a Channel Down.
This Channel Down in 2016 was nothing but a Bull Flag pattern which after another fake-out, this time below the 1W MA50, it rebounded and almost reached the 1.5 Fibonacci extension with a final pull-back on Fib 0.786 that kick-started a very aggressive rally. Even the 1W RSI patterns match. Do you think that's the blue-print for Dow?
-------------------------------------------------------------------------------
** Please LIKE 👍, FOLLOW ✅, SHARE 🙌 and COMMENT ✍ if you enjoy this idea! Also share your ideas and charts in the comments section below! **
-------------------------------------------------------------------------------
💸💸💸💸💸💸
👇 👇 👇 👇 👇 👇
Close Call, 5 Apr 2023🖼 Daily Technical Picture 📈
➤ Equities reversed course on Tuesday trade, however two aspects remain unchanged: 1) Nasdaq outperformed Russell 2000 2) Late buying into the close.
➤ Without that late buying, I would have taken a small short position to test out the waters, jumping straight back into the action. It was a close call. As it is, I will have wait to see how tomorrow's price action unfolds. The price action will dictate the potential directional trade I will take. Although a short position is favoured, it could also just as easily trigger a buy/long position too! Price could remain ambiguous in which case I take no action.
➤ We should note that the price bounced off the 6th March high that acted as minor support and it is trapped above by the resistance zone as labelled in my chart. Ideally I would like the price to break free from this area. That would remove some if not all of the ambiguity.
➤ Conclusion: Hunt is on.
