Bread & Butter, A+ Long SetupNFP or not, I am taking this setup every single time. This is my bread & butter with a very high hit rate. Aggressive plosions here all day with a respectful SL.
Djia

DJI - The Stock Market Enters Wave 5: Blow-Off Top Then CRASH!Although the sentiment is incredibly bearish and the world expects the stock market to underperform, it has left thin order books, low liquidity and volume, and an overly emotional state of the market. Considering how certain most analysts, traders, and investors are that a recession is already here, most are in cash, short, or sidelined. This state of the market will lead to FOMO and a rapid chase of prices higher in the most emotional and hated rally ever. It happens fast, sucking in people very late into the wave, and ultimately ends faster than they are prepared for. Many people will take on debt to buy more very close to the top. Just as sentiment switches back to ultra bullish, everyone will be blind enough for the real recession and markets will collapse. This is really how Elliott Wave works - it is a socio-economic phenomenon based on investor sentiment and human behavior.
I'm publishing to be able to look back and see if this trajectory was correct at all.

Apple misses earnings...now what?Apple has seen a massive reversal on earnings. A clear rejection off the 50 Weekly Moving Average has been observed.
The sin Curve of the major moving average is starting to slope down with force and looks poised to start the next down leg with this rejection.

Breaking Loose, 3rd Feb 2023🖼 Daily Technical Picture 📈
➤ ...almost but not yet. There are still some short-term resistance levels to surpass. However, the momentum is there. *After-hours sell-off as I write due to earning reports from Apple, Google etc.
➤ The Dow30 Bluechip stocks are really being left behind in this latter part of the rally. Or we could say the NASDAQ is just catching up on lost time. There is some sector rotation here and the rally is not all that uniform despite many commenting on the "strong" breadth i.e. wide participation of stocks in the rally.
➤ I'm expecting at least a pause in proceedings to work off the extreme overbought conditioins. I currently hold no position.
➤ Conclusion: This may be nearing the end of the short squeeze.

The Resistance, 2nd Feb 2023🖼 Daily Technical Picture 📈
➤ February started off with a bang as equity participants responded favourably to the US interest rate decision. Notable was the strong performance of the NASDAQ and the flat performance in the Bluechip Dow 30.
➤ Price in the S&P500 equity index has reached key resistance levels. It will be interesting to see how prices react. So far in after-hours trading prices have kept moving higher but this is generally unreliable.
➤ At these levels, the price is heavily overextended to the upside. Therefore I am not joining in the fun. The price can keep rising and defy gravity but usually this happens after setting all time highs. We are not in that situation. The higher probability is for some sort of retracement or sideways movement to ease out of the overbought zone.
➤ Conclusion: Waiting for better opportunities.

I'm a Skeptic, 1st Feb 2023🖼 Daily Technical Picture 📈
➤ Equities finished strongly to end an outstanding month. The enthusiasm is palpable, however, I'm a skeptic of market conditions for two reasons:
i) Many believe we are back in a bull market. I think this is pre-mature. A monthly close above 411.73 will change my mind. The market did not achieve this just yet. The current level of the S&P500 equity index is where it was in May 2022. The market has moved laterally. Furthermore, the move since the October 2022 low looks very laboured. It's not a fast rise, each step up is very small. It's not displaying the kind of strong buying with confidence.
ii) In the very short-term, I also don't like the way the price finished today. It may be a minor observation but I don't like to see a bullish bar finish below a recent high (27th Jan 2023). Why stop just short of the high and not exceed it?
➤ I closed my small long position to wait for the next opportunity.
➤ Conclusion: Back on the sideline but not for long.

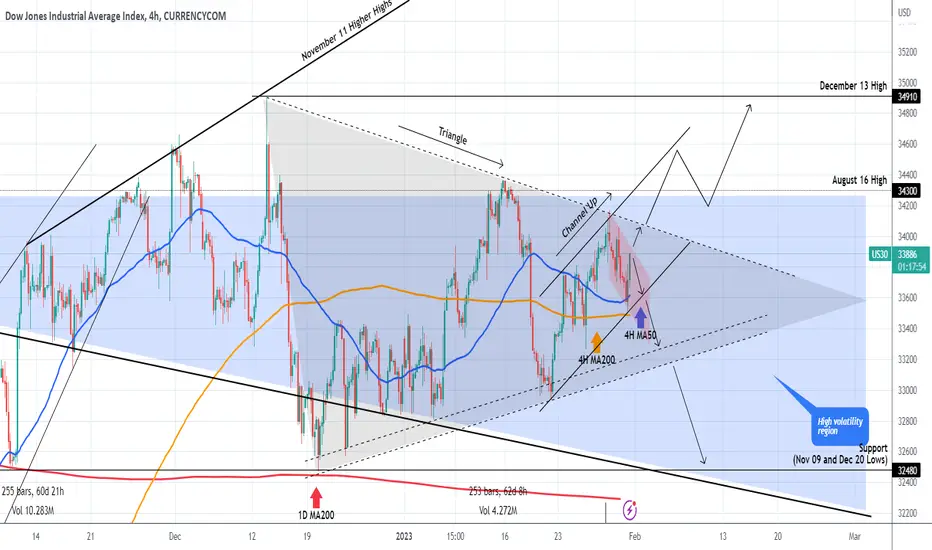
DOW JONES A mix of patterns ahead of the Fed!The Dow Jones Industrial Average (DJI) has made a strong medium-term rise since our buy signal 12 days ago:
Still within the High Volatility region, hence neutral long-term, the price is rising today after finding Support within the 4H MA50 (blue trend-line) and 4H MA200 (orange trend-line). The medium-term pattern is a Triangle, the short-term a Channel Up.
However the price needs to break above the 2 day Channel Down (red) in order to test the top of the Triangle and if broken extend the Channel Up into the medium-term to test the 34910 December High.
A break below the Channel Up, should extend the red Channel Down towards the bottom of the Triangle again.
-------------------------------------------------------------------------------
** Please LIKE 👍, FOLLOW ✅, SHARE 🙌 and COMMENT ✍ if you enjoy this idea! Also share your ideas and charts in the comments section below! **
-------------------------------------------------------------------------------
💸💸💸💸💸💸
👇 👇 👇 👇 👇 👇
Dow Jones needs a breakout before an entry kicks inConfused Triangle has formed on the Daily.
We are in the apex, so awaiting a breakout.
First 7>21>200 - Bullish
RSI >50 coming down (mixed)
Target up 36,288
Target down 31,559
This clearly shows the confusion with the index as well as the fundamentals with the uncertainty with interest and inflation rates.
The Fed is having a meeting tomorrow to discuss the macro aspects, which it looks like investors remain trepidatious.
I will be waiting for the breakout before making any rash decision.

The First Move, 31st January 2023🖼 Daily Technical Picture 📈
➤ After Friday's weak close, prices acted even weaker by a sharp fall on Monday. Well...not really a sharp fall...more of a standard-sized fall given the jump in volatility post 2021. In any case, the Bears have made the first move in this important week of economic announcements. What response will the Bulls have on interest rate decision day Tuesday?
➤ Remember, I would consider the Bear market over with a monthly close above 411.73 on the SPY monthly chart. Will it be achieved on the final day of January?
➤ The VIX has moved higher off the lows. It's not very convincing at the moment. Another heavy down day will change that narrative completely.
➤ I have entered a small LONG position given the technical set-up.
➤ Conclusion: Back in the action.

The Business End, 30th January 2023🖼 Daily Technical Picture 📈
➤ We've come to the end of January and it is going to be one of the busiest of the year. Interest rate decision, major earnings and key economic data combine. Add on to the important technical levels for the S&P500, you can see why we really are at the business end of things.
➤ There is time for the S&P500 to close above the monthly highs of recent months. That should cement the Bullish enthusiasm. If not, we will have to see if the market can do so at the end of February.
➤ Some selling came at the end of the session Friday. This may just be profit-taking but I can sense a certain hesitation since we are at key levels straddling 410 on the SPY.
➤ I currently hold no position.
➤ Conclusion: I'm hoping to get into the action with the expected volatility.

The Last Chance Saloon, 27th January 2023🖼 Daily Technical Picture 📈
➤ It turns the Bulls were not very exhausted after yesterday's recovery. Equities burst higher but not before filling the opening gap. This is a good sign that move higher is supported.
➤ For the Bears out there, it is the last chance to hold out. Price is approaching a very significant technical level. Please refer to my interpretation on the monthly chart (see related Ideas)
➤ The important level is the 410-411 resistance zone. This has been the graveyard for many a Bullish move. The ability to close above it on a monthly basis would be very meaningful. This is also the last chance for the VIX to hold it's key level.
➤ I currently hold no position.
➤ Conclusion: Don't get in the way of a Bull's run until it has run its race.

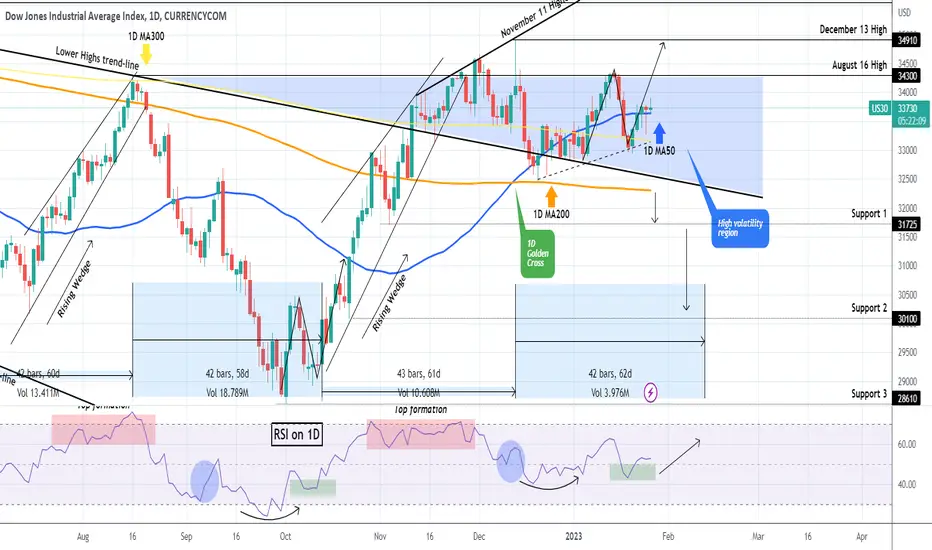
DOW JONES Time to test the December 13 High.Dow Jones (DJI) held the dashed Higher Lows trend-line and rebounded, as we outlined on our last week analysis:
That was on the 4H time-frame, now we zoom out to 1D where the index broke again above the 1D MA50 (blue trend-line) but after last weeks 34,390 rejection, it remains within the High Volatility region.
As long as the 1D candles close above the (dashed) Higher Lows trend-line, we are expecting not just a re-test of the 34300 August 16 High but also a direct hit on the 34910 December 13 High. The reason is that, as we mentioned last week, the current price action based on RSI terms, looks very similar to that of October 03 - 21.
-------------------------------------------------------------------------------
** Please LIKE 👍, FOLLOW ✅, SHARE 🙌 and COMMENT ✍ if you enjoy this idea! Also share your ideas and charts in the comments section below! **
-------------------------------------------------------------------------------
💸💸💸💸💸💸
👇 👇 👇 👇 👇 👇
The Boy Who Cried Wolf, 26th January 2023🖼 Daily Technical Picture 📈
➤ Equities recovered after a very weak start to end the session flat. It was a case of the Boy Who Cried Wolf.
➤ This counts as the second time in recent days that equities has refused to fall when it ought have. The first cry was on 18th January. Despite the fall that day, equities recovered quickly unable to gain downside momentum. Today was the second cry but there was again no wolf.
➤ The price is still playing chicken with the 200-day moving average. Similar to what occurred during Nov/Dec 2022. Today, there was a lot of effort used to support the recovery. That recovery was only sufficient to break-even. Having spent all that energy, how much is there left in the tank?
➤ I currently hold no position.
➤ Conclusion: Fool me once, fool me twice...

A Pause, 25th January 2023🖼 Daily Technical Picture 📈
➤ Equities ended slightly weaker and traded in a narrow range (for once). There are a lot of games being played at the widely watched 200-day moving average that the S&P500 now sits.
➤ There's an overall contraction in the price swings in recent months due to the sideways moving market (since at least November 2022, stretching to May 2022). This flat-lining of movement is a process of building up energy for the next large directional move whatever that may be.
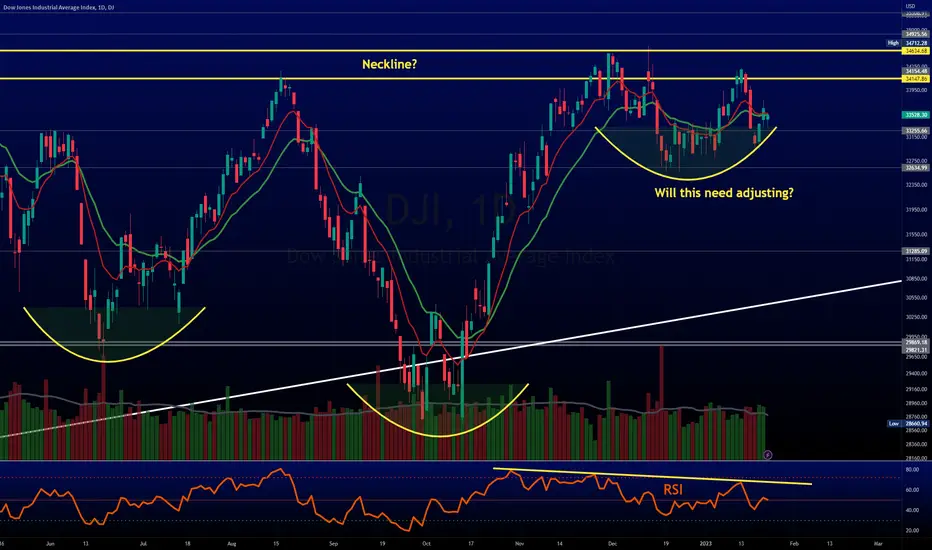
➤ Many people have observed the formation of the inverse head & shoulders chart pattern (a bullish formation). I'm not a big fan of these formations as they are unreliable but more so the construction of the current pattern looks "non-textbook" if I can put it politely.
➤ I currently hold no position.
➤ Conclusion: Pause in the action but not for long.
MrStocky
The Professional Loss Maker

$NDX looks better than $DJI, but it's no slouchPls see profile for more info
We limit data
as it's copy paste
We're cautiously bull $DJI, bit more on $NDX
But there's reasons:
#ECONOMY = TRASH
Tons of good lost jobs
Unemployment low but most BAD jobs & multiple jobs
#DJI RSI negative divergence (slight weakening)
#NDX RSI looks good & many green candles
$DIA $QQQ #QQQ #Stocks
A Trader's Dilemma, 24th January 2023🖼 Daily Technical Picture 📈
➤ Another bullish day. Price has reversed the recent weakness and set a new short-term high. Yet, I'm not buying into it right now. Why? Well it's not because of my fundamentally (misplaced?) bearish view. I don't trade on those views. I trade by reading the short-term technicals. I'm completely agnostic when it comes to being long or short.
➤ Today there is no trade because I am faced with a Trader's Dilemma and it's forcing a strong debate within.
➤ The price setup is NOT something I've seen from years past (at least 13yrs in my data). It looks very much like a bullish continuation in the short-term but with bearish overtones too. If I went bullish, I would be using a max. position size. If bearish, half size. So, what's the optimal decision? If I had to force a trade, I would be a buyer. That means using max. risk on an untested trade set-up. Perhaps reducing the trade size is better? That would mean giving up on large profits knowing I'm more likely to be right than wrong.
➤ I've made my decision and have decided to restrain myself in making the trade because this trade set-up is "novel". In cricketing terms, I'm letting the ball "pass through to the keeper" and ignoring my greed for making money. At the end of the day, I'm not "forced" to make the trade. I can choose to not play. There's always another opportunity with a better set-up.
➤ I currently hold no position.
➤ Conclusion: What would be your decision if faced with this situation?

Indices looking GOOD, pt 2 $NDXGood Morning!
👀 $NDX, made it clear it would not break 1st try
However, this is NOT the 1st!
$DJI maintains its PUMP, need HIGHER HIGH
#stocks are pumping, risk
$VIX stable over last week
$DIA $QQQ #NDX #DJIA

📈 The ONLY Chart That Matters🙅♂️ Forget all the endless talk and debate about recession, interest rates and war. IMO, there is only one thing that equity Investors need to know.
This is the MONTHLY chart of the S&P500 equity index. The chart tells a very clear and simple story.
For the market to re-establish the long-term Bullish narrative all it needs to do is CLOSE ABOVE the HIGH of the lowest bearish (RED) candle on a monthly basis as illustrated. A reversal above this candle will indicate (with a very high probability) that the Bear move is over. The high sits at 411.73 on the SPY (S&P500 equity index ETF).
☝️ Until the price does this, the Bear market will linger on.
❌ This view becomes invalid if we see a bearish (RED) monthly bar CLOSE BELOW the October LOW. If this occurs, Bulls will need to repeat the above process but for the HIGH of the new bearish candle.
Is it that simple? Yes it is.
MrStocky
The Professional Loss Maker

Missed It By That Much! 20th January 2023🖼 Daily Technical Picture 📈
➤ Yes, that's exactly what happened with my long position. A large move higher in equities the day after I got out (for a loss). That basically sums up why Trading can sometimes be so frustrating. These days I just take a deep breath and move on. My younger-self would have tore my hair out!
➤ So what does this bullish move mean? Very little in my opinion. It's just another choppy day. We need to see if the S&P500 can break above 4000 or it goes back below 3900. A move in either direction should determine the primary trend for the next week(s).
➤ I currently hold no position.
➤ Conclusion: Standing by to see which direction the market favours.

Dow Jones 30 found support, potential to go higher from here?Dow Jones 30 Index
The multi-week sideways price action seems to be the consolidation of the October - December advance, bullish conditions appear to remain intact provided the 32,950 support area proves true.
Not investment advice. Past performance is not indicative of future results.

Aspects to Market Making Sentiment IIA period of low spread and low volume can indicate a lack of liquidity in the market. This can be caused by a variety of factors, such as a lack of investor interest in the security or derivative, or a lack of market participants willing to trade at the current bid and ask prices.
In this case, a market maker may choose to adjust its strategy to manage the risk of holding a large position in the security or derivative. One strategy that the market maker may use is hedging, which involves taking offsetting positions in other securities or derivatives to reduce the risk of loss from unexpected market movements.
For example, if the market maker has a large position in a stock and is concerned about a potential price decline, the market maker may use options or short selling to hedge against this risk.
Alternatively, the market maker may choose to hold onto its position and wait for market conditions to improve. This may involve adjusting the bid and ask prices to attract more buyers or sellers, or reducing the size of the position to manage the risk of holding a large position in an illiquid market.
The market maker's decision to hedge or hold the position will depend on the market maker's risk appetite, the specific market conditions, and the market maker's own outlook on the future movements of the security or derivative.
In summary, a period of low spread and low volume can indicate a lack of liquidity in the market, in this case, a market maker may choose to adjust its strategy to manage the risk of holding a large position, one strategy is hedging,
which involves taking offsetting positions in other securities or derivatives to reduce the risk of loss from unexpected market movements. The market maker may also choose to hold onto its position and wait for market conditions to improve,
adjusting the bid and ask prices to attract more buyers or sellers, or reducing the size of the position to manage the risk of holding a large position in an illiquid market. The decision to hedge or hold the position
will depend on the market maker's risk appetite, the specific market conditions, and the market maker's own outlook on the future movements of the security or derivative.

US30 20th JANUARY 2023Dow Jones and S&P 500 fell nearly 2% in Wednesday's overnight market, which was the biggest daily drop for both indices in a month. The decline came after weak economic data was released overnight, reigniting fears of a recession. In addition, hawkish comments from Federal Reserve officials also further worsened the fundamental mood of investors.
Before the wall street stock market opened, US economic data for December showed that retail sales and Producer Price Index (PPI) data fell more than expected, while production at US factories also fell and total output in November was weaker than expected.

Back to Normal, 20th January 2023🖼 Daily Technical Picture 📈
➤ Equities prices continued to fall. Two price gaps were closed. A lower gap that formed on the 10th Jan and the opening gap from Thursday trade. S&P500 has fallen below the support level at 390.
➤ I think it is clear that price has just formed a lower high. I could argue the short-term downtrend from the Dec 2022 high has been established. This counters the uptrend from the Oct 2022 low but re-aligns with the long-term downtrend since Jan 2022. Did you get that?
➤ Another thing that has re-aligned is that the Tech/Growth/Small cap stocks finally underperformed the DJIA and broader S&P500. This is "normal" behaviour under a risk-off period. Does that mean we are back to 2022 mode?
➤ I closed my long position with a loss as price didn't respond like I wanted. What I want and what the market gives are two separate things. Price may still bounce but I'm not going to risk it at this stage.
➤ Conclusion: Next trade is most likely an opportunity to go short. Standing by.
