DJI Dow Jones has 3 days of distributionCopy paste
For some reason I though I posted distribution on $DJI on 12/13 but had done it for $SPX
#DJI also has it & today will make 3 days
A LOT OF DAMAGE done last 2 days
Djia

Back to Square 1, 15th December 2022🖼 Daily Technical Picture 📈
➤ If we took a two day view of events, the S&P500 managed to make little headway up or down. Pre-data release, I eluded to people getting a bit over excited by bidding up the VIX. Of course, there was the excitement of the CPI data intra-day. That has all fizzled out for now.
➤ Now that all the excitement is over for another month, I think there is some positive bias here. I will put a bit of money to work. I'm looking for VIX to continue lower in the very short-term.
➤ That being said, all other indices such as the NASDAQ, RUSSELL, DAX etc all look very "messy" in terms of their price structure. I will leave them alone for now.
➤ I currently hold a +33% long exposure. The maximum portfolio exposure is +/- 200% on capital, the level of highest conviction.
➤ Conclusion: All the excitement is now for the Football World Cup Final!

DOW JONES Has the narrative changed to bullish?The Dow Jones Industrial Average (DJI) has entered into a new short-term pattern on the 4H time-frame, a Bullish Megaphone. The 4H MA100 (green trend-line) is the pivot right in the middle of it and the short-term Support is the 1D MA300 (yellow trend-line), once a long-term Resistance which rejected the previous High on August 16.
Almost two months ago with our October 20 analysis, we argued why the trend has changed to bullish and if Dow broke above the 1D MA300, it would restore it on the long-term as well:
Is that still the case? In our view yes, especially when we see formerly bearish patterns on the 1D RSI and MACD indicators, turned to bullish. As you see we are at a point on the 1D RSI (blue circle) where the price was already below the 1D MA50 (blue trend-line) on April 26 and with the 4H MA100 as the Resistance was trending downwards. Same with the 1D MACD, which is so far ignoring the Bearish Cross. So instead of those indicators turning the price bearish, we are above the 1D MA300 and the 1D MA200 (orange trend-line) within a Bullish Megaphone. The once bearish narrative seems to have changed to bullish.
So what now? The 1D Golden Cross (MA50 crossing above the MA200) is the first such bullish formation since August 05 2020, back in the period when Dow Jones was recovering from the COVID pandemic crash. This means that as long as the 1D MA50/200 Support, we can buy the pull-backs and gradually target new Highs. Our next target is the 35550 (April 21 High) Resistance. Only break below the 1D MA50 and subsequent rejection upon testing it as a Resistance, will be a bearish signal, potentially going all the way back to 29000.
-------------------------------------------------------------------------------
** Please LIKE 👍, SUBSCRIBE ✅, SHARE 🙌 and COMMENT ✍ if you enjoy this idea! Also share your ideas and charts in the comments section below! This is best way to keep it relevant, support me, keep the content here free and allow the idea to reach as many people as possible. **
-------------------------------------------------------------------------------
You may also TELL ME 🙋♀️🙋♂️ in the comments section which symbol you want me to analyze next and on which time-frame. The one with the most posts will be published tomorrow! 👏🎁
-------------------------------------------------------------------------------
💸💸💸💸💸💸
👇 👇 👇 👇 👇 👇

$DOW US30 SPX- Going up? I am long!Fina trade this channel. Respect Risk. Keep it simple. The chop tomorrow is the only thing to be mindful off.

Closing the Gap, 14th December 2022🖼 Daily Technical Picture
➤ Inflation data came in softer than expected and equities prices jumped with enthusiasm. By end of trade, much of the gains were given up.
➤ The result of the inflation data resulted in a huge price gap between the previous day's close and market open. Gaps like these tend to get closed over time or like today...immediately. Note that there is still an lower unclosed gap created on 10th Nov also due to the CPI data.
➤ That being said, S&P500 set a new high since the 13th Oct bottom. I don't yet see any signs that this uptrend is done. The Fed interest rate decision and subsequent price movement could change this. A significant Bearish bar may result in a Change of Character.
➤ I currently hold NO exposure. The maximum portfolio exposure is +/- 200% on capital, the level of highest conviction.
➤ Conclusion: Time to be patient.

DJI Daily Bearish EW TargetsHere we are mapping the next impulse down.
We did some calculations but we will let the chart drawings do the talking.
Thanks for watching.
Namaste.

All About Support, 12th December 2022🖼 Daily Technical Picture 📈
➤ The S&P500 equity index is holding above the key support level at 390/3900. A confident break below will result in a Change of Character (CHoCH) in the uptrend since the Oct low.
➤ A CHoCH results in a significant pause in the uptrend or a reversal of the trend.
➤ By holding above the support level, there would not be a CHoCH. Hence the bias is for continued upside.
➤ Inflation data on 13th and the Fed interest rate decision on 14th Dec are clear catalysts for price movement.
➤ I currently hold a -17% short exposure. The maximum portfolio exposure is +/- 200% on capital, the level of highest conviction.
➤ Conclusion: Price is set-up perfectly for a binary outcome. I don't want to be heavily involved here.

40 Bar Cycle Chart - Dow Jones DIA DJIA - Updated 121022Given that we are headed into the release of the November Consumer Price Index this upcoming (Tuesday, December 13th) and also the December Federal Reserve Interest Rate Decision (Wednesday, December 14th) , are markets set up for another short opportunity into the end of January (Q1)?
DIA DJIA Daily Chart Template
www.tradingview.com
Which camp are you in on the short-term (end of year into Q1/23') direction of markets?
Camp A: We are likely we headed for new lows in Q1/23 (Fluctuating Inflation + Persistent Price/Wage Pressures + Hawkish FED).
Camp B: We are likely to break the downtrend into the start of Q1/23' (Peak Inflation + Deflationary Forces + Dovish FED).
Let me know your prediction in the comments below!

Where to Now? 9th December 2022🖼 Daily Technical Picture 📈
➤ I'm back from my holiday and fully recharged. Since my last technical update, the equity market has made some interesting moves that we need to examine.
➤ Foremost in my mind is of a potential medium term top that has been reached.🔝 I'm using S&P500/SPY as the market proxy. If we look at the market since March 2022, there has been two previous occasions where this scenario has occurred: 29th March and 16th Aug. The VIX fell below 20 and then rebounded higher. S&P500 proceeded to then decline by around -20%. 📉
➤ This scenario has just played out with the peak on 1st Dec. VIX has bounced higher after falling below 20. IF history repeats/rhymes, we are looking for another 20% drop. 🙀 That would take us down to 330/3300 for the SPY/SPX500. Each drop occurred over a two month period. That would mean both an ugly end to this year and start of the next.
➤ For this to occur, the market will have to counter both the Christmas rally and a historically bullish January. Readers would point out Jan this year as the perfect counter example.
➤ I currently hold a -25% short exposure. The maximum portfolio exposure is +/- 200% on capital, the level of highest conviction.
➤ Conclusion: History does rhyme...but is it the Bullish or Bearish rhyme?

DOW JONES ready to rally! Inflation peaked on a 100 year line!The Dow Jones index (DJI) has been on an enormous rise since late September that even made a Higher High above the 2022 descending Resistance. With inflation being the main catalyst of this 2022 correction, it should come as no surprise that when it normalizes, the index can start seeing growth again.
Well on July the Inflation Rate (USIRYY) got rejected on its most important Resistance level, the Lower Highs trend-line that has been in place since May 1920! This 100 year old trend-line has had another 2 rejections on inflationary peaks (February 1947 and March 1980).
As this chart shows, every inflation drop from a Lower Highs peak was followed by a multi-year rally on Dow Jones, essentially a new expansion period. An exception parhaps was May 1920 when DJI continued to fall for another year, despite a massive correction on Inflation.
As a result, if this Inflation rejection is sustainable and is the start of a major correction, it is more likely to see the stock market rally and enter a new period of growth.
What do you think?
-------------------------------------------------------------------------------
** Please LIKE 👍, SUBSCRIBE ✅, SHARE 🙌 and COMMENT ✍ if you enjoy this idea! Also share your ideas and charts in the comments section below! This is best way to keep it relevant, support me, keep the content here free and allow the idea to reach as many people as possible. **
-------------------------------------------------------------------------------
You may also TELL ME 🙋♀️🙋♂️ in the comments section which symbol you want me to analyze next and on which time-frame. The one with the most posts will be published tomorrow! 👏🎁
-------------------------------------------------------------------------------
💸💸💸💸💸💸
👇 👇 👇 👇 👇 👇

S&P 500 Wave AnalysisTh US index has been in Flat correction A-B-C as shwn in the chart and the wave C is moving as impulse pattern right now the wave 4 has been completed and wave 5 target is 4194 .

Hanging man yet to be confirmed.Hanging man yet to be confirmed. Looking for a short-term pullback to 32750-32250.

How is a forecast a forecast, and not a guess?Since the days of town squares, and town markets...there has always been this intellectual battle between the market sellers and the buyers. One party sets up shop with the intent of making a profit through selling something of true or perceived value to another party who may (or may not) have a perceived value or use for the seller's wares.
It is simultaneously the simplest of relationships, and one of the most complex. The attributes that govern such transactions are emotion, education, salesmanship and instinct. The transactional forces itself are so interesting to me...A book could written about it. In fact, an entire industry exists right now on the millions of books, videos and lessons, that have been authored on such an in-depth topic.
However, I'm NOT writing today to inform you how best to sell your wares. Nor I am taking time out of my weekend to educate you on how to "one-up" those wiley sellers... when buying. All of the machinations of this transactional relationship have played out countless times, and so much so , that they're now incredibly predictable. I wonder if anything else can be discovered as it pertains to the choreography of the buyer and seller. But when making a prediction on outcomes, is there a process? Is their a discipline to spot success, and or, failure?
I believe so.
There are many things that happen within our natural world that no one could be criticized for thinking they are random occurrences. The leaf that falls from the tree. Which leaf? Where that leaf falls on the ground. Directly below the tree, or is their a wind that influences it? Is it possible that much of what we observe in the natural world as random, is in fact, predictable?
Forecasting the weather with accuracy has approved greatly in the last 20 years alone. Just talk to a natural gas trader...who in my opinion could fill in as a meteorologist anywhere in a local TV market. Why is that? Because to trade natural gas, one must be a part-time weather man. To trade crude oil, one must become a geopolitical connoisseur. There are all kinds of attributes a specialized trader must acquire given the market of their specialty. However, one art is forgotten. Less appreciated. Because our society is conditioned to be impatient...given no value.
The art of observation... and might I add my own suffix...without action. The art of observation, without action. This practice allows for education, allows for experience, allows for confirmation without consequences.
In and around 1940-1941, RN Elliott stated that the Dow (which just 11 years earlier lost 70% of it's value) was about to embark on a bull market rally that would last 70 years. Having endured the great depression, on the cusp of the USA entering WWII with the attack on Pearl Harbor by the Japanese...can you imagine how that market forecast was received? Below...please find the aftermath of his ridiculous claim.
During the time his proclamations was made, no one had the benefit of hindsight. Suffice to say he was ridiculed. Now in retrospect, he was conservative in his forecast. Because the 2009-2010 area of the SPX would have been where he concluded this rally would end...and the market was higher by almost 800% from 2009-2022.
Therefore, with hindsight, no one would NOW argue his guess was in fact, a forecast. A forecast based on a process, steeped in discipline.
I'll conclude with the main chart above and simply say. I too am making a proclamation. I am now authoring a forecast...I too (Like Elliott then) believe I have a process and a discipline to back my statement...but you have to decide. The above chart represents within the next 3-6 years PLANET EARTH COULD LOSE HALF ITS GLOBAL NET WORTH...OR MORE.
I will concede it's human nature to ridicule what is not understood. As a species we have a long documented history of such behavior. It is also precisely why my success is based on you, the reader, and your predictable failure to not consider the above, a reality. To dismiss this proclamation. Having said all the above, can I request you do one thing that will not require much effort?
Snip this chart and save it.
Best to all,
Chris

$DJI @ Support - Showing RSI weakness - Likely trade sidewaysDaily
Maybe call this the HOVERCRAFT Pattern
$DJI @ Red EMA support, bouncing
4Hr
Bullflag pattern ok, within range
Hr
BEARFLAG trade done
ALERT
RSI beginning showing neg divergence
(Couldn't post the flags as reached limit day before)
#stocks #DJI #DJIA

$DJI longer term view Most of our major calls have been $
$DJI short term uptrend since 10/31
#DJI low gap pretty much filled
RED CIRCLES are important, where from here? Both are dojis
LONG TERM still in up trend
SWINGS are getting bigger!!!
Maybe now sideways till Jan

$DJI Painting the tape?Best if you see it yourself, 1-5 minute data
$DJI giving back most of gains, volume very light
How heavy was yesterdays volume?
Daily looks HUGE but let's dissect
When pump was LIGHT, looked HEAVY
BUT majority came in @ 4PM!
See longer term time frame, next post

DJIA back below Aug highFollowing a weak ISM manufacturing PMI report, recession concerns have seen US stock markets drop after yesterday's Powell-inspired rally.
It is worth keeping an eye on the major indices such as the Dow Jones.
The DJIA has gone back below the August peak at 34288. A close well below this level would be a bearish outcome as it would point to a false breakout.
Interestingly, the S&P 500 has also turned lower from its bearish trend line bearish trend line
But again, it could just be a short-term dip, like we have seen many times over in this recovery.
For the DJIA, there are lots of support levels on the way down that the bears will need to reclaim if they are to exert significant pressure on the markets.
So, take this weakness with a pinch of salt. The bears still need a proper confirmation that that market has peaked. But don't ignore it if you are bullish or long.
By Fawad Razaqzada on behalf of FOREX.com

Dow Jones Industrial Average Index Concern!Today you can review the technical analysis idea on a 1M linear scale chart for the Dow Jones Industrial Average Index (DJI).
In the chart, I added in the RSI as well as review the Great Recession history to get an idea of where the DJI is headed. It seems that the DJI has been moving up an ARC with a possibility to come down and touch it again. It is currently inside a descending channel. If DJI price falls as much as it did during the Great Recession, it could come down to the $18K level where there is strong support. The RSI could support that type of drop as it is no where near the oversold region.
This is presented on the monthly chart so please have patience.
If you enjoy my ideas, feel free to like it and drop in a comment. I love reading your comments below.
Disclosure: This is just my opinion and not any type of financial advice. I enjoy charting and discussing technical analysis . Don't trade based on my advice. Do your own research! #millionaireeconomics

Dow Jones Industrial Average - higher for longerNew analysts claim that the S&P 500 provides a better picture of the markets compared to the Dow. Although the S&P 500 obviously has a larger catalog, the Dow is a direct reflection of international capital flows. Look toward the Dow to see where big money is moving.
The S&P 500 is domestic-oriented, and fund managers and institutions tend to focus on this index. The NASDAQ typically reflects retail, tech-heavy, and usually is the last to the peak. Each index offers a completely different perspective. The Dow Jones Industrials is the big money. You will notice that this index leads the way. It is the first out of a key low because it is typically the foreign capital that comes in based on currency. You will also notice the Dow tends to top out first because the big money tends to pull out first also due to currency.
Capital is flowing like never before, and the smart money is on the move. The USD remains the last safe haven, and money is pouring into the US – for now. Look to the Dow for the best international perspective. ©Martin Armstrong
The trend is higher on the DJIA and stops are being trailed to lock in profits. The PA has taken out the August highs and is now looking for liquidity above the double top around March 2022. The idea is always to look to buy a high and sell higher. I would expect the rest of the major US indices to follow suit.

$DJI expected small selloff - Likely trade sideways till EOYOkie-Dokie
FOR END OF DAY
4HR:
👀on RSI breaking 50
#DJIA trading above or sub GREEN Mov Avg
Daily:
$DJI trading above or sub light blue line
A selloff to GAP will suffice
Setting up for another bump
Likely trade sideways rest of year
#stocks $DIA $NDX $QQQ $SPX $SPY $VIX

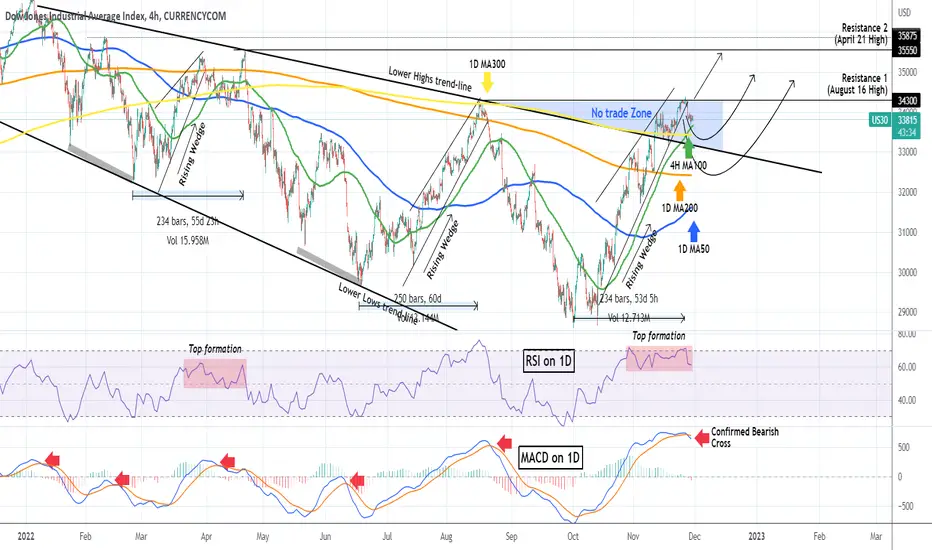
DOW JONES most likely topped at least short-termIt has been almost 6 weeks since Dow Jones (DJI) broke above the top (Lower Highs trend-line) of the Bearish Megaphone pattern that it has been trading in since the start of the year and the beginning of the 2022 correction. At the same time it broke above the 1D MA300 (yellow trend-line), which as we've mentioned numerous times was the barrier for a long-term bullish trend restoration:
As the price was basically rejected on the 34300 Resistance 1 (August 16 High), we can argue that the October - November rally has come to an end, with the price breaking below the Rising Wedge, while also the MACD on the 1D time-frame completed a Bearish Cross (red arrows). Unlike the previous counter trend rallies within the Bearish Megaphone, this time we may have the luxury to expect only a short-term pull-back, and not a new long-term selling sequence to a new market low.
As you see, we were correct for calling the area within the 34300 Resistance and the top (Lower Highs trend-line) of the former Bearish Megaphone, a 'No trade Zone'. A potential Support (and bounce point) can be that Lower Highs trend-line itself and if broken, the 1D MA50 (blue trend-line), which is traditionally the first Support during long-term uptrends. All this of course, assuming that the 4H MA100 (green trend-line), which is supporting now, breaks. If not, we can see one last attempt to break and close above Resistance 1 (34300) and target Resistance 2 (35550).
On a side note, see how the 1D RSI has been printing a Top formation similar to late March - early April. Also the November 25 top came exactly 234 days after the October 02 Low, which is symmetrical to February - April.
-------------------------------------------------------------------------------
** Please LIKE 👍, SUBSCRIBE ✅, SHARE 🙌 and COMMENT ✍ if you enjoy this idea! Also share your ideas and charts in the comments section below! This is best way to keep it relevant, support me, keep the content here free and allow the idea to reach as many people as possible. **
-------------------------------------------------------------------------------
You may also TELL ME 🙋♀️🙋♂️ in the comments section which symbol you want me to analyze next and on which time-frame. The one with the most posts will be published tomorrow! 👏🎁
-------------------------------------------------------------------------------
💸💸💸💸💸💸
👇 👇 👇 👇 👇 👇
A Mixed Bag, 30th November 2022🖼 Daily Technical Picture 📈
➤ Equity prices were all over the place on Tuesday trade. Nasdaq, S&P500 down yet European Indices and Russell 2000 were up.
➤ This is the sort of action you should expect during a consolidation phase. I'm not sure if this will end with prices moving higher or a break of trend and moving lower. We should know shortly, this consolidation phase will not last very long.
➤ My signals are leaning towards the Bearish scenario. However, these are lower conviction trades that can be switched quickly. I think the test of the support level at 390/3900 SPY/SPX will provide some insights (if prices get there).
➤ I remain with -51% short exposure. The maximum portfolio exposure is +/- 200% on capital, the level of highest conviction.
➤ Conclusion: I'll be on holidays starting today but its business as usual for my Trading. I will return 8th Dec. I'll take a break from my writings but keep you updated as necessary.

1 Day Later, 29th November 2022🖼 Daily Technical Picture 📈
➤ Well I did say a reversal in equity prices was imminent...and here we are 1 day later. VIX jumped higher. I have flipped my positions by 180°.
➤ We need to be cautious here. False short signals happen often in a strong up-trending market. Strong momentum can easily flip us back into a Bullish mode. We could also be just moving into a short-term consolidation phase where prices trade more or less sideways.
➤ I feel that I've been chasing my tail this month. My trade signals have proven to have caught the noise. I've been whipsawed out of positions by a large reversal bar that turned hard fought profitable positions to instant losses. The best example being the 10th and now 28th. Although unpalatable, I do expect to go through these conditions throughout the year.
➤ I flipped my positions to -51% short exposure. The maximum portfolio exposure is +/- 200% on capital, the level of highest conviction.
➤ Conclusion: Let's see how prices react at the strong support levels just below.
