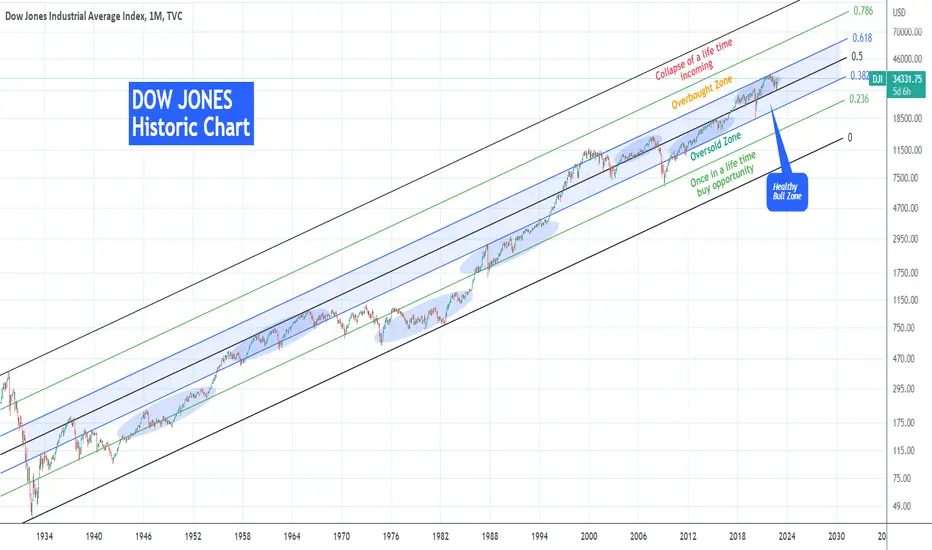
DOW JONES doing what it has always done through history. Rising.This is the Dow Jones Industrial Average Index (DJI) on the log scale since the great depression of the 1930s. A lot of talk is being done lately on whether or not this recent rally is sustainable, or if the high inflation can cause a deeper correction etc. In order to put things into perspective it is always useful to look into the longer term charts, preferably on a multi-year horizon.
This is on the 1M (monthly) time-frame where we've applied the Fibonacci Channel and its retracement levels on this 90 year price action. It is easy to realize that the Fibonacci levels have historically created zones of Support and Resistance. Right now, and despite the 2022 correction (Bear Market), Dow is within the 0.5 - 0.618 Fib, which is part of the larger 0.382 - 0.618 Fib Zone, which we call "Healthy Bull Zone" as when the index stays within it, it tends to rise on healthy growth levels.
To make things more interesting, Dow's early January top (All Time High) and subsequent rejection was made exactly on the 0.618 Fib. It shouldn't be a surprise that the recent October low and the subsequent rebound was made on the 0.5 Fib. This is a Support trend-line that 2017 only broke once during the 2020 COVID crash (which remarkably touched the 0.382 Fib and rebounded). In this 5 years Dow has been rising sustainably within this tight top half of the Healthy Bull Zone.
In fact, when the index trades within two levels tightly, it tends to do so for a very long time. Such periods are indicated by the blue ellipse patterns and besides the 2017 - 2022 one, we can see another 6 major periods.
As a result we can argue that right now Dow Jones is doing "what it always done through history" and that is rise sustainably within a tight Fibonacci zone long-term. This makes the index as bullish as it ever was.
Some added facts on this Channel. As you see we've categorized the zones based on the likely outcome they can provide. Next to the Healthy Bull Zone we see the Oversold (0.382 - 0.236 Fib) and Overbought (0.618 - 0.786 Fib) Zones, which is where the index presents a rare buy and sell opportunity respectively. In fact the 2008 Housing Crisis put us in an oversold position most recently and before that it was the 1987 Black Monday event. At the top of the Channel we have the 0.786 - 1.0 Fib 'Collapse Zone', where a mega collapse event is likely, and the index has only been there at the height of trading before the Great Depression. At the bottom of the Channel we have the 0.236 - 0.0 Fib 'Once in a life time buy opportunity Zone', which as you can imagine is the extremely oversold region where Dow has historically been the most attractive level to buy. The very bottom (March 2009) of the Housing Crisis marginally pierced through and before that (again marginally) the 1987 Black Monday.
** It is worth noting that from 1974 to 1986, the market traded almost entirely within this extremely oversold Fib zone. It was when the U.S. were ravaged by extremely high inflation levels (aftermath of the Vietnam war among others), with many sceptics today comparing the present day to that era.
-------------------------------------------------------------------------------
** Please LIKE 👍, SUBSCRIBE ✅, SHARE 🙌 and COMMENT ✍ if you enjoy this idea! Also share your ideas and charts in the comments section below! This is best way to keep it relevant, support me, keep the content here free and allow the idea to reach as many people as possible. **
-------------------------------------------------------------------------------
You may also TELL ME 🙋♀️🙋♂️ in the comments section which symbol you want me to analyze next and on which time-frame. The one with the most posts will be published tomorrow! 👏🎁
-------------------------------------------------------------------------------
👇 👇 👇 👇 👇 👇
💸💸💸💸💸💸
👇 👇 👇 👇 👇 👇
Djia
⬆️ Break Out, 24th November 2022🖼 Daily Technical Picture 📈
➤ On the eve of Thanksgiving, SPY broke out and closed above the recent high by the tiniest of margins. Long only investors will be happy. I'm guessing a few more Turkeys will make it to the dinner table. The sacrifice of the Turkey may be premature if the break out is not confirmed by further Bullish price action post the holiday. 🦃
➤ VIX is fast approaching the 20 level where it starts to get interesting for the Bears. If the VIX manages to rebound higher, it could mean the end of the Bull run. If we were to follow the 29th March and 16th August examples, then price needs to hit a resistance level too. I have 411/4110 marked for SPY/SPX500.
➤ Note that the up move since the yearly low is NOT a "Change of Character" - see the weekly SPY chart insert. If prices break lower, it confirms that this Bullish move is just a Bear market rally.
➤ I remain long with a +68% long exposure. The maximum portfolio exposure is +/- 200% on capital, the level of highest conviction.
➤ Conclusion: Not a time to celebrate for the Bulls.

DOW JONES Too close to the August 16 High!It has been almost 2 weeks since Dow Jones (DJI) broke above the top (Lower Highs trend-line) of the Bearish Megaphone pattern that it has been trading in since the start of the year and the beginning of the 2022 correction. At the same time it broke above the 1D MA300 (yellow trend-line), which as we've mentioned numerous times was the barrier for a long-term bullish trend restoration:
The index is now very close to making another major bullish break-out as it is very close to the 34300 Resistance (1) which was formed by the August 16 High, which was rejected on the (former) Lower Highs trend-line and 1D MA300. If broken it will be the first time in 2022 that Dow Jones will break a Lower High. In this case, we will automatically target 35550 (Resistance 2), which was formed by the April 21 (Lower) High.
If the price gets rejected though, the index should seek the short-term Supports of 1) the 4H MA100 (green trend-line), which during the July - August and March - April counter rallies was the supporting level (when broken, the downtrends started) and 2) the 1D MA200 (orange trend-line), which held as Support for the first time in a year on November 10. Keep in mind that during Dow's bull rallies, the 1D MA50 (blue trend-line) is typically the Support.
On the downside, watch the 1W RSI, which has been glued to the top of the Channel Up in the past two weeks. Failure to break above it, should accelerate the sell sentiment towards the 1D MA50. The trigger for that can be a Bearish Cross on the 1D MACD, which is very close to be formed. All prior Bearish Cross in 2022 have kickstarted major sell-offs.
-------------------------------------------------------------------------------
** Please LIKE 👍, SUBSCRIBE ✅, SHARE 🙌 and COMMENT ✍ if you enjoy this idea! Also share your ideas and charts in the comments section below! This is best way to keep it relevant, support me, keep the content here free and allow the idea to reach as many people as possible. **
-------------------------------------------------------------------------------
You may also TELL ME 🙋♀️🙋♂️ in the comments section which symbol you want me to analyze next and on which time-frame. The one with the most posts will be published tomorrow! 👏🎁
-------------------------------------------------------------------------------
👇 👇 👇 👇 👇 👇
💸💸💸💸💸💸
👇 👇 👇 👇 👇 👇

➕ Stay Positive, 23rd November 2022🖼 Daily Technical Picture 📈
➤ The sideways movement looks to be resolving to the upside. The SPY/SPX500 is looking to breach and stay above the psychologically important 400/4000 level. VIX has collapsed heading towards the 20 level.
➤ Commodity Trading Advisors (CTAs) or better known as Trend Followers are a group of institution traders/whales. They are computer driven algorithms that take medium term positions across hundreds of markets. The stronger the trend (up or down) the larger their positions (subject to volatility constraints). I understand these strategies well since I used to work for one of the largest CTAs in the world.
➤ As this Bullish run continues, a major increase in their long equity positions may be starting to trigger. This is exacerbated further with the lower volatility e.g. falling VIX. Lower volatility means the ability to take on larger positions per unit of risk. This buying will be a major support for equities.
➤ I have increased my long exposure to +68%. The maximum portfolio exposure is +/- 200% on capital, the level of highest conviction.
➤ Conclusion: Stay positive, I'm riding the up trend for now.

Dow Jones: Down UnderAfter moving sideways for a while, we're expecting Dow Jones to drop into the orange target zone between 32 762 and 31 980 points to complete wave iv in orange in order to push the trend back up to the orange target zone between 34 305 and 35 466 points. After managing to pull itself up there to compete wave (i) in blue, we expect the course to drop back South.
In our alternative scenario, Dow Jones can't turn the trend up this early and continues to drop below the support line at 31 738 points. After crossing this mark, the course should sink further into the blue zone between 31 331 and 29 789 points until wave alt. (iii) in blue hits its low before turning back up to move North. blue hits its low before turning back up to move North.

🔪 Chop Chop... 22nd November 2022🖼 Daily Technical Picture 📈
➤ The sideways movement continues in equities. A Bullish bias still applies although my signals have weakened in its conviction.
➤ Choppy conditions are not ideal for my Strategy. Especially the kind where there is a tight range with high volatility (large up and down swings). This is because a large reversal against my entry will usually force me to exit, resulting in a bigger than average loss. If repeated multiple times, it can cause a pro-longed drawdown in returns.
➤ So far the choppy conditions experienced has been on relatively low volatility. It's not ideal but also not the worst. The good news is that these conditions tend to not last long. Markets will "snap" out of it soon to trend in one direction.
➤ I have reduced my long exposure to +42%. The maximum portfolio exposure is +/- 200% on capital, the level of highest conviction.
➤ Conclusion: I have a feeling markets are more interested in watching the Football World Cup right now. 🏆

DJI SHORT POSITIONAccording to the harmonic pattern AB=BC is showing the bareish signal and also it is near resistance area good time for short

📈 Higher Please... 21st November 2022🖼 Daily Technical Picture 📈
➤ Equity prices moved side-ways last week. This is good news for the Bulls. As prices have held within a tight range, there is so far no sign of a "Change of Character" or CHoCH.
➤ The CHoCH concept comes from Wyckoff analysis. It describes an abnormal price bar or set of price bars that moves against the recent price trend. A major pause or a change in trend often results from a CHoCH. I do not see this with the current price action. This would infer Buyers are accumulating equities for a push higher. My trading signals agree as I added long positions across the board in all indices that I trade.
➤ Of course, nothing is set in stone, I'll have my fingers close to the exit button in case price action shows a change in the Bullish narrative.
➤ I currently have +102% long exposure in the market. The maximum portfolio exposure is +/- 200% on capital, the level of highest conviction.
➤ Conclusion: All eyes will be on the Football World Cup but mine are firmly fixed on the Charts. 👀

DOW JONES Holding the 1W MA50 could repeat the 2016/17 rally!This is the price action of the Dow Jones Industrial Average Index (DJI) since the 2008/09 Bear Cycle of the Housing Crisis. On the log 1W chart, we can fit it within a Channel Up pattern, with the January 2022 top as its latest Higher High. As you see there is considerable room to fall and touch the bottom (Higher Lows trend-line) of the Channel Up but on the Sep 26 - Oct 10 1W candles, the 1W MA200 (orange trend-line) acted as Support and pushed the price back above the 1W MA50 (blue trend-line).
It is important to mention that while the candle action was on Lower Lows, the 1W RSI was on Higher Lows, i.e. on a Bullish Divergence. The last time we had all this conditions fulfilled together, was during the August 2015 - February 2016 correction. As you see, the RSI was on Higher Lows while the price Double Bottomed, found Support on the 1W MA200 and rebounded back above the 1W MA50. The 1W MA50 then turned into a Support and never broke and that gave way to the very strong 2016/17 rally.
You can see that its bars pattern fractal (black) fits almost perfectly on the late 2021/2022 price action. As a result, we could expect a gradual recovery into a strong rally in Q3 2023, especially if the 1W MA50 holds as a Support. If not, the 2022 Channel Down (red) can give more Lower Lows until Dow hits the bottom of its 14 year old Channel Up.
-------------------------------------------------------------------------------
** Please LIKE 👍, SUBSCRIBE ✅, SHARE 🙌 and COMMENT ✍ if you enjoy this idea! Also share your ideas and charts in the comments section below! This is best way to keep it relevant, support me, keep the content here free and allow the idea to reach as many people as possible. **
-------------------------------------------------------------------------------
You may also TELL ME 🙋♀️🙋♂️ in the comments section which symbol you want me to analyze next and on which time-frame. The one with the most posts will be published tomorrow! 👏🎁
-------------------------------------------------------------------------------
👇 👇 👇 👇 👇 👇
💸💸💸💸💸💸
👇 👇 👇 👇 👇 👇

djia in 5th wave of parabolic rise... targets 100k +Historical DJIA chart with all the 4 parabolic "basings" highlighted with boxes...
therefore we are currently witnessing 5th wave of a parabolic rise, often the wider in range ... 100K is minimum target considering upper channel of deviation , but parabolic rises won't generally "respect" such Logarithmic Deviations.
More aggressive targets around 130/150K for a topping around the years 32/34
(in time we'll see if the accelaration starts to break the deviations or not, for now we assume 100k target within 10/12 years)
Note: analysis is valid for SPX as well!

🤨 When in Doubt...Find Support, 18th November 2022🖼 Daily Technical Picture 📈
➤ I'm sounding like a Psychologist today. Professional Traders do make use of Psychologists or Coaches to analyse and evaluate their performance as well as for counselling and self-reflection. We amateurs often just mumble to ourselves.
➤ S&P500 gapped lower at open before rebounding to finish near the daily highs. The strong support level at 390 held well. It was a mixed bag for other indices. NASDAQ and Russell 2000 were particularly weak. Although it is a mixed picture, there is less doubt in my mind. I would like to get Bullish here.
➤ I currently have +34% long exposure in the market. Additional exposure is possible if prices move as I expect.The maximum portfolio exposure is +/- 200% on capital, the level of highest conviction.
➤ Conclusion: More action please!

🤨 When in Doubt...17th November 2022🖼 Daily Technical Picture 📈
➤ ...sit out. In my humble opinion, the current short-term price action in equities are highly ambiguous. This often happens at key inflexion points when prices temporarily move sideways. Sometimes this is the market digesting recent moves e.g. the upward surge or the market is in search of direction awaiting some news or catalyst.
➤ With ambiguity comes the danger of forcing a trade or reading too much into a particular price action. For example, the Russell 2000 small cap stocks performed terribly today, breaking below support. Technically, I could make a case for shorting the Russell yet if I look at other equity indices, they ended above or very near support levels on this bearish day. The VIX (fear index) actually contracted showing lack of bearishness. Based on my experience, it is much better to wait another day for things to develop than eagerly risk capital in search of gains.
➤ I currently have zero exposure in the market. The maximum portfolio exposure is +/- 200% on capital, the level of highest conviction.
➤ Conclusion: Thursday is Action Day?

DOW JONES Will a Rate Cut do more harm than good to stocks?Bold question and should certainly raise some eyebrows but let's look at the complete picture. This chart displays Dow Jones (DJI) and the Federal Reserve Interest Rate (blue trend-line) on the 1M (monthly) time-frame.
I will make it quick to save us time and then each person can individually make their own conclusions from the chart. The combination of the Fed raising the rates since the start of the with Dow dropping, hasn't been seen often historically on this data set dating back to June 1954. In fact historically, Dow (stock markets in general) tend to rise along with rates. Some times (4 in history) when the Rate Cut happens, Dow drops as well. Most of the times the stock rally continued without a major drop even after the Rate Cuts.
Basically the only time on this data-set that resembles today (assuming the Fed pauses or cuts in 2023) is 1969/70, 1972-74 and 1983/84, with the latter largely associated with Fed Chair Volcker monetary practices. During those periods, Dow started falling as the Rate was rising and then dropped after the Rate cut.
Do you think we are repeating such a period? Will a Rate Cut in the near future do more harm than good to the stock market?
-------------------------------------------------------------------------------
** Please LIKE 👍, SUBSCRIBE ✅, SHARE 🙌 and COMMENT ✍ if you enjoy this idea! Also share your ideas and charts in the comments section below! This is best way to keep it relevant, support me, keep the content here free and allow the idea to reach as many people as possible. **
-------------------------------------------------------------------------------
You may also TELL ME 🙋♀️🙋♂️ in the comments section which symbol you want me to analyze next and on which time-frame. The one with the most posts will be published tomorrow! 👏🎁
-------------------------------------------------------------------------------
👇 👇 👇 👇 👇 👇
💸💸💸💸💸💸
👇 👇 👇 👇 👇 👇

Return to Normal Rally for DJIA$DIA is showing a negative Monthly RSI divergence and this type of price action is emblematic of a 'return to normal' rally after a bubble pops. Chart points to further losses into 2023. I would personally heed the warning coming from Jeff Bezos and others. I am still bearish on equity markets given rates, geopolitics, and the FTX fallout.

That Was Not Good, 16th November 2022🖼 Daily Technical Picture 📈
➤ I didn't change the title from yesterday's post for an obvious reason. The news about the "errant" missile landing in Poland. The first thing that comes to mind is "uncertainty". Uncertainty is not good for markets albeit this one may be short-lived.
➤ That being said, from a technical view point, markets bounced off the daily low strongly closing the gap created by the higher open. The uptrend is intact for now. Speaking of gaps, there is a large gap unclosed since 13th Sept just above current levels in the S&P500 (SPY). There is also the massive gap created on 10th Nov when prices leapt higher post inflation data. The market likes to close those price gaps.
➤ The last of my long positions was closed. Leaving us in a familiar territory of having no positions. That's not a bad thing given the uncertainty.
The key to my Strategy is to only get involved when there is a clear price structure with a good probability of success. I don't think I'll be out of the action for long though. Price action on Wednesday will most likely determine new positioning.
➤ I currently have zero exposure in the market. The maximum portfolio exposure is +/- 200% on capital, the level of highest conviction.
➤ Conclusion: Wednesday is Action Day.


DOW JONES broke above all Bear Market barriers!The Dow Jones index (DJI) broke last week, following the impressive drop on monthly inflation, above both the Lower Highs trend-line dating back to the January 05 market high and the 1D MA300 (yellow trend-line), which was the level that rejected the previous Lower High on August 16.
We've been discussing the importance of this level as a Rejection Zone for over a month and didn't hesitate to claim that a break above the 1D MA300 would restore the long-term bullish trend:
We are not backing down from this claim. The continuous monthly drop on the CPI is lifting market hopes again for a looser monetary policy but technically, there are still some key levels to consider. The price is approaching the 34300 Resistance (1), which is essentially the August 16 High. Right now it appears that we are inside a no-trade zone (blue triangle) where any direction is possible.
A closing above the 34300 Resistance (1) would be a bullish break-out signal targeting the 35540 Resistance (2), which is practically the April 21 Lower High. On the other hand, a break below the 1D MA300 and below the former Lower Highs, should seek the 1D MA200 (orange trend-line) but more importantly the 1D MA50 (blue trend-line) as Supports, a usual buyers accumulation level during Bull Runs.
P.S. Watch the huge bullish divergence on the RSI 1W time-frame.
-------------------------------------------------------------------------------
** Please LIKE 👍, SUBSCRIBE ✅, SHARE 🙌 and COMMENT ✍ if you enjoy this idea! Also share your ideas and charts in the comments section below! This is best way to keep it relevant, support me, keep the content here free and allow the idea to reach as many people as possible. **
-------------------------------------------------------------------------------
You may also TELL ME 🙋♀️🙋♂️ in the comments section which symbol you want me to analyze next and on which time-frame. The one with the most posts will be published tomorrow! 👏🎁
-------------------------------------------------------------------------------
👇 👇 👇 👇 👇 👇
💸💸💸💸💸💸
👇 👇 👇 👇 👇 👇

That Was Not Good, 15th November 2022🖼 Daily Technical Picture 📈
➤ It was looking good for my Bullish position until the final hour of trading. Then things went sour. Prices reversed course. That Was Not Good.
➤ It was not good for two reasons:
➀ My fear of being taken out by choppy conditions has materialised. Exit signals were given. That meant I had to cut most of my positions at market close. Overall a set of break-even trades. Not disastrous but very disappointed with giving back profits.
➁ Price action leaves the market in "limbo", at least in my view. It was not a sufficiently strong reversal to give a short signal. That means price can maintain its Bullish stance but without my participation. A case of Fear of Missing Out (FOMO).
➤ At the end of the day, it was good to stay disciplined and not second-guess my process. Wavering on decisions and letting emotions get in the way will lead to inconsistent behaviour and erosion of confidence. Eventually, that will lead to disastrous results.
➤ I hold a +8% long exposure. The maximum portfolio exposure is +/- 200% on capital, the level of highest conviction.
➤ Conclusion: Looking forward to the next set of trades that are just around the corner.

Bull Charge Continues, 14th November 2022🖼 Daily Technical Picture 📈
➤ Good Monday, we experienced some extraordinary market action last week. Beginning with the BTC/Crypto plunge and ended the week with a massive bullish move in equities. Not to be outdone was the sharp reversal in the USD. The USD reversal is a big deal.
➤ Equities extended the rally off the yearly lows accelerating past key resistance levels. Price is in "clear" air territory. VIX continues to contract, it may continue to do so heading for the 20 level. At that level momentum to the upside ceased on numerous previous occasions.
➤ I was caught out by the "false" Bear positioning mid-week. I'm hoping to recoup those losses quickly with a continued rally. Will the Trading Gods play another trick?
➤ Interesting to note that the NASDAQ has led the way in the latest up move whereas it was lagging badly from the bullish move off the yearly lows. Perhaps there is some sector rotation here. Reducing exposure to bluechip names (DJIA) and increasing exposure to Tech where market participants are severely underweight.
➤ I continue to hold a +64% long exposure. The maximum portfolio exposure is +/- 200% on capital, the level of highest conviction.
➤ Conclusion: The price is always right.

Dow Jones Industrial AverageSaturday 12 November 2022
23:36 PM (WIB)
The dimming of the light makes the picture clearer
It's just an old photograph
There's nothing to hide
When the world was just beginning
I memorized a face so it's not forgotten
I hear the wind whistling'
Come back anytime
And we'll mix our lives together
Heaven knows- what keeps mankind alive
Every hand- goes searching for its partner
In crime- under chairs and behind tables
Connecting- to places we have known
I'm looking for a
Home - where the wheels are turning
Home - why I keep returning
Home - where my world is breaking in two
Home - with the neighbors fighting
Home - always so exciting
Home - were my parents telling the truth?
Home - such a funny feeling
Home - no one ever speaking
Home - with our bodies touching
Home - and the cameras watching
Home - will infect whatever you do
We're Home - comes to life from outa the blue
Tiny little boats on a beach at sunset
I took a drink from a jar
and into my head
Familiar smells and flavors
Vehicles are stuck on the plains of heaven
I see their wheels spinning round
and everywhere
I can hear those people saying
That the eye- is the measure of the man
You can fly - from the stuff that still surrounds you
We're home - and the band keeps marching on
Connecting - to every living soul
Compassion - for things I'll never know

Bull Charge, 11th November 2022🖼 Daily Technical Picture 📈
➤ What an extraordinary day! The Bulls have run riot. The Bears have been crushed like myself.
➤ Price has charged through the top resistance level and looks unlikely to stop there with so much momentum. There's really not much more to be said. You can see the empty space till the next resistance level on the chart.
➤ The saviour for my portfolio has been the small short positioning. This is of course somewhat offset by such a huge advance in price. Overall, correct positioning kept losses to a manageable level of around -2%. That takes my performance into negative territory for the month. I was also caught wrong-footed in September in a similar fashion. Losing is part of Trading and so is risk management.
➤ At market close, I reversed my short positions with a larger long position. The portfolio sits at +64% long exposure. The maximum portfolio exposure is +/- 200% on capital, the level of highest conviction.
➤ Conclusion: Wrong direction but right-sizing - risk management.
NOT INVESTMENT ADVICE

S&PHello and Welcome to this analysis
Post FED rate hike last night, S&P declined sharply and is now near a strong support in daily and hourly time frame.
This level of 3675-2725 could work as a good support for now.
Bounce for 3800-3850 or reversal till 4000-4050 likely if held

GOLD TRADING IDEA 10 NOVEMEBRGOLD consolidated yesterday within the range with some dollar strength in play,
we got some deeper pullback to 1721-1722 level , today also we will be stick with higher time frame bearish bias , and macro information advantage supporting dollar strength,
Also today the CPI & jobless numbers will remain some key data shedule to release @ 7.00 PM IST will be pplaying important tole in next move of gold.
If overall inflation numbers comes higher than expected then FED's hawkish path will be continued and we can see market back to higher time frame macro sentiment i.e Gold bears, Strong dollar, indices sell off
If data shows improvement and CPI is lower than expected or as expected, investors will take that as hope of FED pivots and it will keep gold more bullish , dollar bearish and indices bullish.
Trade idea for gold today.
1. We will be looking to sell gold near key level 1715-1716.5 Targeting 1700-1695 , 1721 will be another are of interest to sell gold for Target 1700.
2.We have a huge liquidity gap between 1702-1682, which shall get filled ,so any break below 1700 will be a short entry after confirmation for Target 1682,
3.We will be looking to buy only above 1723 with till 1730,
4. Unless we have a catalyst for dollar weakness ( New geopolitical tension , improved CPI data , currency intervention , bond buying etc) we are not seeing gold breaking above 1730. with some surprising CPI numbers only we are seeing gold to break above 1730 and there on till 1765.
