Trapped, 20th October 2022🖼 Daily Technical Picture 📈
➤ Prices continue to dance around the key support/resistance levels. This time falling under my key level.
➤ It's not the only index doing this dance. STOXX50 is sitting right under the short-term resistance at 3484. On the other hand, DAX is hovering above the 12670 support. This also holds true for DJIA and NASDAQ, the former below and the latter above their respective key levels. This is not sustainable. They will need to decide on which side of the fence they belong.
➤ I'm now leaning towards the Bear case. I'm not acting on it right now as my short-term Index Trading Strategy hasn't sent a Short signal. However, my medium-term equity signal is threatening to flash RED and I've entered a Short trade for my long/short individual stock trading strategy. Timing is never perfect on these but the overall bias is there.
➤ I remain long with +20% exposure but will change drastically soon. The maximum portfolio exposure is +/- 200% on capital, the level of highest conviction.
➤ Conclusion: The dance continues in these choppy and volatile conditions. Be agile and don't get trapped sitting on the wrong side of the fence.
Djia

DJIA To 25k?This is just based on a previous bearish divergence that looked very similar to the current situation. A return to 25k would take us to long term support and match the fib level of the last similar pattern.
Thank you for viewing my post!

🟰 Support & Resistance, 19th October 2022🖼 Daily Technical Picture 📈
➤ Today's price action is showing the importance of support and resistance levels. At market close, you can see the price just holding a key level after another eventful day. Price gapped higher at open, it then dropped to fill the that gap and then recovered. After hours trading is showing further upside pressure post Netflix earnings results.
➤ The continued Bullish case would be for prices to overcome the next level of resistance at the 379/380 area on the SPY. This would set a higher high.
➤ The Bearish case would be the inability for it to hold that resistance level and/or close below the 371 level where price closed.
➤ I remain long with +20% exposure.
➤ Conclusion: Choppy conditions with supports and resistance levels in play. Directional/Trending trades will be difficult unless price clears these areas. Mean-reversion trades work best here.

Chop Chop, 18th October 2022🖼 Daily Technical Picture 📈
➤ Prices did at U-turn (again) and reversed all of Friday's losses with Financials/Banks leading the way. We are back in a ranging market with this yo-yo type action. Prices may attempt to move higher to the top of the larger range if VIX continues to contract.
➤ I took profits on my European long positions as exit signals were given by my Strategy. I added a small long position in S&P500.
➤ I'm long with +20% exposure. I may add more US exposure if prices weaken. The maximum portfolio exposure is +/- 200% on capital, the level of highest conviction.
➤ Conclusion: I don't know when the chop will stop. It can be a tricky environment to trade especially with such large daily moves.

Hodl The Best Performing Asset of 2022 - Bear Market StrategyELEPHANT token has outperformed during the bear market, providing oversized gains for holders. Has outperformed 100% of the top 100 cryptocurrencies in the last year. Outperformed all the major stock market indexes as well as gold.

Upside Bias, 17th October 2022🖼 Daily Technical Picture 📈
➤ Despite the retracement lower on Friday following the Thursday price surge, I am still looking for further upside. This holds true as long as the we don't have a daily close below the lows. As mentioned previously, I am expecting a re-test of the low, this may be that test or it is still to come in the near future. My medium-term outlook (for a few weeks) is also biased upwards.
➤ Clearly we are in a risk-off environment where performance of DJIA > S&P500 > NASDAQ. Therefore, I'm not expecting any long lasting bounce until there is evidence that NASDAQ is taking the lead. Riskier stocks should lead any substantial long-term rebound.
➤ I'm long with +40% exposure all in European indices. I would like to add US exposure but keeping risk low at this juncture is the right call IMO. The maximum portfolio exposure is +/- 200% on capital, the level of highest conviction.
➤ Conclusion: Earnings should play a greater role this week and next as all the big names will be releasing results and providing future outlook.

Dow Jones Industrial Average relative strength on the riseThe overall US equity market is still having a hard time stabilizing and catching its footing, however, if we examine the major US indices closer we do notice more and more relative strength coming out of the Dow Jones Industrial Average.
This past week it never took out its September lows, the MACD momentum oscillator continues to climb aggressively, and on Friday we remained in the top 1/3 of Thursday's bullish engulfing bar.
I started a position on Thursday and will keep a tight leash risk managing it going forward. More notes on the chart.

SPX, What is going on the market ??Which Bull Cycle is market correcting?
Answer to this question shows us where MAY be a good point to buy the dip with open eyes and how to be prepared for alternative scenarios.
As shown and explained on the charts, there are three alternative scenarios for now and all of them are valid although they have different probabilities. :
1. Best case scenario :
In this very bullish scenario , market is just correcting the bull run started after pandemic low. In this case, we are not to much far from the SPX bottom. 3195 to 3505 corresponding to 0.618 and 0.5 Retracement levels is the zone in which SPX will bottom. I give least possibility to this scenario but surely keep it in mind since it is still a valid one.
2. Moderate case scenario :
In this scenario, SPX is correcting the bull cycle started at 60.96 on 1974 and ended at ATH. In this case, SPX will reach to very unpleasant and painful target zone which is 1878-2439 corresponding to 0.618 and 0.5 retracement levels respectively. I give most possibility to this scenario. Proofs and evidences for this scenario( and two others of course ) are provided on my published video idea about DJIA (See related idea for more details).
3. Worst case scenario :
In this scenario, market has completed 90 years impulsive section and mother of all crashes is on the way. I prefer to pray for the market in this case instead of any explanations. May GOD Bless The Market.
Maybe it is time to leave the habit of (( Buy the Dip )) with closed eyes.
Good luck every body.

Roller-Coaster, 14th October 2022🖼 Daily Technical Picture 📈
➤ That was some ride. Pre-CPI markets pumped higher by 1.5% before plummeting post data to -4% for the Nasdaq. Only then to climb back up and finish strongly by over 2%. Similar price action happened on 24th Feb 2022 as the war started in Ukraine. TBH, I expected this movement but certainly not the extent of the volatility.
➤ I initially took off my long DAX position pre-CPI during the pump. DAX was significantly outperforming other indices on the day so I took some profits. That meant I had minimal exposure to the CPI data as I was only net long with 10% exposure. As prices plummeted, there was very minor movement in my portfolio as my long STOXX50 position held up better than my NASDAQ shorts.
➤ By the end of the European trading day, I bought back the DAX position and cut the NASDAQ shorts. Leaving me with +40% long exposure. After US market close, I decided against adding US long positions at this stage given the size of the upward move. The maximum portfolio exposure is +/- 200% on capital, the level of highest conviction.
➤ Conclusion: We may get some continuation of the rally but there should be an attempt of the re-test of the low at some stage.

US30 key levelsmarket hitting resistance level 1 around 30100 with a strong level around 30350/450 on a longer downtrend, good places to short market for swing low

Next leg down to 3.5K by mid-OctSPX both time-wise and level-wise is ready to begin the next leg down to at least 3.5K by mid Oct.

Risk-Off, 13th October 2022🖼 Daily Technical Picture 📈
➤ Minor down day in US indices. Pre-market was firmly positive until the PPI (Producer Price Index) numbers were released. It showed persistent inflation in the costs of production. These costs can be passed on to consumers and therefore feeds into CPI/Consumer inflation numbers.
➤ With CPI numbers coming out Thursday/today, we should expect a jump in volatility. I have no idea what the inflation number will be but there are bullish signs that I am willing to take some risk for a potential upside move.
➤ I further reduced my remaining short NASDAQ position to -10% and added long exposure of +40% with STOXX50 and German DAX. An overall small +30% long exposure. I think this is a sensible level of risk use given market conditions. The maximum portfolio exposure is +/- 200% on capital, the level of highest conviction.
➤ Conclusion: I'm risk-on for a move higher but also risk-off by taking a lower exposure than previous days. Manage your risks.

Bounce Time? 12th October 2022🖼 Daily Technical Picture 📈
➤ US indices returns were wide spread. With DJIA finishing flat and Nasdaq continuing to fall. Large intra-day gains were unable to hold up. S&P500 hit a new low but the daily close held above the previous yearly low set on 30th Sept that can be considered as temporary support. VIX may also be peaking. There is a potential for a good sized bounce. CPI/Inflation data out Thursday should define where markets are headed in the very short-term.
➤ I locked in some profits by cutting positions in SPX500 and DJ30. My short exposure is -40%, composed of NASDAX and STOXX50. The maximum portfolio exposure is +/- 200% on capital, the level of highest conviction.
➤ Conclusion: Price action Wednesday/today prior to CPI data release is crucial for my next move. I'm leaning towards a bounce and may turn bullish.

1M: DJIA and other major indexes still BEARISHAs above...
1M charts for the major indexes look very similar: bearish... likely accelerated down trend in short term. Nov 2022 into early 2023 going to be red candles. I think final lows will surprise most.
Coming to a chart near you in the near term: Nasdq 9K, DOW 26-27K, S&P 3.2-3.3K.
Good luck traders. Will follow.

💤 No Hibernation...11th October 2022🖼 Daily Technical Picture 📈
...for the Bears as equity prices continue to fall in an orderly manner. The NASDAQ closing on a fresh new low, S&P500 not far behind. That being said, we did see prices reverse aggressively when the S&P500 made a new daily closing low on 30th Sep, so there's that possibility once again.
➤ Across in Europe, the indices couldn't hold large gains after gapping down lower. I added a small short position in STOXX50 as prices may play catch-up and go back to test the yearly low.
➤ I increased my short exposure to -80%. The maximum portfolio exposure is +/- 200% on capital, the level of highest conviction.
➤ Conclusion: Prices look to continue their march lower. The worrying sign is that it is very orderly and shows no capitulation. That's when a more permanent bottom is usually found.

DOW JONES RSI and MACD patterns hint to a June-Aug like rebound.The Dow Jones Industrial Average (DJI) has been highly volatile today following a two day selling sequence on last week's closing. Following the NFP on Friday, the market is entering the anticipation mode over this week's CPI report, which is crucial on the Fed's rate policy. Amidst this high volatility we have spotted a recurring pattern, which has been previously bullish on the medium-term during this year's Bear Market.
As you see, every time the MACD formed a Bullish Cross while the RSI (both on the 1D time-frame) bounced on its Oversold Zone and made a Lower High, Dow formed a temporary Low and started a 2-month rebound. During the June - August rebound, the index reached as High as the 0.786 Fibonacci retracement level before getting heavily rejected on the 1D MA300 (yellow trend-line).
As a result, as long as last week's Support holds, we are expecting a medium-term rebound towards at least the upper Fib levels and the 1D MA200 (orange trend-line). Short-term traders can target the 1D MA50 (blue trend-line).
Remember this doesn't constitute a long-term trend change, which remains bearish. In order to see the sentiment reverse to bullish, we should see at least a closing above the 1D MA300. A closing below last week's Support, should invalidate the medium-term pattern and instead extend the selling all the way to this Bear Market's Lower Lows trend-line at least.
-------------------------------------------------------------------------------
** Please LIKE 👍, SUBSCRIBE ✅, SHARE 🙌 and COMMENT ✍ if you enjoy this idea! Also share your ideas and charts in the comments section below! This is best way to keep it relevant, support me, keep the content here free and allow the idea to reach as many people as possible. **
-------------------------------------------------------------------------------
You may also TELL ME 🙋♀️🙋♂️ in the comments section which symbol you want me to analyze next and on which time-frame. The one with the most posts will be published tomorrow! 👏🎁
-------------------------------------------------------------------------------
👇 👇 👇 👇 👇 👇
💸💸💸💸💸💸
👇 👇 👇 👇 👇 👇

🕺 Dancing Around Support, 8th October 2022🖼 Daily Technical Picture 📈
➤ Equities took a dive towards the lower support level. Note that this support level has already been violated by a daily close to set a yearly low on 30th Sep. This makes it less reliable as a line of defence. Still, price did bounce off that level prior to end Friday trade.
➤ The momentum is with the Bears but we should tread carefully around these levels. Price could just as easily reverse course if there is hesitation to push lower.
➤ The European indices did not give me an additional short signal (as yet). They have bounced harder off the bottom than US indices and have held those gains much better.
➤ I reduced my exposure to -60% to take some profit prior to the weekend. Politicians/Govt Officials tend to do their best work on the weekend. Prices can gap either way if something happens. The maximum portfolio exposure is +/- 200% on capital, the level of highest conviction.
➤ Conclusion: Prices are dancing around support. A small solo dance to celebrate my wins but I'm in no mood to Tango.

Sidelining, 6th October 2022🖼 Daily Technical Picture 📈
➤ Bears tried to push back the charging Bull and ended without success. Price bounced off the support line strongly. Clearly there are buyers at these levels. VIX contracted further. Is the panic over?
➤ I'm of the opinion that we may see the price rise a little more followed by a down move as a secondary test of the yearly low before another leg up. It is unclear to me if the down move will make a new low or a higher low. We may end up with something that looks like the price action in mid-Jun. A temporary sideways market.
➤ My current exposure is 0%. The maximum portfolio exposure is +/- 200% on capital, the level of highest conviction.
➤ Conclusion: Waiting on the sidelines, looking to trade a potential sideways market.

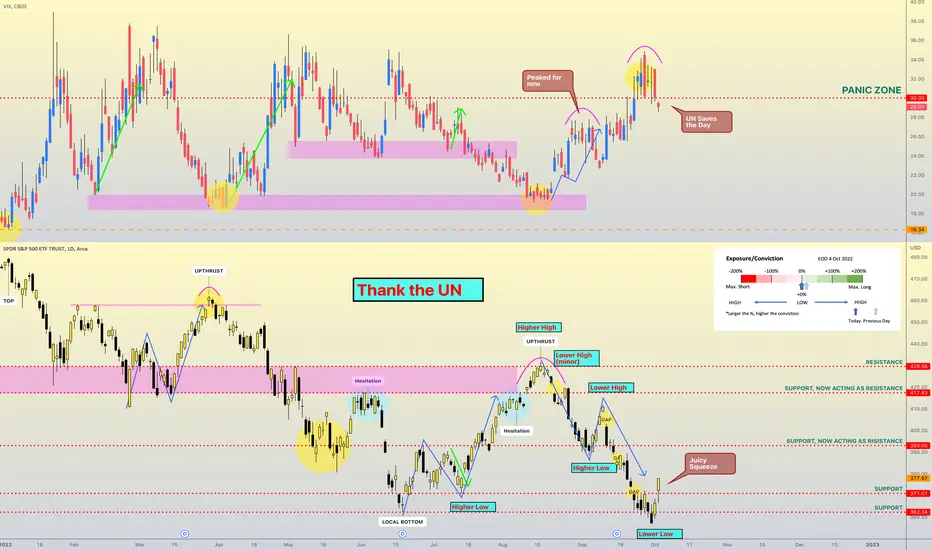
Thank the UN, 5th October 2022🖼 Daily Technical Picture 📈
➤ The United Nations (UN) is meant to save humanity from itself. I guess a floundering equity market does meet that remit especially with rumours of Credit Suisse troubles. Also, think of the millions of Baby Boomers who are retiring every day. They need to sell off their risky assets (i.e. equity portfolios) to buy safer alternatives like bonds for their retirement. We certainly don't need the richest generation in history begging for government handouts. 4% interest rates look pretty decent especially when the inflation fight is won.
➤ The resulting short squeeze was quite breathtaking. Shorts did have an opportunity to take down their risk when the rally ceased momentarily intraday, but I'm guessing, many didn't or even added to their positions. Lesson: Don't fight the UN.
➤ This squeeze seems to have some more juice left. The resistance level is all the way up at 393 for the S&P500/SPY. The VIX has dropped below my panic level of 30. This may continue to drop until we get a sizeable correction.
➤ My current exposure is 0%. I got out too early but IMHO it was still the right decision at the time. The maximum portfolio exposure is +/- 200% on capital, the level of highest conviction.
➤ Conclusion: Make a donation to the various UN programmes since they saved your bacon.
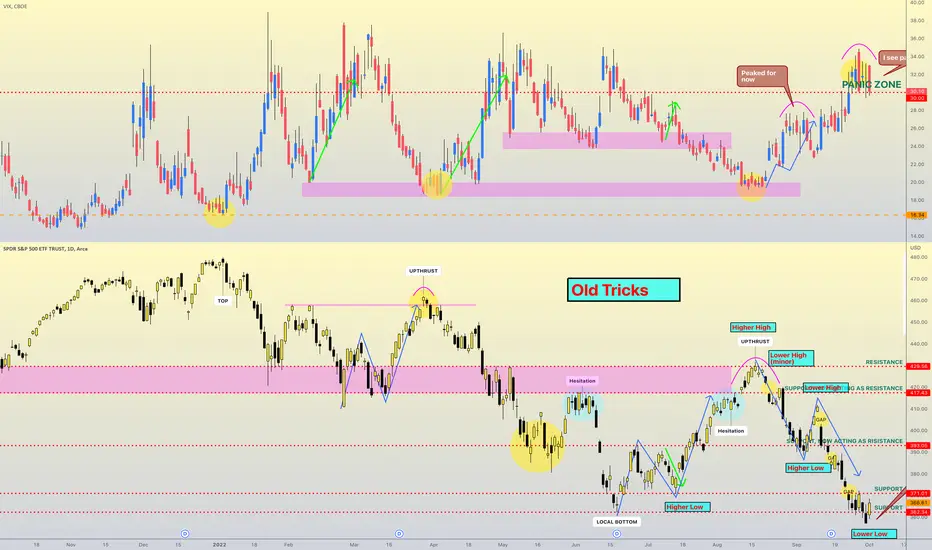
Old Tricks, 4th October 2022🖼 Daily Technical Picture 📈
➤ Wallstreet pulled out the oldest trick in the trading book to start off a new month: a fake breakout. A breakout occurs when price confidently breaks through a support or resistance level and closes beyond that level. This is what occurred on 30th Sept to set a new yearly low for the S&P500. Once the price breaks out, it tends to keep moving in that direction except when it doesn't. That's why Trading is so difficult.
➤ Luckily for me, the breakout faded and I recouped a lot of the recent losses. I took off most of my positions too. The price is back in the chop zone between supports. I don't particularly fancy choppy conditions.
➤ The Bulls will be keen to point out this price action is laying the foundation for a double-bottom formation. It's too early to tell. Certainly, there is pent up buying. This type of formation is usually symmetrical i.e. the left and the right bottoms look similar. This would mean it will need to spend some time around the support zones to build the right bottom.
➤ My current exposure is +20% in NASDAQ. I'll give it a day or so more to catch up to other indices as it lagged on this surge. I don't want to be involved holding European indices at the moment as they are trading below the resistance level. The maximum portfolio exposure is +/- 200% on capital, the level of highest conviction.
➤ Conclusion: New month, new beginnings...it certainly is so far.
Breakdown, 3rd October 2022🖼 Daily Technical Picture 📈
➤ I was looking for market participants to do some window dressing on Friday to make a horrible September end on a positive note. Instead, we saw window selling. Ending with an exclamation mark to show how bad the month was for long only investors. It was a bad end for myself as well. I gave back pretty much all the profits from earlier in the month.
➤ The silver lining was that the VIX hardly budged. This was enough for me to add long SPX500 and DJ30 positions. The obvious risk is increasing exposure when the SPX500 has broken the yearly low. I am keenly aware. However, a systematic trading process only works if we stick to the rules over the long-run. Making subjective decisions based on emotions will only introduce inconsistency.
➤ There are heightened levels of risk. UK pension system is in crisis due to bond yield upheaval. There is a rumour that a large financial entity is having liquidity issues. All this brings back memories of the Lehman collapse and the onset of the Global Financial Crisis.
➤ My current exposure is +100% composed of all 5 indices I trade, SPX500, DJ30, Nasdaq, STOXX50 and DAX. The maximum portfolio exposure is +/- 200% on capital, the level of highest conviction.
➤ Conclusion: New month, new beginnings...

US30 - Recession Outlook - Con'tI adjusted wave 6 on the current chart to the current downside move.
Haven't been looking at US30 for awhile, but been focusing more on the S&P chart. Either way, the pattern is the same.
Market is playing out, kind of as forecasted based on charts published months back.
Are we there yet?
At wave 5, the market was going "are we there yet?" Then the market shown that it is still strong. We had a bear rally where retail traders/investors continued to buy into. The buying-the-dip movement was still still going strong strong too, and the economy was declining but still not as bad as it seemed to be. There was still some optimism in the market. But all of that was perhaps short sellers taking profit at a key level where price broke a fairly strong resistance. The rebound above strong resistance on 1W above 31,450.
Damn, this shit is real
Now wave 6, it looks to me as the "oh shit, things are not actually getting better" phase. We continued the downtrend, posting a 2nd negative month consecutive bearish candle with a top wick that didn't break above previous candle body, a huge bearish body and very small lower wick.
Are we going up?
Looking at the 2008 crash pattern, we do see some ranging before the final drop, then recovery. It looks to me like a "we going up?" phase. Then price dips further to a "value price point", and market pivots, it will then be time to buy on a higher low, close back within the previous ranging price points.
Just on charts, probably looking to see how markets react around 26,600, if the market finds a bottom. But I'm also expecting this time to be different as we had so much money printing. We're in an environment where we are rising interest rates to try to combat inflation, yet faced with a recessionary outlook. Also, with a pandemic which just passed, geopolitical events, war. Truly uncertain times.

US indexes Possible Double BottomEven though the S&P broke the previous summer low if Monday opens higher we can expect that this was a fakeout and the double bottom pattern will come into play. The overall fundamental picture is more critical and dominant than some lines on the chart. However, still, it can be a high-risk, high-reward trade that can come into great use if we already have some puts on the main indexes as the retail investors holding puts are at record highs. With the VIX index being highly volatile recently it wouldn't be a big surprise if this break of the bottom is a fake out and retest of the fibo level which overlap with the technical analyzes.
Again the overall trend is bearish but if we see an opportunity that matches our trading style we have to act accordingly.
