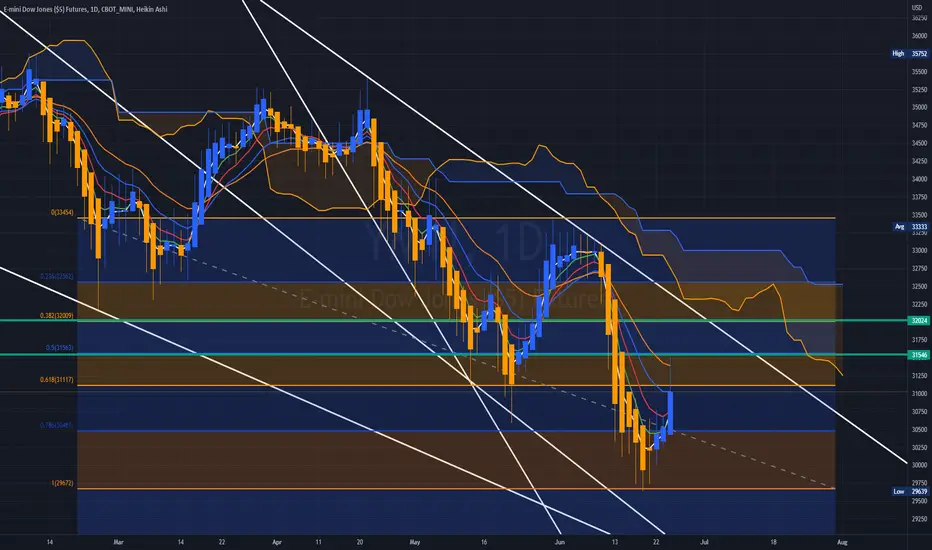
DOW JONES rejected before the 1D MA50. Double Bottom possible.The Dow Jones index (DJI) has had a strong red 1D candle yesterday right before attempting a test of the 1D MA50 (blue trend-line), which is the short-term Resistance. As you see the long-term pattern has been a Channel Down since the January 05 high. This formation has enabled us to accurately identify and trade the Highs and Lows as you can see from the two most recent analyses below:
With some adjustments made, we can now see just how closely the recent short-term rebound follows the previous Lower Low formation on February 24. That sequence had a rejection before a 1D MA50 test and eventually made a Double Bottom before the rally to the Lower Highs (top) trend-line of the Channel Down started. As a result it is possible to see this 1 week correction stop near 29680 and then rebound towards the 0.618 Fibonacci retracement level.
The 1W MA200 (red trend-line) is right below the Channel Down and as we've mentioned numerous times on our Channel is the long-term market Support. Breach of that level with a weekly candle closing should immediately test the -0.236 Fib extension and then pursue lower targets on the weekly from there. If that happens we'll follow up with extensive updates.
--------------------------------------------------------------------------------------------------------
Please like, subscribe and share your ideas and charts with the community!
--------------------------------------------------------------------------------------------------------
Djia

DOW - YM Ketchup28.2K and 24K await... it's simply a matter of time.
Industrials for the Post Industrial Co-Dependent Economy
are being Sold as if there is no tomorrow...
Nothing like a solid lift to re-enter the Trend, which is Down.
Counter-Trends are nasty Bed Fellows.
3M, Dow, and a great many of the glory days Equities are
being dumped on the heads of Ma n' Pa.
Dividend-paying Junk Co frankly makes sense for them... for now.
CD Rates did not decline in the most recent TNX Pullback.
Banks are now more hated than ever.
Brokers are in the lead, though as Passives are frankly the new Index
Funds of the early 2000s - CLick this and that, whammy, Ron Burgundy
would be proud.
Stay Classy INDU.
Stay Classy.
DJIA SHORTS We can see a probable sell setup on Us30. Price might react on the level of resistance or push more upwards to the next level of resistance. Let's see how this goes

DOW JONES The Buy/Sell correlation with Unemployment & InflationThis is a simple yet extremely informative analysis of the Dow Jones (DJI) index on how its multi-year correlation with the Unemployment Rate (black trend-line) and the Inflation Rate (grey trend-line) provide the ultimate Entry/ Exit signals on the long-term. The blue trend-line is Dow's 1M MA50 and the green is the 1M MA100.
As you see, with the sample starting in 1987, every time the Unemployment is Low while Inflation is high, the stock market peaks and starts declining. Similarly, when the Unemployment is high while Inflation is low, the stock market bottoms out and starts recovering. Notably, this correlation even stood right during the 2020 COVID crash where the shift happened extremely fast, with unemployment being low + inflation high just before the crash and right after the unemployment spiked (following the lockdowns) while inflation hit a 5 year bottom and started rising after the stimulus started kicking in.
That led to the 2022 stock market correction on massive inflation but with unemployment (still) near pre-COVID lows. According to the model that was a Sell Signal on stocks and we see how it was accurate yet again.
The key now is the 1M MA50 (blue trend-line). During the previous three corrections (COVID 2020, Mortgage Crisis 2008, DotCom Crisis 2001), the market broke below the 1M MA50. The exception was the October 1987 crash (Black Monday), where the sharp crash reached exactly the 1M MA50 and rebounded. In the three corrections that did break below it though, the index always reached the 1M MA100 (green trend-line). So a solid long-term sell signal from now on would be if the price breaks the 1M MA50 with a target on the 1M MA100. If by that time inflation bottoms out and starts reversing while the unemployment rate is much higher, we can start considering buying stocks again on a multi-year horizon.
--------------------------------------------------------------------------------------------------------
Please like, subscribe and share your ideas and charts with the community!
--------------------------------------------------------------------------------------------------------

DJIA SHORTS [Us30]We see Price approach a level of resistance and we can also see a break of the minor uptrend . There is a probability we see a drop.

In the PocketAppears that the DJI is currently in the pocket for either a potential point of consolidation of prices and a bounce off of the 200 MA, or a consolidation of prices and a further push to the downside.
I personally am looking for a bounce back toward the 55 MA.
-PP

DOW JONES Critical Channel bottom test.Dow Jones (DJI) has been trading within a Channel Down since its All Time High on January 04 2022. It is the very same Channel on which we based the accurate sell call 10 days ago as the price failed to break above the 1D MA50 (blue trend-line) for more than a week:
Right now the index broke below the previous Support and made a new Low. In fact it is exactly on the Lower Lows trend-line of the Channel. The 1W MA200 (red trend-line) is at 29300 but if it closes a 1D candle below the Lower Lows trend-line, it will most likely break below the 1W MA200 as well and reach the -0.236 Fibonacci extension around 28770.
Until that happens, we have to follow the accurate long-term pattern and go on a tight SL buy towards the Lower Highs (top) trend-line around 33000. The 1D RSI is just above the oversol 30.00 level which has worked as a buy entry for many months.
--------------------------------------------------------------------------------------------------------
** Please support this idea with your likes and comments, it is the best way to keep it relevant and support me. **
--------------------------------------------------------------------------------------------------------

US30 Market Crash Incoming soonI'm not a financial advisor and these are only my pure thoughts about what US30 will do soon.
This is my prediction for the US stock market crash that I think will happen in the next weeks to months this year.
Some people say this crash will be the biggest of all time, I think is possible. My estimation is a crash of a minimum of 25-30%.
The best chances are to happen in the mid of the year between july and September.
Usually in this range, people go on holiday, and buying habits change (more spending on transportation, local attractions, expensive food, etc) which can lead to imbalance that can lead to a market crash when added the actual fear of a market crash in calculations.

NASDAQ: Moving Below EMA 200, Bearish Trend Doesn't Over Yet?Hello Fellow U.S. Investor/Trader, Here's a Technical outlook of NASDAQ!
Support our content by smashing the like and follow button, you also can share your opinion in the comment section below.
NASDAQ is forming the head and shoulder pattern near the EMA200 line. Furthermore, The MACD indicator created a death cross, which confirmed a potential downside momentum to the target area.
The Outlook will be active after the price hits the confirmation line.
*All the explanations are presented on the chart*
The roadmap will be invalid after reaching the target/resistance area.
"Disclaimer: The outlook is only for educational purposes, not a recommendation to put Long or Short Position on the NASDAQ Index"

DJIA SHORTS [US30]We can see Price breaks a level of support and we are seeing a retest + that we can see the rejection there. We might see Price push downwards on Market Open.
TIP: Never doubt your system. FOLLOW IT

DOW JONES Consolidating below the 1D MA50 for a weekDow Jones (DJI) eventually rebounded at the bottom (Lower Lows trend-line) of its long-term Channel Down, since our last analysis that indicated a sold R/R ratio for going long:
Since the end of May though, the index has failed just before a 1D MA50 (blue trend-line) test and turned sideways below that level. This is similar to the last Lower High formation on the Channel Down, as shown on the previous analysis.
Technically, as long as the price remains below the Lower Highs trend-line, it is a sell (on a tight SL of course) opportunity towards the 30650 Support and if that breaks, towards the -0.236 Fibonacci extension around 29500.
Even in the event of a break-out, we still can't call a long-term bullish reversal as the range within roughly 34150 - 35540 is a Neutral Zone (we can apply tight scalping strategies there) as late March - late April showed. Only with a weekly candle close above the 35875 Resistance, we can assume that Dow has resumed its long-term bullish trend.
--------------------------------------------------------------------------------------------------------
Please like, subscribe and share your ideas and charts with the community!
--------------------------------------------------------------------------------------------------------

How we made 7.26% in May with 63% win rate while markets fell Last month when markets took a beating, we were able to make 4% within 11 days of trading using trading view to help track our trades.
The month of May was a really volatile month and it took some courage to get back to where we are today. As you can see from our equity curve, we were down about 7% midway through the month and staring down a gun barrel.
teenfxtrader.wordpress.com
Here are some very important lessons that we learnt from our trading from the month of May.
1) Do not get into markets that you don't understand before testing them out thoroughly. - We started getting into indexes and especially the JPN225. What we didn't realize is that this pair moves really fast and can either wipe you out and make you lots of money. We lost 4% on the first trade but made 12% on the next. Still not sure whether we should trade this but if a good opportunity comes up why not? Just keep your positions super small.
2) Risk control is so important even if you are losing - - It is so easy to lose your marbles when you are down 7% in the first 15 days. However we need to accept that losing trades will happen and the only way you can control it is by not risking too much. Your account will ebb and flow. Some weeks are just flat. Sometimes you can have a quarter where you are totally flat and I am sure that will happen for us soon as well.
3) Winning percentages means nothing - We have always been taught in school that you are a loser if you do not get 80% and above. In trading, losing 40% of your trades is still okay as long as you lose with dignity. This month we lost 37% of our trades but yet made 7.26% by holding on to our winners.
Where do we see the market going in June 2022?
The past 2 weeks has been bullish. This is not the end of the market crash unfortunately. It is call a bear rally or a bull trap and we are likely to see the markets being pushed down to the previous lows. We still believe the target for DJIA is 26,000 and the S&P will reach 3600 within the next 3-4 months. In the meantime, we plan to take small trades to help us grow our equity as we have done in the last 45 days.
In the meantime, we are looking at a sell of JPN225 at the level marked out but it is an uptrend so we may go long until this price is reached for the sell.
Good luck!
DJI potential for rise! | 2nd June 2022On the H4, with price moving above the ichimoku cloud , we have a bullish bias that price will rise from our 1st support at 32814 where the 23.6% Fibonacci retracement is to our 1st resistance at 33463 in line with the swing high resistance.
Any opinions, news, research, analyses, prices, other information, or links to third-party sites contained on this website are provided on an "as-is" basis, as general market commentary, and do not constitute investment advice. The market commentary has not been prepared in accordance with legal requirements designed to promote the independence of investment research, and it is therefore not subject to any prohibition on dealing ahead of dissemination. Although this commentary is not produced by an independent source, FXCM takes all sufficient steps to eliminate or prevent any conflicts of interest arising out of the production and dissemination of this communication. The employees of FXCM commit to acting in the clients' best interests and represent their views without misleading, deceiving, or otherwise impairing the clients' ability to make informed investment decisions. For more information about the FXCM's internal organizational and administrative arrangements for the prevention of conflicts, please refer to the Firms' Managing Conflicts Policy. Please ensure that you read and understand our Full Disclaimer and Liability provision concerning the foregoing Information, which can be accessed on the website.

Dow Futures facing resistance Dow jones Futures are facing resistance at 50% retracement zone. We may see sideways move for few days

DOW JONES 1 month target at 33170 unless the Low breaks.Dow Jones (DJI) has been trading within a Channel Down throughout this whole 2022 correction. Friday's low along with the 1D RSI sequence, resemble the bottom fractal of the last Lower Low within the Channel Down on March 08. The index rebounded to just above the 0.618 Fibonacci retracement level at the time to price the Lower High. Currently the 0.618 Fib is around 33670. That is our target on a 1 month horizon, unless Friday's low breaks, in which case we will sell hedge it to the -0.236 Fib extension at 29500.
--------------------------------------------------------------------------------------------------------
Please like, subscribe and share your ideas and charts with the community!
--------------------------------------------------------------------------------------------------------

DOW JONES 19th MAY 2022Rising inflation, conflict in Ukraine, prolonged supply chain disruptions, pandemic-related lockdowns in China, and monetary policy tightening by the central bank have weighed on financial markets recently, fueling concerns about a global economic slowdown.
Wall Street ended sharply lower Wednesday, with Target Corp shares losing about a quarter of their market value. Highlights concerns about the United States (US) economy after retailers became the latest victims of a price spike. On Wednesday the Dow Jones Industrial Average fell 3.57% to 31,490. Correction target : 33,144. Price may be lower if it breaks below the support area.

Dow Jones potential for a drop! | 18th May 2022On the H4, with price moving below the ichimoku cloud , we have a bearish bias that price will drop from our 1st resistance at 32553 where the 50% Fibonacci retracement is to our 1st support at 31294 in line with the swing low support. Alternatively, price may break 1st resistance structure and head for 2nd resistance where the 78.6% Fibonacci retracement .
Any opinions, news, research, analyses, prices, other information, or links to third-party sites contained on this website are provided on an "as-is" basis, as general market commentary, and do not constitute investment advice. The market commentary has not been prepared in accordance with legal requirements designed to promote the independence of investment research, and it is therefore not subject to any prohibition on dealing ahead of dissemination. Although this commentary is not produced by an independent source, FXCM takes all sufficient steps to eliminate or prevent any conflicts of interest arising out of the production and dissemination of this communication. The employees of FXCM commit to acting in the clients' best interests and represent their views without misleading, deceiving, or otherwise impairing the clients' ability to make informed investment decisions. For more information about the FXCM's internal organizational and administrative arrangements for the prevention of conflicts, please refer to the Firms' Managing Conflicts Policy. Please ensure that you read and understand our Full Disclaimer and Liability provision concerning the foregoing Information, which can be accessed on the website.

Dow Jones potential for drop! | 17th May 2022On the H4, with price moving below the ichimoku cloud , we have a bearish bias that price will drop from our sell entry at 32602 where the 50% Fibonacci retracement is to our take profit at 31294 in line with the horizontal swing low support. Alternatively, price may break entry structure and head for our stop loss at 33250 where the 78.6% Fibonacci retracement .
Any opinions, news, research, analyses, prices, other information, or links to third-party sites contained on this website are provided on an "as-is" basis, as general market commentary, and do not constitute investment advice. The market commentary has not been prepared in accordance with legal requirements designed to promote the independence of investment research, and it is therefore not subject to any prohibition on dealing ahead of dissemination. Although this commentary is not produced by an independent source, FXCM takes all sufficient steps to eliminate or prevent any conflicts of interest arising out of the production and dissemination of this communication. The employees of FXCM commit to acting in the clients' best interests and represent their views without misleading, deceiving, or otherwise impairing the clients' ability to make informed investment decisions. For more information about the FXCM's internal organizational and administrative arrangements for the prevention of conflicts, please refer to the Firms' Managing Conflicts Policy. Please ensure that you read and understand our Full Disclaimer and Liability provision concerning the foregoing Information, which can be accessed on the website.

DOW JONES Can post a short-term rebound.Dow Jones (DJI) is on the 2nd green 1D candle following a streak of 6 red days. The long-term trend has been a Channel Down since the January 05 High and it appears that following Thursday's low as a Lower Low on the Channel, it appears to be repeating the previous Lower Low sequence of January 24. This led to a rebound slightly above the 0.618 Fibonacci retracement level from the Lower High. That is currently around 33895, so if the fractal is replicated, we can expect a rebound around 34000.
If on the other hand we get a 1D candle close below 31235, we expect more downside to the -0.236 Fibonacci extension (around 30220) which was where the February 24 low was priced, before we see a new rebound.
--------------------------------------------------------------------------------------------------------
** Please support this idea with your likes and comments, it is the best way to keep it relevant and support me. **
--------------------------------------------------------------------------------------------------------

MSCI Index Emerging Markets MSCI Index seems bottoming out on monthly chart
Buying should start immediately soon in all Emerging Markets in upcoming days .
#nify #niftybank #commodities

US30 BEARISH DYNAMICSDow recently bounced off the support and retraced to the monthly pivot before dropping back to the support.
A small retracement may happen at the beginning of the week before gathering enough momentum to break the support and head towards 31700 initially.

Dow Jones 1915-2020 History of key U-turns. Situation now.Throughout the history of the chart from 1915 to 2020, we see two similar situations as now on the chart:
1) 1930 (the beginning of the global economic crisis called the Great Depression).
2) 1966-1970 (Stagflation in the USA from the late 60s to the beginning of the 70s which grew into the oil crisis of 1973).
Dow Jones Industrial Average. Which reflects the development of the industrial component of US stock markets. The index covers the 30 largest US companies. This is the US economic health index and, as a consequence, the "health" of the world. After all, the United States is the locomotive of the economy of the whole world and one must agree with this, regardless of your political beliefs. It should also be borne in mind that virtually all countries of the world are "colonies" of the United States, even if the local authorities of these countries play the role of political and economic antagonists USA.
All this is due to such a structure as the Fed, and their fraud with unlimited production of "air dollars".
Residents of the United States are very lucky that this private non-state fraudulent structure was located in this country and the US dollar was chosen as the currency to enslave the world.
But all interstate trade between these "colonies" is carried out for a "real US dollar."
As Mayer Rothschild once said very prophetically for his modern descendants:
"Give me control over the release of money in the state, and I do not care who will write its laws."
Thanks to a series of various crises and wars, local elites are destroyed or subordinated, and the resources of these colonies are completely transferred to scammers of a global scale. Also, thanks to the stock market and especially the derivatives market, it is possible to “utilize” for a while the huge mass of “air dollars” produced.
Thus, restraining the hyper inflation of both the dollar and the currencies of the whole world.
The derivatives market is a virtual market that, thanks to speculation, is increasingly moving away from the real economy. According to Mark Mobius, executive president of Templeton Asset Management, the value of derivatives on the world market currently exceeds the global GDP by at least 10 times.
According to the Futures Industry Association (FIA), one of the world's largest professional associations of derivatives exchanges, the derivatives market in the United States alone is about 600 trillion. dollars, while global GDP does not exceed 70 trillion. dollars. Without derivatives, the dollar, thanks to the ocean of copies of dollar numbers in the real world, would have depreciated long ago and the existing system would not have been able to function. The existing paper dollar scam has already reached its dead end, and scammers have come up with a more “airy” and “dimensionless” cryptocurrency utilizer for the whole world, given past mistakes.
All tangible real resources in the world are bought for a dollar made from "air". This is a brilliant scam, but a more grandiose scam, which everyone expects as a blessing and especially crypto fans pray for it, is yet to come. The crowd is promised what she does not have. “The desired fruit is sweet.” These are rights, freedoms, material resources ... But promises, like all “color” revolutions and similar actions, will remain only promises, and “hungry” will have to “go on a diet” and work even harder. After all, the game plan “good-bad” will be embodied in reality and will confuse people's consciousness. The existing economic slave-man will become a commodity with a serial number.
In the near future we will see the “overflow” of the paper dollar into the “crypto dollar” and its repainted versions of “crypto pound”, “crypto yuan” and others ... The crowd will win! The crowd will rejoice! What the States allegedly fought against so much will be translated into reality by the same States. Long live decentralization and complete dibilization! Long live the transformation of people of economical slaves into goods!
And yet people want this for a temporary benefit. No one wonders what will happen next. That everything has been done so that the rich become richer and the poor, naturally, even poorer and more powerless. In the end, all these things are planned and implemented in stages by people with power and, as a result, very rich. But all changes are made by poor and stupid people with the help of lower animal instincts under the guidance of their oppressors who are always in the shadows.
It has always been, is and will be. Key actors of power for the crowd are changing, but real management has not changed for a long time. But you must understand that even in our seemingly unfair world, if you have intelligence above the average, strength of mind, dignity, hard work, you are doomed to be rich by the standards of the average person in the main crowd.
But you also need to be afraid not only of “power”, but also of a stupid, poor, irritable, envious crowd.
Which is governed by the same "power."
Middle-income people will be destroyed with the help of poor idlers.
Many characters truly believe that in the "new world" they will find a better place than this person now occupies. But places for a good life are already sold out in advance. Good places were not enough for everyone. Therefore, now, under the pretext of fighting ...... the elite is being shot from the lower layers of the hierarchy, which has not received a ticket to the "new world". It was planned a very long time ago, but the performance somehow dragged on.
In the near future, this will be presented to the main crowd as a struggle against their oppressors, but in reality this is just a small bandit in the global hierarchy.
To the crowd, they will tell and show the “horrors” of what they wanted to do with her and how the heroes saved her. Then the crowd will 100% believe in this legend and will be even more grateful to their real "oppressors-savior." Then the crowd will be ready for everything, even for the most stupid and immoral things.
_____________________________________________________________
Throughout the history of the chart from 1915 to 2020, we see two similar situations as now on the chart:
1) 1930 (the beginning of the global economic crisis called the Great Depression).
2) 1966-1970 (Stagflation in the USA from the late 60s to the beginning of the 70s which grew into the oil crisis of 1973).
I also ask you to pay attention to the time intervals of especially long uptrends highlighted in green:
1) Uptrend 1933-1969. The trend lasts 37 years.
2) Uptrend 1982-2020. The trend duration is 38 years at the moment.
Please note that they have a time interval + - the same at the moment, even in the current trend, an excess of 1 year.
Only a successful gradual transfer of a “paper air dollar” to a “crypto air dollar” can help not to repeat the situation in 1930 and move the price as in 1970 at least into lateral movement.
And in each of these two situations, the denouement was different.
In the first - 1930 , a breakthrough of the trend line and a decrease in the market only from the zone of breakthrough of the trend line by -81.5%! And only the Second World War helped to reverse the trend in the and raise the industry of this country. But still, the repetition of the previous highs of the index before the crisis of the Great Depression was repeated only after 25 years in 1954!
In the second situation, 1966 - 1970, there was a touch of the uptrend line (which acted as support), a rebound from it, then a reverse test and a breakdown of the uptrend line and the transition to long lateral movement and slowdown of industry growth by 19 years! Stagflation of the US economy. And only in 1982 did the strongest uptrend begin which continues until then.
Let's look at these two situations, what happened in these situations in more detail:
1 SITUATION 1930 "A lot of goods - no money"
The Great Depression of 1930 - the global economic crisis, which began in October 1929 with the stock market crash in the United States and continued until 1939. (Most acute from 1929 to 1933). The 1930s are generally considered the period of the Great Depression.
The Great Depression most affected the United States, Canada, Britain, Germany and France, but was felt in other states. Industrial cities have suffered the most, and construction has almost stopped in a number of countries. Due to the reduction in demand, prices for agricultural products fell by 40-60%.
What President Hoover would later call the “crazy speculation orgy” began on the US stock market in 1927. According to the economic theory of the time, stock and bond markets reflected and foresaw the “underlying realities” in the creation of goods and services; but by 1928, American stock markets noticeably broke away from reality. While business activity was steadily declining, stock prices were rising rapidly. According to Galbraith, money flowed to the market so abundantly that "Wall Street seemed to be devouring all the money in the world."
Black Thursday and Black Tuesday
The first drop in stock prices occurred in September 1929: then, stock prices both dropped unexpectedly and quickly recovered. Then, on Wednesday, October 23, the first large-scale liquidation of positions began: in a day more than 6 million shares passed from hand to hand, and market capitalization fell by $ 4 billion. “Confusion” began on the market, as prices were transferred from New York across the country via telegraph, which was almost two hours behind. On Black Thursday, October 24, the market opened sharply; a record 12,894,650 shares were sold per day; by noon, losses reached $ 9 billion. However, when the day ended on the market, there was even a slight recovery, relative to intraday lows. The following Tuesday, October 29, 16,410,000 shares were already sold (this record lasted 39 years); Black Tuesday began a period of almost continuous two-week fall in prices. By mid-November, capitalization fell by an incomplete $ 26 billion - which amounted to about a third of the value of shares in September.
Further development of the recession.
A full-scale recession in the United States began in August 1929, two months before the stock market crash (construction volume began to decline back in 1926). In February 1930, the Fed reacted to the onset of the crisis, reducing the prime rate from 6% to 4%. In addition, government bonds were redeemed from the market to maintain liquidity.
In June 1930, the so-called Smoot-Hawley tariff was adopted in the United States, introducing a 40% duty on imports to protect the domestic market. This measure has become one of the main channels for transferring the crisis to Europe, as sales of European products in the United States were difficult. Does this remind you of anything? A game of Trump and the Chinese leader with duties in the recent past?
At the end of 1930, bank depositors began a massive withdrawal of deposits, which led to a wave of bank failures. As a result, the absolute contraction of the money supply began. The second banking panic occurs in the spring of 1931. All these months, the authorities have not reacted to the growing economic tsunami. GDP in 1930-1931 falls by 9.4 and 8.5%, respectively, and the unemployment rate rises from 3.2% at the beginning of 1930 to 15.9% by the end of 1931.
In 1932, GDP fell by 13.4, and only since 1929 - by 31%. The unemployment rate in 1932 increased to 23.6%. For more than three years since the crisis began, more than 13 million Americans have lost their jobs. Agricultural prices have fallen by 53% since 1929. For three years, two out of every five banks went bankrupt, their depositors lost $ 2 billion in deposits. Money supply since 1929 has declined at face value by 31%.
In the 1930s, mass famine erupted across America, leading to massive marches and strikes.
In 1932, crowds of starving Bonus Army veterans from all over America arrived in Washington. The US government crushed the march with tanks and terror.
The consequences of the Great Depression in the world.
1) the level of industrial production was dropped to the level of the beginning of the XX century, that is, 30 years ago;
2) in industrialized countries with developed market economies, there were about 30 million unemployed;
3) the situation of farmers, small traders, and the middle class worsened. Many are below the poverty line;
4) the birth rate has sharply decreased. According to social workers, in 1933, in some districts, between 25 and 90% of school-age children suffered from malnutrition.
5) the number of supporters of both communist and nationalist parties has increased (for example, in Germany the National Socialist German Workers' Party came to power).
The way out of the great depression.
The most important anti-crisis measure that was adopted was the start of World War II with the help of Germany in the foreign territories of countries of economic competition. This action helped to finally reverse the trend and raise the US industry. To eliminate the oversupply of goods and services by eliminating the economies of other countries due to war. Expand the US product market. Due to the decline of other competitor countries, the United States has become a monopolist in various industries. But still, the repetition of the previous highs of the index before the crisis of the Great Depression was repeated only after 25 years in 1954!
A positive incentive to continue the upward trend was the character such as the First Secretary of the CPSU Central Committee from 1953 to 1964, Nikita Khrushchev . In view of Khrushchev’s socio-economic and political adventures, the “Stalin gold ruble” (10 times) had to be greatly devalued and its gold content reduced.
In the late 1970s, the gold content of the Soviet ruble was de facto eliminated altogether. Since the time of Khrushchev, foreign Soviet trade with most countries began to be carried out in US dollars.
In addition, the Soviet Union became a "donor" of developing countries and began to supply the Western world with cheap energy and industrial raw materials. And the gold reserves that were created under Stalin began to rapidly lose. So, there is a cold war show for the people between the USSR and the USA, but in fact, the USSR economy has long been working for the USA. After all, everything that the USSR bought / sold outside its borders was supposed to make settlements only in dollars (the currency of its "enemy"). And all thanks to Uncle X and those who stood behind him.
The second positive stimulus for the growth of US industry at highs was the war in Vietnam . I will not dwell on this, as everything is clear here, how this is connected with the stimulation of industry. The end of the war served as a recession of this growth and stagflation of the US economy, and so we got to the second similar situation No. 2.
A scam of 1933 for the confiscation of gold in the population (a fine of up to $ 10,000 and / or imprisonment of up to 10 years).
Also, who is not in the know during the Great Depression in the USA, a grandiose scam was conducted under the guise of anti-crisis measures - this is confiscation of gold from the population. First, voluntarily, and then forcibly, on pain of a prison term of 10 years.
Therefore, do not hesitate a little later, all of your savings and assets will be taken away from you in the name of the law. Very poor, lazy, envious, bile people will support this. Everything, as always, is nothing new.
It is not customary in society to talk about forcibly confiscating gold from a population in the most “democratic” country in the world. Although most people do not even know about it.
During the Great Depression, on April 5, 1933, US President Franklin Roosevelt issued Decree No. 6102 on the actual confiscation of gold bullion and coins from the public and organizations . All individuals and legal entities located in the United States (including foreign nationals and companies storing gold in the United States), with rare exceptions, were obliged to exchange gold for paper money at the price of $ 20.66 per troy until May 1, 1933 an ounce at any bank in the United States that has the right to accept gold. Any contracts and securities nominated in gold were also declared illegal, payments on them were prescribed to be made in paper money in accordance with the specified exchange rate.
Subsequently, the gold was sent to the Fort Knox National Kentucky Gold Depository of the Federal Reserve (Federal Reserve System), the construction of which was completed by the end of 1936. After the collection of gold was completed, its official price was sharply raised to $ 35 per ounce. That's how they all cheated.
Roosevelt called the legend of the Decree the relief of a critical situation in the banking industry, as well as the prevention of panic export of gold abroad.
Gold was not subject to confiscation in the United States, owned by foreign state banks and foreign states, and also intended for international trade. Individuals could keep their gold no more than $ 100, as well as rare and collectible coins. Also insignificant gold reserves for professional activities were separately regulated.
For evasion of gold, repressive measures were established: a fine of up to $ 10,000 and / or imprisonment of up to 10 years.
Based on the law on the gold reserve, adopted in January 1934, Roosevelt issued a proclamation on January 31, 1934, which reduced the gold content of the dollar from 25.8 to 15 5/21 grains and set the official price of gold at $ 35 per ounce. In other words, the dollar was devalued by 41%.
2 SITUATION 1966 - 1970
In this period, as it was now, the touch of the uptrend line (which acted as a support), a rebound from it, then a reverse test and a breakdown of the uptrend line and the transition to long lateral movement and deceleration of industry growth for 19 years! Stagflation of the US economy. And only in 1982 did the strongest uptrend begin which continues now.
Until the second half of the 1960s, a cyclically developing economy was characterized by the fact that a decline in production and depression caused, as a rule, lower prices (deflation) or, at least, hindered their increase. The phenomenon of stagflation was first clearly defined in the late 1960s. So, in 1970, unemployment and inflation in the USA reached a record level of 6% and 5.5% in the post-war period (until the mid-1960s, inflation did not exceed 1–1.5%, and unemployment - 2–2.5%) . The second surge in stagflation occurred in 1974-1976, when the rate of increase in prices in the United States was more than 10%, and unemployment reached 7.6%. In general, over the 16 years from 1949 to 1965, retail prices in the United States grew by 29%, and over the next 17 years from 1965 to 1982 - by 100%, that is, the average inflation rate in the indicated period grew 3-4 times, the unemployment rate rose at least 2-3 times.
When President Johnson urged Congress to cut taxes in 1964, he allocated large sums from the state budget to finance both social programs and the Vietnam War. Although, according to Keynes's doctrine, a small deficit in the state budget and a gradual depreciation of the national currency are beneficial for the economy, inflation under Johnson began a sharp acceleration. At the same time, the US superiority in world trade began to fade, as did its global superiority in economics, geopolitics, commerce, technology and culture, which was established after World War II. Since 1945, America has had unlimited access to sources of raw materials and markets for its products worldwide. Due to the ruin of Europe during this era, about one third of all industrial goods in the world were produced in the USA. But by the 1960s, not only developed, but also developing third world countries began to compete with the United States in the economy and raise prices for their raw materials. Japanese and European automobiles, steel, electronics and other high-tech products successfully competed with American ones not only abroad, but also in the US domestic market. This gave rise simultaneously to rising prices and a wave of ruin for American manufacturers, a phenomenon known as stagflation, that is, stagnation amid inflation.
The price level continued to rise and in the first two years of Nixon’s presidency increased by 15%. Then in 1971, Nixon announced the termination of the conversion of the dollar into gold, which led to the crisis of the Bretton Woods system and the subsequent devaluation of the dollar. This helped revive the export of American goods, but imported raw materials and other goods became even more expensive. In addition, Nixon in the same 1971 for 90 days froze the level of prices and salaries in the United States, and then put them under the control of a special federal agency. Inflation slowed somewhat, but unemployment began to rise. To stop the decline in production, Nixon again lifted restrictions on the level of prices and wages, which caused a new round of inflation.
In the long run, Nixon’s shock led to stagflation in the United States, reduced the purchasing power of the dollar, and exacerbated the American recession of the 1970s. The rejection of the connection between the world's main reserve currency and gold ensured for the United States a transition to the issuance of fiat money (money from the air).
Fiduciary, fiat, symbolic, paper, credit, unsecured money - money not secured by gold and other precious metals, the nominal value of which is established and guaranteed by the state, regardless of the cost of the material used for their manufacture. As a rule, immutable to gold or silver. Often fiduciary money functions as a means of payment on the basis of state laws obliging them to be accepted at par. The cost of fiduciary money is supported by people's faith that they can exchange them for anything of value. The fall in the authority of state power leads to a decrease in the purchasing power of fiduciary money, devaluation, and "flight from money."
Reasons for US stagflation.
Economists name two main causes of stagflation:
1) decline in production due to a sharp change in the price of raw materials, which is important for this economy (the so-called price shock). A sharp increase in prices for the importing country or a decrease for the exporting country. For example, this is the 1974 oil crisis in the United States.
2) the simultaneous slowdown in production growth (stagnation) and price increases (inflation) may be the result of an incorrect economic policy of the government. For example, the country's central bank can cause inflation by releasing too much money into circulation, while too active regulation of the labor market and production by the state can slow down business activity (stagnation).
The impetus for the start of the 1974 oil crisis was the sharp rise in oil prices from OPEC countries. The situation was aggravated by the incorrect reaction of national central banks, which tried to stimulate growth by injecting money into the economy (see Keynesianism), which led only to an uncontrolled rise in prices and wages. On the graph we see the lateral movement and the breakdown of the support of the horizontal channel. Overly dangerous situation.
___________________________________________________________________
The situation with the index on the Dow Jones chart now.
It is important how the price will react when retesting near the uptrend line, which will act as a support. There are several scenarios from this important key area:
1) As the price approaches the line of the 38-year uptrend, the price reacts positively and the upward movement continues. The big problem is simply delayed again in time. And the later it happens, the more painful it will be. Fortunately, everyone understands this.
2) Another option, the most reasonable. As in 1970, with repeated testing, we nevertheless break through the 38-year uptrend line, and the price is fixed below it. But instead of moving into a downtrend, the trend goes into lateral movement, forming, as in the 1970s, a side channel of "accumulation of force."
The main thing is that the lateral movement was clearly preserved, without strong punctures and slopes of the side channel trend.
It is important that the crowd saw exactly the accumulations on the chart, and not the attempt of large market and state players to maintain the index at any cost at certain critical values. I showed the channel width, as in the 1970s, about 40%, and the first waves of basic lateral volatility may have already formed in this upward channel. The range may be different, but 40% is optimal for maintaining the trend. No one knows the future, this can be assumed based on history and your trading experience.
3) The saddest and most unpleasant option for the United States and for the stability of the whole world. If there is a breakdown of the uptrend line and the price consolidates below it, a very dangerous situation will arise, as in 1930, which can lead to the beginning of a downtrend. Key levels of price stop, I showed on the chart. Even reducing the index to these values can lead to a complete collapse of the US economy, and of the world economy as a whole. Why is this so I described in detail with examples above in the article. Let's hope that this does not happen.
Learn to predict a more likely future. Always have different options for your work in a given situation. Work according to the basic plan, based on the situation that is being implemented.
_________________________________________________________
My former trading idea is an indicator. Published in April 2019.
A trading idea-indicator gave a signal about a market reversal long before its fall.
The relationship of the Dow Jones and the Fed% rate We are ahead of the financial crisis.
Result. The plateau phase. Reducing the Fed interest rate and raising the price of the index to highs.
Then the index price drops and the Fed rates transition to phase 4.
prntscr.com
The article is extensive and probably very complex will be much to understand. In addition, there is a lot of text in it to convey a thought, unfortunately this scares most people. Many read only headings and look at the price chart. Some people have probably forgotten how to read at all ... Don't be like that. Good luck with trading and understanding everything that happens in the world.
More information in my telegram channel SpartaBTC

DJI potential for a rise! | 9th May 2022On the H4, with price expected to reverse off the ichimoku cloud , we have a bearish bias that price will drop from our 1st resistance at 33193 where the horizontal pullback resistance and 38.2% Fibonacci retracement is to our 1st support at 32422 in line with the pullback support. Alternatively, price may break 1st resistance structure and head for 2nd resistance where the horizontal pullback resistance.
Any opinions, news, research, analyses, prices, other information, or links to third-party sites contained on this website are provided on an "as-is" basis, as general market commentary, and do not constitute investment advice. The market commentary has not been prepared in accordance with legal requirements designed to promote the independence of investment research, and it is therefore not subject to any prohibition on dealing ahead of dissemination. Although this commentary is not produced by an independent source, FXCM takes all sufficient steps to eliminate or prevent any conflicts of interest arising out of the production and dissemination of this communication. The employees of FXCM commit to acting in the clients' best interests and represent their views without misleading, deceiving, or otherwise impairing the clients' ability to make informed investment decisions. For more information about the FXCM's internal organizational and administrative arrangements for the prevention of conflicts, please refer to the Firms' Managing Conflicts Policy. Please ensure that you read and understand our Full Disclaimer and Liability provision concerning the foregoing Information, which can be accessed on the website.
