Dow Jones (DJI) | The best target to climb🔥Hello traders, DJI in daily timeframe , this analysis has been prepared in daily timeframe but has been published for a better view in 2 day timeframe.
According to the count, the main waves 1, 2 and 3 of this process have ended and now we are inside wave 4.
Wave 2 is the main correction shallow and short, so wave 4 is deep and long in terms of price or time.
Given the structure that has been formed so far, it is more likely to be time-consuming.
In the previous analysis, we assumed that the correction was in the form of a triangle or a flat, and said that if the last floor was broken, the type of correction would change again, and the type of correction would have changed to zigzag.
It is probable that wave a is forming from this zigzag, which ends with another descent to the channel ceiling and wave b is formed.
We think that to correct the temporal correction, wave b is a complex correction, and if it moves beyond Fibonacci 0.618, this analysis will be fielded.
Also, if the bottom of the channel is broken down, wave a was longer and wave b is corrected in the form of a pullback to the ceiling of the channel.
🙏If you have an idea that helps me provide a better analysis, I will be happy to write in the comments🙏
❤️Please, support this idea with a like and comment!❤️
Djia

People study trading books for yearsPeople study trading books for years written by notorious corrupt market makers just to fail
Everything is corrupt for which you will see once the veil you have had over your eyes your entire life falls

DOW JONES fractal from China trade war points to a slow recoveryThis chart shows a lot of similarities of the current Ukraine - Russia war and the build up to it, with the 2018 fractal of the U.S. - China trade war.
As this 1D chart illustrates, Dow Jones' build up to the peak of the U.S. - Russia trade war was on a Higher Highs trend-line supported by the 1D MA200 (orange trend-line). Then the index declined rapidly on Lower Lows, forming the bottom just after a Death Cross (crossing of the 1D MA50 below the 1D MA200). It was exactly then that Xi and Trump called a truce at the G20 summit.
At the moment, the Ukraine - Russia war is displayed on those exact same Lower Lows, having broken below the 1D MA200 and with the 1D Death Cross pending (perhaps 1 - 2 days away). Notice how even the MACD fractals are fairly similar. Can the current peach-talks bring an end to the war and a bottom on DJI, the same way Xi and Trump did at G20? This week will certainly shows us.
--------------------------------------------------------------------------------------------------------
** Please support this idea with your likes and comments, it is the best way to keep it relevant and support me. **
--------------------------------------------------------------------------------------------------------

DJIA - Probably a good time to LONGYes my future bias is DOWN, however, in 1929 we had a blow off top and in todays price that impulse blow off top would start from around $32-33k for DJIA. I am thinking we have one more leg up left in the Dow Jones!

Dow Jones DJIIn my POV, Dow has done it's WAVE 5, which is now lead him to a correction wave.
As we could see, there's also a Double TOP pattern supported by Divergence from MACD and RSI indicator.
Now, it's on a retest phase. If it fail to climb, i am looking forward to that area.
Disclaimer ON
"I might be wrong"


US30 playing out 2008 crash's patternBeen looking at the US30 over the past month.
On a weekly chart, we see sort of a head and shoulders, and just completed the final touch on the neckline. This is a repeated price pattern from the 2008 crash as we can see from the bar pattern extract below.
The uncertainty with the Russia-Ukraine conflict will either make or break this? Keen to hear your thoughts.

Dow Jones: Playing the Triangle 🎼Dow Jones has joined an orchestra and is currently making use of our pink triangle. We expect it to play it a little bit longer until the bottom of the orange zone between 33518 and 32614 points, where wave Z in green as well as wave iv in orange should end and give Dow Jones new drive to take off, aiming for the resistance at 35521 points.
Still, there is a 30% chance that Dow Jones could fall though the orange zone and below 32500 points. From there, it should drop further downwards.

Dow Jones Industrial Average - Super Short As shown in the chart below, the Short play I am in is actually just the start of a much longer and drawn out bear market for the Dow Jones Industrial Average

DJ30 - Confirmed SHORT Signal on Hash Ribbons 2 Day The DJ30 (Dow Jones Industrial Average) Now has a Confirmed "SHORT" Signal on Hash Ribbons 2 Day Chart.
As shown in the chart, the last time this happened was in February 2020 when the markets crashed spectacularly. In previous charts I have spoken about the 1929 prop to the great recession and place the bars pattern as an overlay on my chart analysis. You can search for these on my profile. I have heavy on SHORTS right now.

DJI And The 20 Year MACD SupportWe have the Dow Jones Industrial Average Index (DJI) opening red below MA200... Full bearish control.
This is the same signal we looked at on the S&P 500 Index (SPX).
Just like Ethereum, Cardano, Bitcoin, Solana, Polkadot, etc. The SPX, DJI, NDX all move together.
What one does, the rest follows.
Here is the daily MACD for the DJI:
We just lost a 20+ year long support.
This is a very bad signal that tells us of a potentially strong correction to come.
The correction has already started.
What is left is only to know how much lower can it go.
I've mapped multiple support levels on this and previous charts.
Namaste.

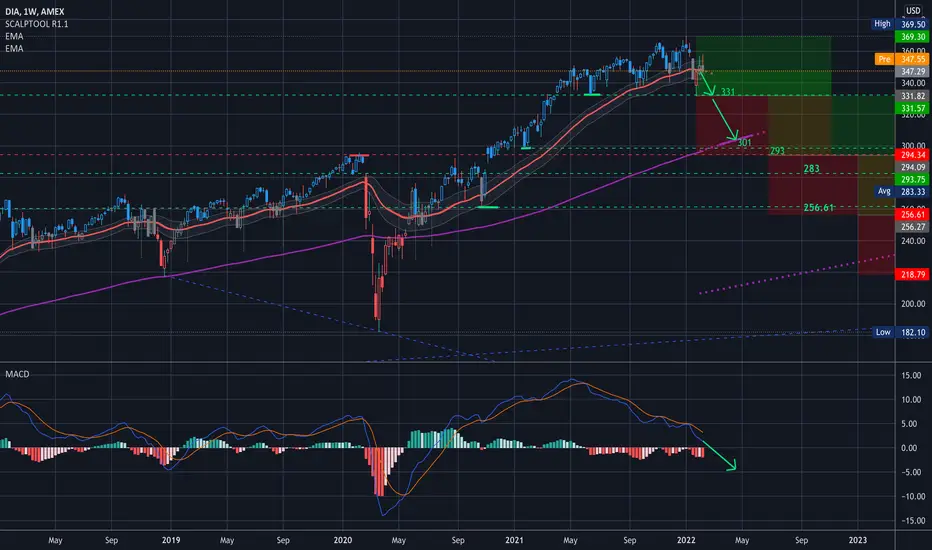
$DIA $DJIA Key Levels, Analysis & Targets$DIA Long View - looking out into mid-year - I added a few targets
What I’m thinking is a possible retest of 331… and if that breaks I’ll be looking to the 293-301 area. (And actually there’s a gap right below that so perhaps targeting that area as well… so 282, 293, and 301 would all be the next buy levels if 331 doesn’t hold
And with this I’m starting to look into Late April/May.
Let me know your thought,
And of course, this is the big picture… there will be lot’s of opportunities in both directions and I'll zoom in on some smaller time-frame plays as they come up, with the bigger move being down.
GL
——————
I am not your financial advisor, but I will happily answer questions and analyze to the best of my ability but ultimately the risk is on you. Check out my ideas, but also do your own due diligence.
I have a huge tolerance for volatility so please know that. If you’re new to my trade setups please try them on a small scale first. Then go in with a risk you’re comfortable with.
I am not a bull. I am not a bear. I just see what I see in the charts and I don’t pay too much attention to the noise in the news.
If you want me to analyze any stock or ETF just leave me a comment and I’ll do it if I can. (If I have time)
And most importantly… Have fun, y’all!!
(\_/)
( •_•)
/ >🚀
Dow Jones (DJI) | The best target to climb🔥Hello traders, DJI in daily timeframe , this analysis has been prepared in daily timeframe but has been published for a better view in 2 day timeframe.
According to the count, the main waves 1, 2 and 3 of this process have ended and we are now inside wave 4.
Wave 2 is the main correction shallow and short, so wave 4 is deep and long in terms of price or time.
Given the structure that has been formed so far, it is more likely to be time-consuming.
Its current structure is similar to a flat, a flat that has no relation and is formed without any rules, and we still assume that this correction has continued in the form of a triangle or in a complex way, and now we have to wait for the ascent for the d or x wave.
If Fibo 0.23 is broken, price correction should be considered for the trend.
🙏If you have an idea that helps me provide a better analysis, I will be happy to write in the comments🙏
❤️Please, support this idea with a like and comment!❤️

Dow Jones Industrial Bearish Bat?Looking at this one day chart it looks to me like DJI is
forming a Bearish Bat Harmonic.
For me, there is a tight PRZ with a .886 D point of a
Bearish Bat Harmonic, a 2.618 ABCD completion and a
2.0 AB ext.
I will be looking for a reversal here, around $37,400.
My whiskers are telling me that we could trend up
until Friday and maybe see a dump by Monday.
The Alternate Bat would be in play if we push
up above this level, so we would not be out of the woods.
What do you think is up next?
Owhooooo!

Dow Jones: The Second Time Around 🎤“ Love is lovelier the second time around… ”, so they say in the Oscar-nominated song “The Second Time Around”. First performed by Bing Crosby in the 1960 musical-movie “High Time”, the song became even more popular when Frank Sinatra added it to his repertoire one year later.
The song’s message might also ring true for Dow Jones as the index tries to climb above the resistance line at 35521 points for the second time. We expect it to make it above this mark soon and to thus affirm further upwards movement. The index should then rise farther, even above 36446 points.
However, as long as Dow Jones has not managed to conquer the resistance at 35521 points, we must not disregard our secondary scenario. There is a 40% chance that the index could fall below 33532 points and head for the bottom of the orange zone between 33518 and 32614 points.

DOW JONES about to complete a handle to new All Time HighDow Jones has bee forming peculiar Cup & Handle (C&H) patterns since June 2021. Every time the price broke above the Handle, new All Time High (ATH) followed. As you see DJI is right now on its 1D MA50 (blue trend-line) and about to break above the latest handle. If it breaks, the formation should target the 1.236 Fibonacci extension by mid March. The time-frame is such because the previous Higher High was formed halfway the red Ichimoku Cloud.
--------------------------------------------------------------------------------------------------------
** Please support this idea with your likes and comments, it is the best way to keep it relevant and support me. **
--------------------------------------------------------------------------------------------------------

Dow Jones (DJI) | Small correction♻️Hello traders, DJI in daily timeframe , this analysis has been prepared in daily timeframe but has been published for a better view in 2 day timeframe.
According to the count, the main waves 1, 2 and 3 of this process have ended and now we are inside wave 4.
Wave 2 is the main correction shallow and short, so wave 4 is deep and long in terms of price or time.
Given the structure that has been formed so far, it is more likely to be time-consuming.
Its current structure is similar to a flat, a flat that has no relation and is formed without any rules
And we still assume that this correction has either continued in the form of a triangle or in a complex way, and now we have to wait for the ascent for the d or x wave.
If Fibo 0.23 is broken, price correction should be considered for the trend.
🙏If you have an idea that helps me provide a better analysis, I will be happy to write in the comments🙏
❤️Please, support this idea with a like and comment!❤️

Bitcoin Undecided and a Look at some Altcoins(0:40) #DXY #Dollar Index - dropping
(1:10) #VIX #Fear #Index - spiking
(2:30) #DJIA
(2:50) #SNP
(3:00) #Nasdaq
(3:10) #QQQ
(3:25) #BTC.D
(3:51) #EthUSD
(4:15) #BTCUSD - Bitcoin is still overall in bullish territory. A drop below our black ascending trendline would cause me to become bearish, if confirmed on the daily. This still has not occurred.
(6:22) #altcoins #agldusd #btrstusd #jasmyusd etc. - All altcoins are depending upon the big dawg at this point, #BTC

DOW JONES The RSI on 1D and 1W signal rally ahead.This is Dow Jones on the 1D time-frame. The price made a bottom just before the 33040 Support of the June 21 2021 Low and is rebounding, about to test the 1D MA200 (orange trend-line) as a Resistance.
Below the chart, I've placed the RSI both on the 1D and 1D time-frames. On 1D, the RSI hit the multi month Support and rebounded and on 1W it hit the bottom of a 5 month Channel Down and rebounded. All these indicate that the market has formed a bottom and is at the early stages of a rally towards the Higher Highs trend-line. My target is just below the 1.236 Fibonacci extension at 37000.
--------------------------------------------------------------------------------------------------------
** Please support this idea with your likes and comments, it is the best way to keep it relevant and support me. **
--------------------------------------------------------------------------------------------------------

DJIA Is Rebounding from The Lower Boundary of The Upward ChannelThe DJIA has been moving in an upward channel since around mid-June 2021. Recently the index formed a long bullish hammer candle that successfully confirmed a significant support area of a rising window/gap at 33,175 (this is called the cluster of candles). All the last week candles closed over the lower boundary of the rising channel and the 0.236 Fibonacci retracement level at 34060 as well as the 251-day EMA. In addition to this, there is a bullish divergence signal from the Williams %R out of the oversold zone. Therefore, the index is moving to test the levels at 35063, 35513 and 36152. In contrast, declining below the levels at 34060 and 33160 should indicate a further bearish move ahead.

Bear Flag City! Will the selling resume on Monday?(2:35) #Dollar #BullFlag
(3:25) #Dow #djia #bearflag
(4:30) #VIX #inversecorrelation
(5:40) #Ethereum
(6:35) #Bitcoin #Dominance
(8:00) #Fibonacci #Retracement
(11:00) My line in the sand

Bitcoin - Ethereum - Altcoins - Another Day, Another Dive?Here's what I am looking at today regarding #bitcoin, #ethereum, the #dollar, our #stockmarket #indexes, and the overall #crypto #markets

Dow Jones (DJI) | Small correction♻️Hello traders, DJI in daily timeframe , this analysis has been prepared in daily timeframe but has been published for a better view in 2 day timeframe.
According to the count, the main waves 1, 2 and 3 of this process have ended and now we are inside wave 4.
Wave 2 has had a shallow and short correction, and accordingly, Wave 4 becomes deep and long in terms of price or time.
Given the structure that has been formed so far, it is more likely to be time-consuming.
Its current structure is similar to a flat, a flat that has no relation and is formed without any rules
And we still assume that this correction has either continued in the form of a triangle or in a complex way, and now we have to wait for the ascent for the d or x wave.
If Fibo 0.23 is broken, price correction should be considered for the trend.
🙏If you have an idea that helps me provide a better analysis, I will be happy to write in the comments🙏
❤️Please, support this idea with a like and comment!❤️
