DOW JONES Last chance to buy before it breaks the 1D MA50.Dow Jones (DJIA) has been trading within a 1.5 year Channel Up pattern since the July 2023 High. The market found itself under heavy pressure recently as the Channel unfolded its Bearish Leg which found Support right below the 1D MA200 (orange trend-line).
As the 1D RSI got oversold (<30.00) and rebounded, this is perhaps the last opportunity to buy low, before it breaks above its 1D MA50 (blue trend-line) on what is technically the new Bullish Leg.
The previous Bullish Leg (November 2023 - March 2024) hit the 2.0 Fibonacci extension on a +23.94% rise, before it broke below its 1D MA50 again. As a result, it is possible for Dow not to break again below its 1D MA50 once broken, before it reaches the 2.0 Fib which sits at 50000. Our Target is a little lower than that at 49000.
-------------------------------------------------------------------------------
** Please LIKE 👍, FOLLOW ✅, SHARE 🙌 and COMMENT ✍ if you enjoy this idea! Also share your ideas and charts in the comments section below! This is best way to keep it relevant, support us, keep the content here free and allow the idea to reach as many people as possible. **
-------------------------------------------------------------------------------
Disclosure: I am part of Trade Nation's Influencer program and receive a monthly fee for using their TradingView charts in my analysis.
💸💸💸💸💸💸
👇 👇 👇 👇 👇 👇
Djia

Looking for a minimum of ES 5850In the days to come our initial pattern off the recent has the high probability to get into the 5850 area.
Here I will be looking for a pullback.
If this pullback can be viewed as corrective in it's structure then I expect the subdivisions and pathway on my ES4Hr chart should follow suit. However, if the pullback turns out to be impulsive, I will be looking for follow through for either Minor B having completed early, or the alternate wave (iv). If that sort of price action were to materialize, it's Friday's low of 5651.25 that must support any drop if we're to continue to subdivide higher and have this minor B take more time.

DOW JONES targeting 50000 on this final Bull yearDow Jones / US30 posted the first green weekly candle after hitting last week the 1week MA50.
This is obviously a critical support level as it has been holding since the October 30th 2023 rebound.
As this chart shows, Dow has been repeating the same patterns, Cycle after Cycle.
Right now it has entered the Final Year of Bull, which is the part where it rises aggressively to form the Top before the new Bear begins in the form of a Megaphone pattern.
The previous Bull peaked on the 2.382 Fibonacci extension of the Megaphone.
This means that a 50000 Target for Dow is perfectly plausible by the end of 2025.
Follow us, like the idea and leave a comment below!!

Will the spring & summer of 2025 conclude our retrace in minor BIn the interest of full disclosure we have not even confirmed our minor A has in fact bottomed...but assuming we have struck a short term bottom, we are now embarking on a minor B wave retrace that I anticipate taking us into the start of summer.
In any respect, I am viewing this as only a counter trend rally with a scary (c) of C of (A) to come into the low SPX 5,000 region eventually. There everything gets decided for the long-term.
Be careful out there.
Chris

DOW JONES: Starting the final stage of 3year Bull Cycle.Dow Jones got oversold on its 1D technical outlook (RSI = 29.297, MACD = -550.130, ADX = 76.606) as it is currently testing its 1W MA50. This is a level that has been intact since November 2023 and is of high importance to the trend as it has a key cyclical attribute. The driving growth pattern of Dow since the 2009 bottom is a Channel Up and every time a Bull Cycle starts, the 1W MA50 is the first level of support, with every touch of it being the strongest buy opportunity. When the 3 year Bull Cycle is coming to an end, the 1W MA50 breaks and the index approaches the 1M MA50 during its Bear Cycle correction, which becomes the ultimate buy entry for the new long term 3 year Bull Cycle.
The current Cycle should starts getting completed technically after September 2025, so there is a high chance that the 1W MA50 holds here. The three Bull Cycles we've had so far had a fairly similar growth percentage, rising by +70.38% to +76.64%. If the +70.38% minimum range is followed on the current (4th) Bull Cycle, then we're aiming at 48,000 (TP) towards the end of the year. The 1M CCI seems to be printing the exact same build up to the Bear Cycle as in the past.
## If you like our free content follow our profile to get more daily ideas. ##
## Comments and likes are greatly appreciated. ##

Bearish Cypher on the Daily DJI?Ruh oh. It's probably not a given considering the flip floppy nature of the Trumpian markets, where every move hinges on his every word, but my whiskers are twitchin'. That's usually not good.
What do you think?
Owhooooo!

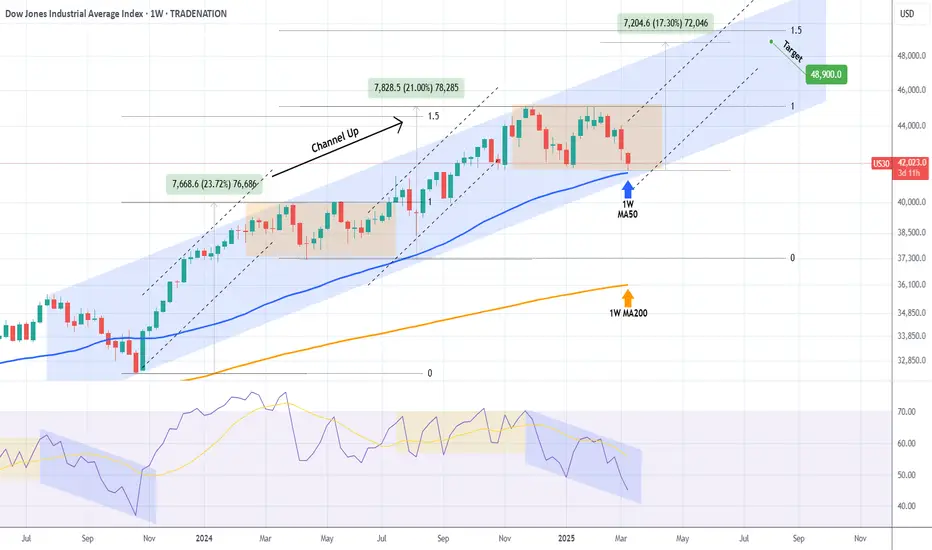
DOW JONES Can the 1W MA50 hold and spark an end-of-year rally?Dow Jones (DJIA) has been trading within a Channel Up pattern since the late July 2023 High. The decline of the last 30 days can be technically seen as the Bearish Leg that will price its new Higher Low bottom.
The price isn't only close to the Channel's bottom but also the 1W MA50 (blue trend-line), a level that has been supporting since the October 30 2023 bullish break-out. As a result, a 1W MA50 hit will be a potential double support test, with the 1W RSI also printing a Bearish Leg similar to the one that led to the October 2023 bottom.
On the other hand, the ranged price action since the late November 2024 High, resembles the sideways volatility of the first half of 2024. Both were initiated after Higher High pricings at the top of the Channel Up. The rallies that led to those tops have been +21.00% and +23.72% respectively.
If there is a decreasing rate on each Bullish Leg, then the new one should be +17.30% (i.e. -3.30% less than the previous one), which falls marginally below the 1.5 Fibonacci extension, which is where the November 2024 High was priced.
As a result, as long as Dow is closing its 1W candles above the 1W MA50, the 2-year Channel Up is more likely to push upwards again for its new Bullish Leg, potentially targeting 48900 (+17.30%).
-------------------------------------------------------------------------------
** Please LIKE 👍, FOLLOW ✅, SHARE 🙌 and COMMENT ✍ if you enjoy this idea! Also share your ideas and charts in the comments section below! This is best way to keep it relevant, support us, keep the content here free and allow the idea to reach as many people as possible. **
-------------------------------------------------------------------------------
Disclosure: I am part of Trade Nation's Influencer program and receive a monthly fee for using their TradingView charts in my analysis.
💸💸💸💸💸💸
👇 👇 👇 👇 👇 👇
Validation of a long term top in the SPX continues to playballLast week I posted an update on my SPX cash index analysis...found below.
At the end of last week, we see where the price action has been filling in nicely as of Friday. Some key take-a-ways. First, is the price action has breached the area that I am counting as the wave 4 of one lesser degree. This would be an initial clue that the bull market pattern that started back in August of last year is cracking. This would be the area that I am counting as the intermediate wave (4). I am forecasting this recent price action down is the Minor A wave of the beginning of a stair stepped decline that has a high probability of coming back into that area of the August 2024 lows after we retrace higher in a minor B wave, labeled in Red.
What's important about price coming back into this area of approximately 5121-4950 is this the area that price could hold and manage a higher high, essentially meaning that my count is off by one degree...and what I am counting as a wave (III) super-cycle top will get pushed out to end of 2025-2026. However, to breach this area even incrementally, would provide much the same clues we're getting now, about price breaching the minor wave 4 of one lesser degree.
Below this must hold area, is where my forecast of a super-cycle wave (III) gets confirmation...until then we look for clues of validation...but confirmation does not come until price cane breach this area. To breach this area would reflect in price action that resembles the below.

DOW JONES MA200 (1d) test on the Channel Up bottom. BULLISH.Dow Jones is trading inside a Channel Up but lately finds itself on a pull back.
This pull back is about to test the MA200 (1d) at the bottom of the pattern.
The MA200 (1d) has been holding as Support since November 3rd 2023, so overall that makes it a buy opportunity.
Trading Plan:
1. Buy on the current market price.
Targets:
1. 46400 (the 1.382 Fibonacci extension).
Tips:
1. The RSI (1d) is almost oversold and at 35.00 it has turned sideways. Every time the RSI was on this level or belowsince October 2023, it was the best buy opportunity.
Please like, follow and comment!!

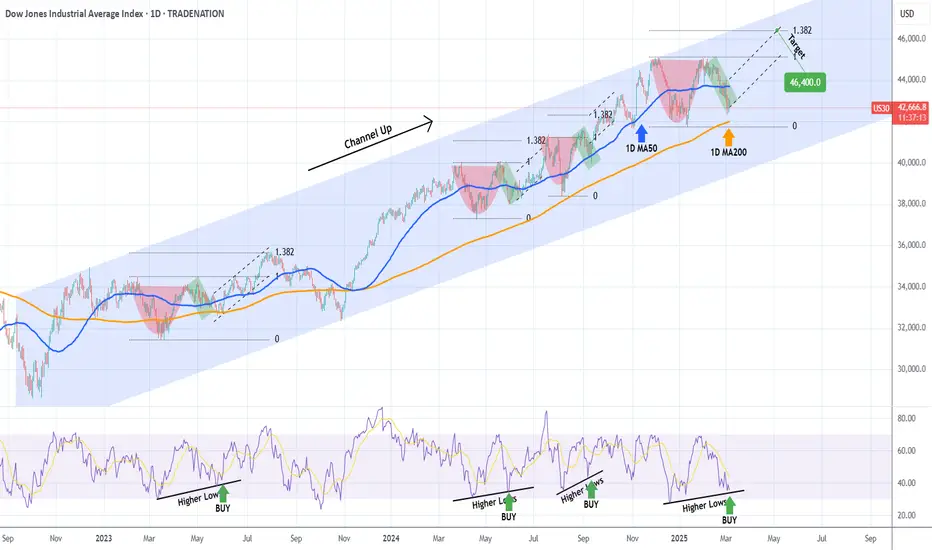
DOW JONES Massive 1D MA200 reversal for Cup and Handle?Dow Jones (DJIA) has been trading within a Channel Up since the September 2022 market bottom. Throughout this long-term structure, Cup and Handle (C&H) patterns have emerged that were always contained above the 1D MA200 (orange trend-line) and subsequently initiated a rebound to at least the 1.382 Fibonacci extension before the next pull-back.
The 1D MA200 is right below us at the moment and the current C&H seems to be on the verge of completing its Handle. Moreover, the 1D RSI is on its usual Higher Lows trend-line that prompts to a the most optimal buy entry. We're bullish, targeting 46400 (the 1.382 Fibonacci extension).
-------------------------------------------------------------------------------
** Please LIKE 👍, FOLLOW ✅, SHARE 🙌 and COMMENT ✍ if you enjoy this idea! Also share your ideas and charts in the comments section below! This is best way to keep it relevant, support us, keep the content here free and allow the idea to reach as many people as possible. **
-------------------------------------------------------------------------------
Disclosure: I am part of Trade Nation's Influencer program and receive a monthly fee for using their TradingView charts in my analysis.
💸💸💸💸💸💸
👇 👇 👇 👇 👇 👇
Dow Jones: Neutrality Strengthens Around 44,000 PointsThe Dow Jones Industrial Average has fluctuated within a 1% range over the past few trading sessions, encountering a neutral barrier near the 44,000-point zone.
For now, investors remain cautious as uncertainty grows amid trade and diplomatic tensions from the White House with multiple countries. This prolonged uncertainty has reinforced a neutral bias in recent price movements.
Persistent Neutrality
Currently, the Dow Jones remains trapped in a sideways range, with:
45,000 resistance at the upper boundary.
42,300 support at the lower boundary.
The price remains in the middle of this range, reinforcing the market’s indecision. As long as price action stays within this zone, the neutral structure may extend further in the coming sessions.
MACD Indicator
MACD movements confirm the current neutral market outlook. Both the MACD line and signal line remain oscillating near the 0 neutral zone.
The histogram also remains close to 0, indicating low momentum. As long as these conditions persist, price neutrality is likely to continue in the coming sessions.
Key Levels to Watch:
45,000 – Key Resistance:
Upper boundary of the sideways range.
A breakout above this level could mark new highs, potentially reviving the long-term uptrend that has been stagnant in recent weeks.
43,000 – Neutral Zone:
Converges with the 50-period and 100-period moving averages.
Also aligns with the 38.2% Fibonacci retracement level.
The most important short-term barrier that could limit any short-term bullish attempt.
If price fails to reclaim this level, bearish momentum could grow.
42,000 – Critical Support:
Lower boundary of the sideways channel. A break below this level could create a stronger bearish bias, potentially threatening the long-term uptrend that has been in place since last year.
By Julian Pineda, CFA – Market Analyst

DOW JONES Cup and Handle completed and eyes a new ATH.Dow Jones (DJIA) has been trading within a Channel Up since the October 2022 market bottom of the Inflation Crisis. Inside this pattern, four Cup and Handle (C&H) formations have occurred with the most recent one, about to complete its Handle this week.
All such C&H patterns, rebounded to at least the 1.382 Fibonacci extension before the next pull-back. As a result, our Target before May remains 46400.
-------------------------------------------------------------------------------
** Please LIKE 👍, FOLLOW ✅, SHARE 🙌 and COMMENT ✍ if you enjoy this idea! Also share your ideas and charts in the comments section below! This is best way to keep it relevant, support us, keep the content here free and allow the idea to reach as many people as possible. **
-------------------------------------------------------------------------------
💸💸💸💸💸💸
👇 👇 👇 👇 👇 👇

DOW JONES Bull Flag completed. Massive rally ahead.Dow Jones / US30 has completed a Channel Down on the 0.5 Fibonacci retracement level.
This pattern is nothing more than a Bull Flag based on September's similar structure that also hit the 0.5 Fib and 1day MA50 and bottomed.
This time, the 1day RSI is also on a Rising Support.
Both corrections took place after a +8.15% rise and September's then went on to rebound to the 1.5 Fib extension.
Buy and target 46700.
Follow us, like the idea and leave a comment below!!

Dow Jones D1 | Overlap support at 50% Fibonacci retracementDow Jones (US30) is trading close to an overlap support and could potentially bounce off this level to climb higher.
Buy entry is at 43,330.55 which is an overlap support that aligns with the 50.0% Fibonacci retracement.
Stop loss is at 42,800.00 which is a level that lies underneath a pullback support and the 61.8% Fibonacci retracement.
Take profit is at 44,325.14 which is an overlap resistance that aligns with the 61.8% Fibonacci retracement.
High Risk Investment Warning
Trading Forex/CFDs on margin carries a high level of risk and may not be suitable for all investors. Leverage can work against you.
Stratos Markets Limited (www.fxcm.com):
CFDs are complex instruments and come with a high risk of losing money rapidly due to leverage. 63% of retail investor accounts lose money when trading CFDs with this provider. You should consider whether you understand how CFDs work and whether you can afford to take the high risk of losing your money.
Stratos Europe Ltd (www.fxcm.com):
CFDs are complex instruments and come with a high risk of losing money rapidly due to leverage. 63% of retail investor accounts lose money when trading CFDs with this provider. You should consider whether you understand how CFDs work and whether you can afford to take the high risk of losing your money.
Stratos Trading Pty. Limited (www.fxcm.com):
Trading FX/CFDs carries significant risks. FXCM AU (AFSL 309763), please read the Financial Services Guide, Product Disclosure Statement, Target Market Determination and Terms of Business at www.fxcm.com
Stratos Global LLC (www.fxcm.com):
Losses can exceed deposits.
Please be advised that the information presented on TradingView is provided to FXCM (‘Company’, ‘we’) by a third-party provider (‘TFA Global Pte Ltd’). Please be reminded that you are solely responsible for the trading decisions on your account. There is a very high degree of risk involved in trading. Any information and/or content is intended entirely for research, educational and informational purposes only and does not constitute investment or consultation advice or investment strategy. The information is not tailored to the investment needs of any specific person and therefore does not involve a consideration of any of the investment objectives, financial situation or needs of any viewer that may receive it. Kindly also note that past performance is not a reliable indicator of future results. Actual results may differ materially from those anticipated in forward-looking or past performance statements. We assume no liability as to the accuracy or completeness of any of the information and/or content provided herein and the Company cannot be held responsible for any omission, mistake nor for any loss or damage including without limitation to any loss of profit which may arise from reliance on any information supplied by TFA Global Pte Ltd.
The speaker(s) is neither an employee, agent nor representative of FXCM and is therefore acting independently. The opinions given are their own, constitute general market commentary, and do not constitute the opinion or advice of FXCM or any form of personal or investment advice. FXCM neither endorses nor guarantees offerings of third-party speakers, nor is FXCM responsible for the content, veracity or opinions of third-party speakers, presenters or participants.

DOW JONES Rectangle bottom formed. Bullish.Dow Jones hit today its MA200 (4h) and rebounded.
This has come too close to the bottom of the Rectangle pattern that dominates the price action in the past 3 weeks.
Trading Plan:
1. Buy on the current market price.
2. Buy again if the price closes above the Falling Resistance.
Targets:
1. 44450 (MA50 4h and Falling Resistance).
2. 45000 (top of Rectangle).
Tips:
1. The RSI (4h) got oversold and rebounded like on the February 3rd Low. Strong buy signal.
Please like, follow and comment!!

DOW JONES 1D MA50 supporting huge Inverse H&S push!Dow Jones (DJIA) has been trading within a Channel Up for the past 15 months. The pattern that could be the strongest driving force however in the coming weeks is an Inverse Head and Shoulders (IH&S), which is about to complete its Right Shoulder.
As you can see this is being strongly supported by the 1D MA50 (blue trend-line) in the past 30 days and every such IH&S pattern in the last 2 years broke to the upside and hit at least its 1.382 Fibonacci extension.
The 1D RSI sequences between those IH&S fractals are identical and the current RSI Bearish Divergence matches perfectly all previous Right Shoulder formations that preceded the 1.382 Fib push.
As a result, a 46400 Target would be an ideal technical Higher High for the Channel Up.
-------------------------------------------------------------------------------
** Please LIKE 👍, FOLLOW ✅, SHARE 🙌 and COMMENT ✍ if you enjoy this idea! Also share your ideas and charts in the comments section below! This is best way to keep it relevant, support us, keep the content here free and allow the idea to reach as many people as possible. **
-------------------------------------------------------------------------------
Disclosure: I am part of Trade Nation's Influencer program and receive a monthly fee for using their TradingView charts in my analysis.
💸💸💸💸💸💸
👇 👇 👇 👇 👇 👇

DOW JONES: Triangle about to break out.Dow Jones is neutral on its 1D technical outlook (RSI = 53.474, MACD = 190.020, ADX = 26.060) as it is trading inside a Triangle pattern, sideways around the 4H MA50. A crossing over the R1 level will be a long aiming at the 2.0 Fibonacci extension (TP1 = 48,000), while a crossing under the S1 level will be a short aiming at Fib 0.0 (TP = 42,000).
## If you like our free content follow our profile to get more daily ideas. ##
## Comments and likes are greatly appreciated. ##

DOW JONES One last drop below the 1D MA50 is possibleDow Jones (DJIA) has found itself in an uncomfortable spot as it's been trading sideways within the 1D MA50 (blue trend-line) and Resistance 1 of the December 2024 High, for the past two weeks.
The 1D RSI has already started trending downwards on a Bearish Divergence while the 1D MACD just completed a Bearish Cross. The times we've seen all those conditions fulfilled within the 2-year Channel Up, are in mid-May 2024 and early May 2023.
On both occasions, the price got rejected on Resistance 1 and pulled back below the 1D MA50 to form a Higher Low. After the 1D MACD formed a Bullish Cross, the price confirmed a technical reversal and targeted the 1.5 Fibonacci extension before the next pull-back.
As a result, you might want to keep a buy order waiting for a sub-MA50 drop and buy once a MACD Bullish Cross is formed to target 46500 (Fib 1.5 ext).
-------------------------------------------------------------------------------
** Please LIKE 👍, FOLLOW ✅, SHARE 🙌 and COMMENT ✍ if you enjoy this idea! Also share your ideas and charts in the comments section below! This is best way to keep it relevant, support us, keep the content here free and allow the idea to reach as many people as possible. **
-------------------------------------------------------------------------------
💸💸💸💸💸💸
👇 👇 👇 👇 👇 👇

DOW JONES: Necessary correction to lated target 46,600.Dow Jones is neutral on its 1D technical outlook (RSI = 53.301, MACD = 170.540, ADX = 30.319) as it is trading sideways on top of the 1D MA50 for the past 2 weeks. The long term pattern is a Channel Up that every time it rebounded on a HL bottom and hit the R1, it always pulled back again to test the 1D MA50. Consequently, this is a necessary technical correction that will allow the index to attract enough buying momentum again to go after a new HH. Aim for a minimum +8.41% increase (TP = 46,600).
## If you like our free content follow our profile to get more daily ideas. ##
## Comments and likes are greatly appreciated. ##

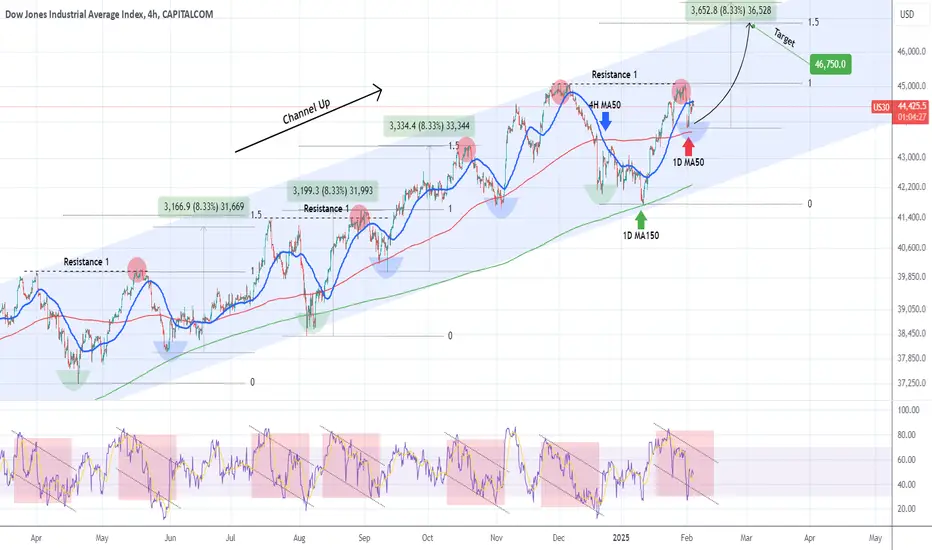
DOW JONES Can the 1D MA50 save the day once more?Dow Jones (DJIA) has been trading within a year long Channel Up and this week's pull-back has so far found Support just above the 1D MA50 (red trend-line). As this chart shows, every 1D MA50 contact that was made after a Channel Up bottom (Higher Low), was a buy opportunity as the blue arc patterns highlight.
The green arcs are the Channel bottoms and technically the strongest buy opportunities and in the past 10 months we've only had 3 of those. This is the 4th blue arc however, the medium-term buy opportunity.
Regardless of colour, the 4H RSI pattern on each of those buy opportunities, has been the same. And the resulting rally has either hit the 1.5 Fibonacci extension or made a +8.33% rise.
This time the 1.5 Fib is a bit closer to the price, so that will be our medium-term Target at 46750.
-------------------------------------------------------------------------------
** Please LIKE 👍, FOLLOW ✅, SHARE 🙌 and COMMENT ✍ if you enjoy this idea! Also share your ideas and charts in the comments section below! This is best way to keep it relevant, support us, keep the content here free and allow the idea to reach as many people as possible. **
-------------------------------------------------------------------------------
💸💸💸💸💸💸
👇 👇 👇 👇 👇 👇
DOW JONES: Buy signal above the 4month RectangleDow Jones just turned bullish on its 1D technical outlook (RSI = 56.676, MACD = 255.440, ADX = 30.051) as it hit the 4H MA50 after an instant rebound on the 4H MA100 inside the same session. This is a strong bullish reversal but the buy signal will be validated if the price crosses over the 4month Rectangle pattern. The rally from its January 13th bottom has been with a significant correction until Friday's and today so far and according to the November rally which was two-fold, if this is the start of the 2nd bullish stage, it should be -1.70% weaker than the first. This implies that from today's low we should rise by +6.30%. This gives us a TP = 46,550 but in order to overcome the bearish pressure of the Rectangle, we will buy only if then price crosses over it.
See how our prior idea has worked out:
## If you like our free content follow our profile to get more daily ideas. ##
## Comments and likes are greatly appreciated. ##

Tariffs, tariffs and more tariffs... What's next for the Dow?It seems like we are stepping into Tariff Wars 2.0, with the announcement of the tariffs on Canada, Mexico and China. But is the outlook really that bad? Let's take a look at the MARKETSCOM:US30 scenario.
TVC:DJI
74.2% of retail investor accounts lose money when trading CFDs with this provider. You should consider whether you understand how CFDs work and whether you can afford to take the high risk of losing your money. Past performance is not necessarily indicative of future results. The value of investments may fall as well as rise and the investor may not get back the amount initially invested. This content is not intended for nor applicable to residents of the UK. Cryptocurrency CFDs and spread bets are restricted in the UK for all retail clients.

DowJones Trade ideaAfter a selloff last Friday and today a huge gap at the open, my bias will be based on the price action. Since the price is inside the consolidation phase, I will be waiting for a break on either side to plan a trade, as marked up in the chart.
