USOILThat's a bottom for me on crude, possible downside to $58 as daily stoch rsi looks overbought but the bulls can easily keep the LTF overbought long enough to make a stronger push back up to ATH, then allow for a higher high on the LTF b4 finally capitulating up to the W5 1.618 fib extension target $108.
Djia

DJIA Recovery PatternThe Green price level line represents the top of the macro range previous to the most recent all time highs.
My bias is that price action took a sharp plunge from Nov 8 - the beginning of December... Price quickly regained strength and bought back previous losses.
If price finds strong resistance above the previous all time range the tells me that price is strong, or at least holding near the most recent all time highs...
With the holiday season approaching, this makes me believe that the DJIA will break all time highs before the new year more than likely.
just a thought

#DXY providing the clues...a 4-5% potential move in the dollar
is an extremely large move in the FX markets
dollar milkshake theory.
As dollars return "home" it causes massive disruptions in most risk on assets & weaker currencies.
A stronger dollar would allow policy makers more room to print ironically.

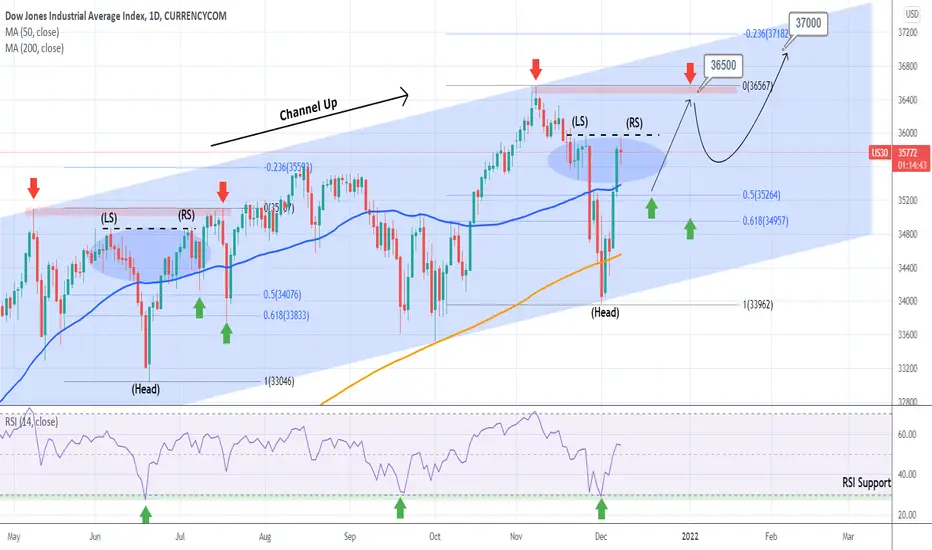
DOW JONES may give more buy opportunities on this patternThis is an update to my most recent Dow Jones idea that gave the buy signal on the bottom of the Channel Up a week ago:
The index has been rallying aggressively since then and now faces the first important Resistance (black dashed line). This may be an Inverse Head and Shoulders pattern similar to the June one. That has given two buy opportunities on the 1D MA50 (blue trend-line)/ 0.5 Fibonacci retracement level and the 0.618 Fibonacci retracement level before the final rally of that phase towards the 0.236 Fibonacci extension.
If you didn't catch the bottom buy already, be on the look out for those potential buy opportunities.
--------------------------------------------------------------------------------------------------------
** Please support this idea with your likes and comments, it is the best way to keep it relevant and support me. **
--------------------------------------------------------------------------------------------------------
The "TLT" Bonds (Updated)Auctions have been releasing offering higher rates as of late. Our previous target of 61% retracement has been rejected so far. On the 1 hour, the previous high was broken with no new lows being made. On the 15 min we are at a light support. I would like to see a stronger support, however, due to recent auctions and higher yields, I could see more bonds being bought soon even with the Fed tapering. Let's see what happens. Yields normally fall when the price of bonds rise. This could be bullish for investors.

The "VIX"The Vix has reached the 61% target retracement. On the 1 hour timeframe, a new low has been made even with the previous high being broken. The 15 min looks the same. We could be running out of gas soon. However, let's see if the 88% retracement is the next level! We are fighting the 200 ema right now. Let's hope for a push down to around $16. Since July, price seems to like this area. This would be an 88% retracement and would be bullish for the market! I want the Santa Rally!

Stock Market Review - Underwhelmed - Still Bearish - No ChangeIn this video:
* We must review the stock market indexes and sentiment in order to accurately gauge our crypto space
* Overall, nothing has changed. Still bearish!
UPDATE: Apparently, TradingView is still having video issues. Subscribe to my substack below to view the video there or any of my other social media accounts.
- Stewdamus

Dow Jones DJIA Dow Jones #DJI is bouncing of the 200 DMA after Doji reversal candle.
Exit or reduce short positions!
Disclaimer!
I´m not a financial adviser. For educational purpose only!
You can use the information from the post to make your own trading decisions.
Trading is risky, and it is not suitable for everyone. Only you can be responsible for your trading.

Dow Jones (DJIA) | Best point for sellHello traders, FTSE 100 (UKX) in daily timeframe , this analysis has been prepared in daily timeframe but has been published for a better view in 2 day timeframe.
According to the count made in this index, waves 1, 2 and 3 are formed and are now at the beginning of wave 4.
Depending on the shape of wave 2, wave 4 will probably move deep, at least to 0.5 fibo, and will lengthen over time, and it can be said that wave 4 will be a flat.
The first movement of the flat to the pink line is formed after the confirmation and failure of the red circle.
🙏If you have an idea that helps me provide a better analysis, I will be happy to write in the comments🙏
❤️Please, support this idea with a like and comment!❤️

The DJIA is at Risk of Losing a KEY LevelThe DIA is at risk of losing a key level relative to QQQ performance. A decisive close below the red box could signal further underperformance.

Dow Jones: Lowwwww!❎❎❎For a moment, the Dow looked like it was serious about rising again. However with the current movement, the course is developing in our predicted direction. We expect the course to turn around at 33518 points and surge again. An alternative breakout has a probability of 35%.
Happy weekend!

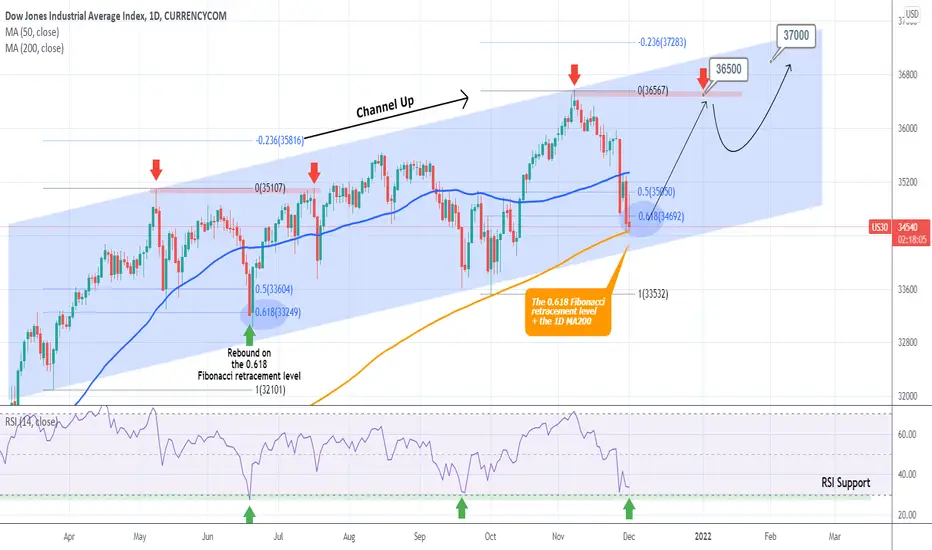
DOW JONES Buy opportunity on the 1D MA200 and 0.618 FibPattern: Channel Up on 1D.
Signal: Buy as the price reached both the 0.618 Fibonacci retracement level as well as the 1D MA200 (orange trend-line). The last parameter to fulfil is the RSI Support, so allow margin for one last low at the bottom of the Channel Up.
Target: 36500 (Resistance and All Time High) and 37000 in extension (Higher High of the Channel Up).
--------------------------------------------------------------------------------------------------------
** Please support this idea with your likes and comments, it is the best way to keep it relevant and support me. **
--------------------------------------------------------------------------------------------------------
DOW JONES OVERSOLD- BUY 34500 TP 35500 one monthBroad market rally are coming soon with EURO rebound confirmed and USD index starts to weakened.
STOCK MARKET are pretty CHEAP right now so its time to get back into the market.
OIL PRICE ALSO looking to rebound anytime soon.
----
This is my own opinion and not Financial Advice,
Do your own Research.
Ex. Bond Dealer

DOW JONES approaching the 1D MA50Following the new top on the Higher Highs trend-line of the multi-month Channel Up, the index got rejected and has been pulling back since. It is approaching the 1D MA50 (blue trend-line) which serves as a technical medium-term Support. If it holds then I expect a strong rally towards the 0.236 Fibonacci extension setting a personal target at 37000. See how the 1D RSI is also near its multi-month Symmetrical Support.
--------------------------------------------------------------------------------------------------------
** Please support this idea with your likes and comments, it is the best way to keep it relevant and support me. **
--------------------------------------------------------------------------------------------------------

Future DJI Top - Great Depression cycle overlayStripped the chart down to the 2009-2021 current bull market fibs, and the Great Depression bottom to future top fibs, with an overlay of the DJI chart leading up to the great depression in 1929, with some very stark similarities (outside of covid, and the pullback im expecting here, though we got ahead of the great depression cycle both times to warrant a pullback). Again, I know im getting way ahead of myself here, but these fibs line up too damn well for me to hide these charts in private.. so if this plays out, you heard it here first.

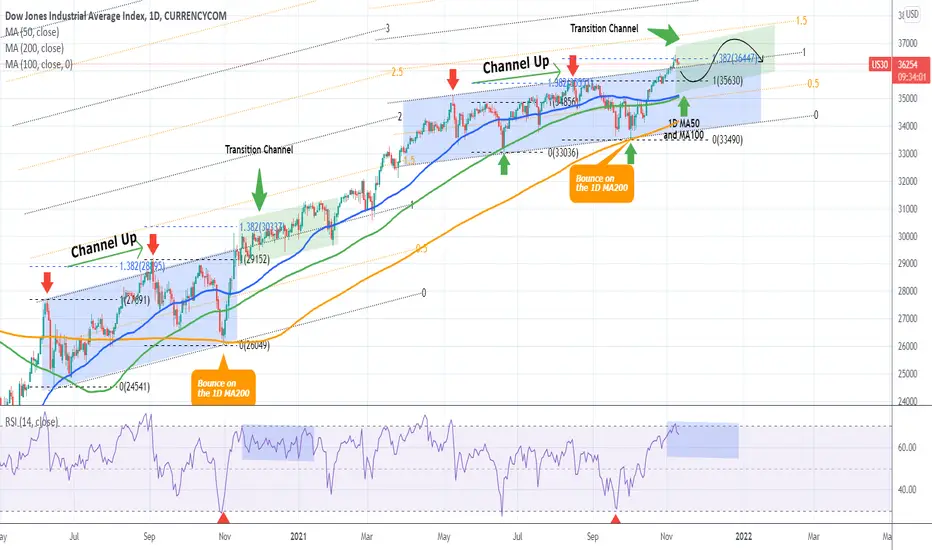
DOW JONES entering a transition Channel as in late 2020.This is not the first time I bring forward the ideal of Dow Jones following this 2020 fractal:
As you see from my October 01 idea above, this fractal comparison accurately projected the bottom of the Channel Up (blue) and the subsequent rally that followed. This time I am expanding this idea on the Fibonacci scale, as DJI broke above the Channel Up and hit the 1.382 Fibonacci extension from the bottom.
On November 09 2020, the price also broke above its Channel Up (blue), hit the 1.382 Fib extension and then entered a new (green) Channel Up, which I call transitional as it took the index from the first Channel Up (blue) towards the higher extension levels of the Fibonacci Channel in early 2021.
During that time the RSI (always on the 1D time-frame) turned sideways, indicating this Transition phase more clearly. I am expecting a similar process until the end of the year, meaning a pull-back towards the 1D MA50 (blue trend-line) is possible but as long as it supports, we are more likely to see prices above 37000 at the end of the year.
--------------------------------------------------------------------------------------------------------
Please like, subscribe and share your ideas and charts with the community!
--------------------------------------------------------------------------------------------------------
Am I Crazy to Expect DJIA to Drop by 8000 points Long Term?Markets are strong and the outlook currently is very bullish. So anyone who thinks that markts will drop significantly in the mid to long term would be laughed at right?
But i just cant help but notice that markets are way too high at the moment. everything seems pretty over valued - although market analysts will say the valuations are just about at the right level if not still low.
Could all these excellent company earnings be transitory, thus skewing the markets?
or perhaps theres something more to come, such as another wave of teh pandemic that could pull the markets down.
Whilst we are yet to see what it could be... my better judgement of technical alalysis tells me we could see a big correction in the markets over the long term.
Im aiming for around 26,000 for teh DJIA. Time will tell.

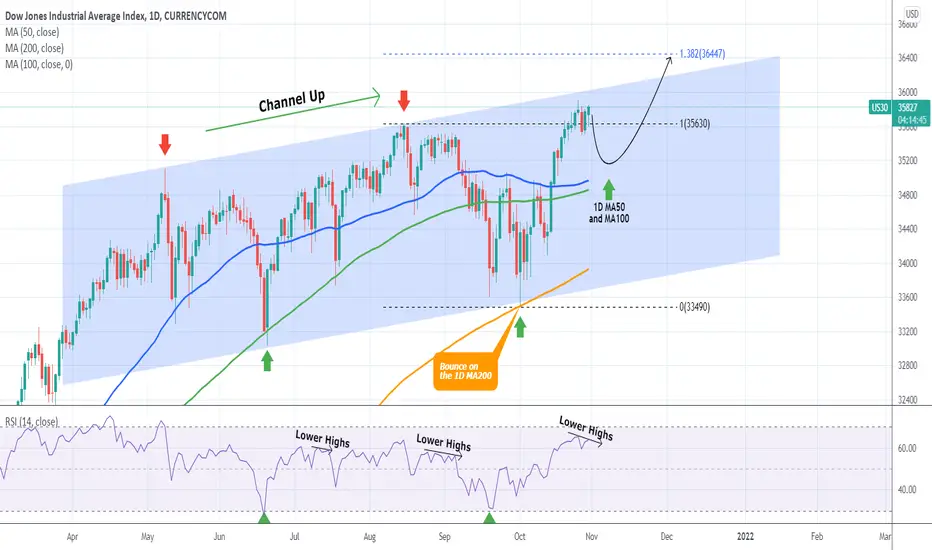
DOW JONES Top of the Channel Up. Pull-back possible.It's been a while since I updated my Dow Jones thesis. The most recent one (Oct 13) was on the short-term 4H time-frame, where I identified a buy signal on this Inverse Head and Shoulders pattern:
The longer-term one though was last updated on October 1 and this is where I come back to today as well:
As you see, the bounce on the 1D MA200 gave a perfect bottom buy signal and the 35900 target has been achieved. Even though the long-term target is the 1.382 Fibonacci extension (36,450), the price is trading very close to the Channel Up with the 1D RSI on Lower Highs. This RSI formation has been recently seen on tops with the price correcting afterwards to the 1D MA50 (blue trend-line) and the 1D MA100 (green trend-line). On this index, it is best to wait for such contact before targeting the eventual 1.382 Fib extension.
--------------------------------------------------------------------------------------------------------
Please like, subscribe and share your ideas and charts with the community!
--------------------------------------------------------------------------------------------------------
Forecast: DJIA 10/21/21I will be looking to scalp more on the bullish rallies as to continue with the past previous days.

Dow Jones: Good Boy! 🐶🐶🐶The Dow Jones has been a very good boy ever since the low of the yellow wave 2. Currently, the surge should continue until somewhere around 35822 points. After completing a small correction, we expect the course to increase once again.
Push it to the limit!

US Indices Weekly Analysis | Oct 18, 2021Bullish momentum returns to the US market! S&P500 breaking resistance last week with relative ease. Can this momentum continue?

DOW JONES Buy SignalPattern: Inverse Head and Shoulders on 4H.
Signal: Buy as the price is close to completing the Right Shoulder and is on the 0.382 Fibonacci retracement level.
Target: 34700 which is the 0.786 Fibonacci retracement level just below the Lower Highs trend-line.
--------------------------------------------------------------------------------------------------------
** Please support this idea with your likes and comments, it is the best way to keep it relevant and support me. **
--------------------------------------------------------------------------------------------------------

$VIX - Key Levels and Analysis - Another View - Daily Timeframe$VIX - Key Levels and Analysis - Another View - Daily Timeframe
—————
I posted a VIX study earlier today on the 1W timeframe (it’s the post directly before this)
Now bringing it down to the Daily chart - another bearish MA crossover. Always a deep spike when these averages cross. YIKES…
I hate being THIS bearish… but I do not think is is good.
Trade carefully guys. I personally love volatility, but just know your limits - it could get bumpy
——————
I am not your financial advisor, but I will happily answer questions and analyze to the best of my ability but ultimately the risk is on you.
My average is in Grey
Red = Resistance
Green = Support
Blue = trendlines
If you want me to analyze any stock or ETF just leave me a comment and I’ll do it if I can.
Have fun, y’all!!
