DJIA (Wall Street) sees its worst month of the year – where to nThe Dow Jones Industrial Average (DJIA / Wall Street) finished the month of September trading down -4.3%, its largest 1-month decline of the year and more than twice the -2.0% drop that it saw in January.
So where does that leave the most popular US index?
In a word: Adrift .
After rising consistently from last November through this September, the Dow has now fallen out of its 10-month bullish channel. In fact, despite unprecedented levels fiscal and monetary stimulus from US policymakers, the index is now unchanged since mid-April.
Moving forward, the most relevant technical structure to watch will be the sideways range between support near 33,700 and resistance up at 35,500. Though the current technical view bias is neutral, a break below the bottom of this rectangle and the rising 200-day EMA near 33,250 would open the door for a deeper retracement 31,000 or even 30,000 next, while a bullish breakout above 35,500 would signal the resumption of the longer-term uptrend.
Djia

DOW JONES hit 1DMA200 for the 1st time since the US elections!Dow Jones is trading within a Channel Up that reached today its Higher Lows trend-line (bottom). But perhaps the most important development is that in doing so, it hit the 1D MA200 (orange trend-line) for the first time since October 30 2020 (the U.S. elections)! That alone is a strong buy signal itself but consider also the following:
* The RSI bounced on the 30.000 level on September 20 which has marked price bottoms on June 18 2021, October 29 2020 (in the post COVID crash era). Also it has been rising since on Higher Lows.
* The pattern resembles the June - October 2020 Channel Up. The price hit the 1D MA50 (blue trend-line), 1D MA100 and 1D MA200 in the same order and manner.
Based on the Fibonacci extension model, I am setting a target at 35900 by late October - early November.
** Please support this idea with your likes and comments, it is the best way to keep it relevant and support me. **
--------------------------------------------------------------------------------------------------------
!! Donations via TradingView coins also help me a great deal at posting more free trading content and signals here !!
🎉 👍 Shout-out to TradingShot's 💰 top TradingView Coin donor 💰 this week ==> Vergnes
--------------------------------------------------------------------------------------------------------

Dow Jones: Good Boy! 😎😎😎Who is a good boy? The Dow Jones is! Here, the top was perfectly hit and the following correction also evolves as planned – so far. We expect the course to drop below 34034 points and then attack new all-time highs.
Let’s gooooo!

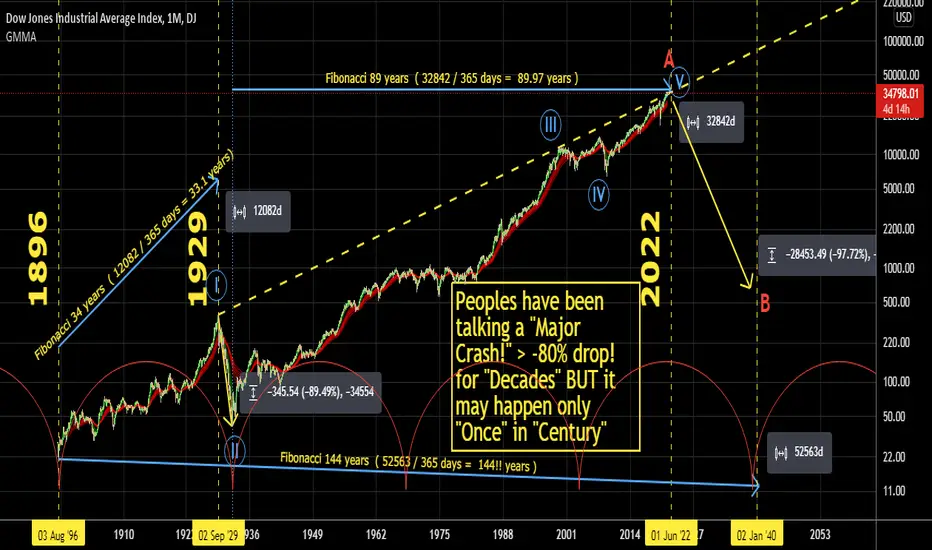
DJI. Fibonacci Years and When "Market Crash!? > -50%" ? 26/9/21People have been talking about "Major Stock Crash!" " 50% even 80% ! drop" for many decades. BUT it may happen ONLY "Once" in "Century"...Maybe 2022?!
LCIDlooks like more of the same here. Zig Zag & Flat corrections until some Catalyst presents itself and LCID will pick a new direction

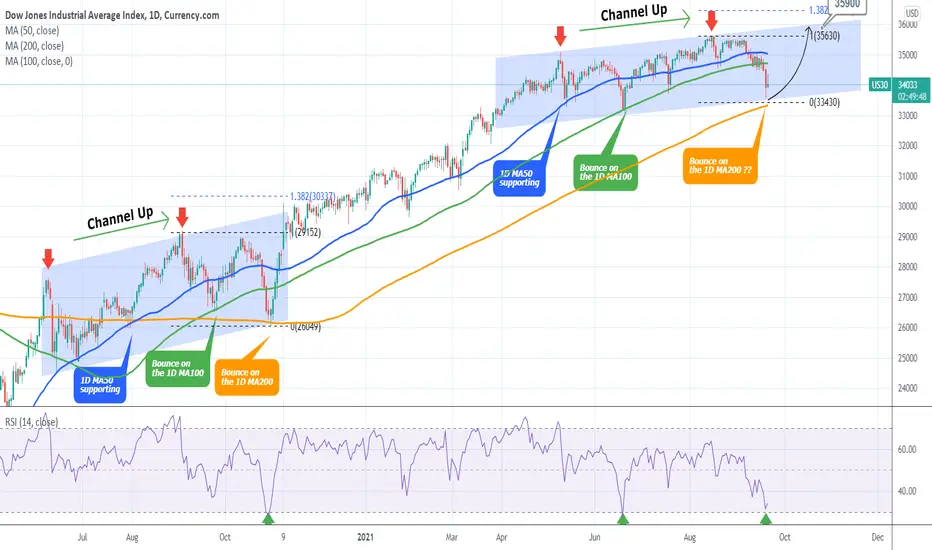
DOW JONES near the 1D MA200/ first time since October 2020!Dow Jones is trading within a Channel Up that has recently broken below the 1D MA100 (green trend-line). This is the first time in two months that is giving the first strong buy signals:
* The RSI is near the 30.000 level which has marked price bottoms on June 18 2021, October 29 2020 (in the post COVID crash era).
* The price is approaching the 1D MA200 (orange trend-line), with the last contact dating back to October 30 2020 (the line held and issued an aggressive rally post US-elections).
* The pattern resembles the June - October 2020 Channel Up. The price hit the 1D MA50 (blue trend-line), 1D MA100 and 1D MA200 in the same order and manner.
Naturally the market is waiting for Fed's confirmation tomorrow before it engages aggressively on high volume but this is the time technically to start considering a buy entry again. Based on the Fibonacci extension model, a target of 35900 seems very plausible.
** Please support this idea with your likes and comments, it is the best way to keep it relevant and support me. **
--------------------------------------------------------------------------------------------------------
!! Donations via TradingView coins also help me a great deal at posting more free trading content and signals here !!
🎉 👍 Shout-out to TradingShot's 💰 top TradingView Coin donor 💰 this week ==> Vergnes
--------------------------------------------------------------------------------------------------------

Dow Jones: It’s going down!With the bears remaining strong, we adapted our expectations and foresee a decline until somewhere close to around 34035 points. After establishing a low there, the Dow Jones should gain strength again and surpass the resistance at 35547 points.
Be patient!

DOW sitting on support. The DOW hit all time highs last month and since then has been consolidating its gains. More importantly, the index broke the ascending trend line from the Covid lows back in June. However, the index didn't turn bearish at that point, we grinding higher and consolidated all summer. Today, the Index is parked on another ascending trend line since February 2021. Arguably it is this years "trend." We feel it is important to start monitoring for near term weakness especially as the RSI points lower as it has been divergent since the spring.

US30 H4 - Potential BUYSSimple price action:
- Looking for a retest of Support before going LONG
- 35000 is a significant area with multiple retests
- Gap at the 35450 area needs to be filled

Dow: Aaaaand Action! 📽📽📽The Dow Jones has a hard time pushing for an offensive to overcome the resistance at 35547 points. However, sooner or later we see the course moving above that resistance and gradually build up new all-time highs until the area around 37607 points is reached.
Good times coming!

was that the top? lets speculate! dow to gold ratio tracking all 3 major indices priced in gold, we can start to speculate where the dip could happen. dow to gold seems to be the worst of the three, possible dragged by energy and financials. Markings show a negative divergence in rsi vs the price action. Of course speculation on reversals is stupid and risky, but I still enjoy this hobby :D

DOW game over pretty soon under 100dma and uptrend break DOW game over pretty soon under 100dma and uptrend break . last week low important supp

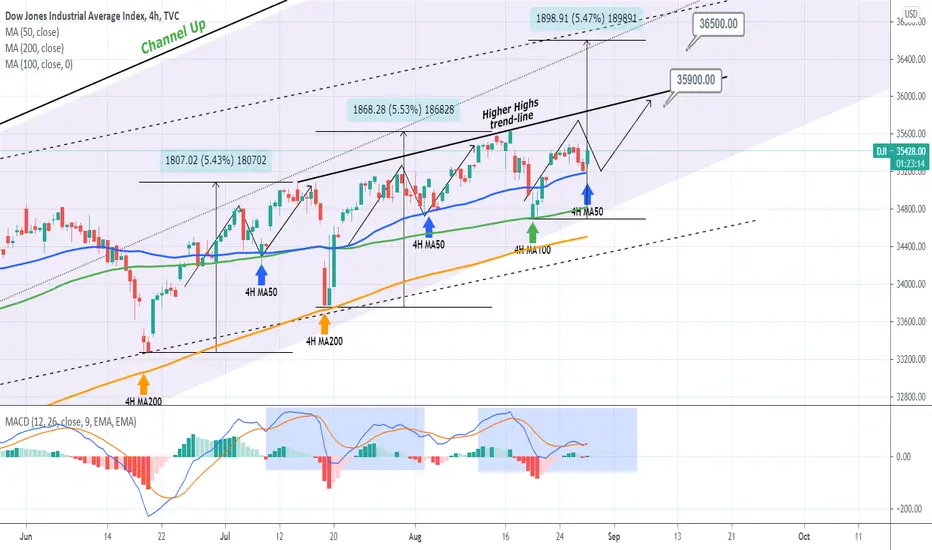
DOW JONES pattern to 36000Pattern: Channel Up on 4H.
Signal: Buy as the price made a rebound on the 4H MA50 (blue trend-line).
Target: 35900 lower risk (just below the Higher Highs trend-line) or 36500 higher risk (a roughly +5.50% extension top from the MA100 low).
** Please support this idea with your likes and comments, it is the best way to keep it relevant and support me. **
--------------------------------------------------------------------------------------------------------
!! Donations via TradingView coins also help me a great deal at posting more free trading content and signals here !!
🎉 👍 Shout-out to TradingShot's 💰 top TradingView Coin donor 💰 this week ==> nevada999
--------------------------------------------------------------------------------------------------------
Lines in the sand for DollarIt seems a timely choice to update the dollar chart. Extending the characteristic positioning in the previous euro chart, seems to me to be more in accordance with the needs of 93.75 - 94.00 holding and acting as a reliable guardian for the remainder of August and September, but the threat to an attack higher is real.
In the DXY chart, buyers will need to make good use of the whitespace above as an attacking battlefield. Things are quite different in the ladder between 95-96, where we are talking of the complex change in nature from corrective to impulsive; in fact we must consider both possibilities as valid in their characteristics
From a geopolitical risk perspective, the task of sellers defending the 94 handle is also complex, buyers can see the problem of restraint they are having and could aggressively rush to USD, moving DXY higher with a hint of more risk (Afghanistan, Taiwan etc).
With all that said, the long term structural decline of the West looks underway with migration Eastward. This will be a multi year/decade long process as long as Dems are at the helm. My impression is as follows; we are trading towards the top end of the range, here actively looking for opps to trade 93.7x/94.0x => 90.6x. This C leg can extend as high as 95.4x and still be valid. Invalidation and reassessment of the view will only be required above 96.3x.


Dow: Turnaround Ahead! 🤠🤠🤠We interpret the current downtrend of the Dow Jones as a temporary correction. The turnaround area should be around 34358 points, which we are about to reach. However, there is still plenty of room on the downside. In total, the Dow should fall to 33623 points at max. Below that line, we will face bigger corrective patterns.
Waiting is key!

Weekly Market Wrap (13th August 2021)This is weekly Market Wrap. Here readers can view price of particular securities at market close ending week 13th August 2021.
Forex (13th August 2021):
EURUSD – Close price = 1.17949 USD
EURAUD – Close price = 1.59998 AUD
EURCAD – Close price = 1.47591 CAD
EURGBP – Close price = 0.84989 GBP
USDCAD – Close price = 1.25135 CAD
USDGBP – Close price = 0.72108 GBP
Commodities (13th August 2021):
Gold (XAUUSD) – Close price = 1779.900 USD
Silver (XAGUSD) – Close price = 23.75 USD
WTI oil (USOIL) – Close price = 67.93 USD
Brent oil (UKOIL) – Close price = 70.22 USD
Indices (13th August 2021):
Nasdaq (NDX) – Close price = 15136.68 USD
SP500 (SP500) – Close price = 4460.83 USD
DJIA (DJI) – Close price = 35515.39 USD
DAX (DAX) – Close price = 15977.440 EUR
Disclaimer: This analysis is not intended to encourage buying or selling of any particular securities. Furthermore, it should not serve as basis for taking any trade action by individual investor. Your own due dilligence is highly advised before entering trade.


DOW JONES - traded above $35,200. Next Target is $36,000Dow Jones - Traded above $35,200. Next Target is $36,000. Then...

DOW JONES may need to hit the 4H MA200 to go higherPattern: Channel Up on 1D.
Signal: Buy if the price hits the 4H MA200 (orange trend-line) as it is the most optimal buy signal in the past 2 months.
Target: 36400 (the 2.0 Fibonacci extension).
** Please support this idea with your likes and comments, it is the best way to keep it relevant and support me. **
--------------------------------------------------------------------------------------------------------
!! Donations via TradingView coins also help me a great deal at posting more free trading content and signals here !!
🎉 👍 Shout-out to TradingShot's 💰 top TradingView Coin donor 💰 this week ==> nevada999
--------------------------------------------------------------------------------------------------------

Us30 vs Btc ???Basic Supply n demand
My Original strategy at work hmu
US30 showing bullish potential i guess all that bitcoin
Inflation talk n investor fears was all gibberish

Dow Jones - DJIA - Can it break $35,200?Dow Jones - DJIA - Can it break $35,200? Resistance is strong at this point. The overall market momentum has been slowing. Can the Dow regain momentum or is this an extended reversal? We will see?
