DOW JONES can rally on this Inverse Head & ShouldersPattern: Channel Up on 1D.
Signal: Buy as the price is about to complete an Inverse Head and Shoulders within the Channel, similar to January/ February.
Target: 36450 (the 2.0 Fibonacci extension).
** Please support this idea with your likes and comments, it is the best way to keep it relevant and support me. **
--------------------------------------------------------------------------------------------------------
!! Donations via TradingView coins also help me a great deal at posting more free trading content and signals here !!
🎉 👍 Shout-out to TradingShot's 💰 top TradingView Coin donor 💰 this week ==> RyodaBrainless
--------------------------------------------------------------------------------------------------------
Djia

Expecting a breakout to the upside in the Dow Dow's been consolidating in a rectangle pattern for a few weeks. I like DIA call options going out to June/July or Dow Jones futures. I'm expecting a breakout soon based on this week's price action.
A break below would trigger a short, but I view that as a low probability

How many tech stocks do you own ?Looking at a bigger picture, we can see that of the 3 indices, the Nasdaq index soar the highest after the March 20 sudden fall. SPX500 and DJIA were pretty decent in its recovery , at least fairly consistent.
In today's digital world, we are talking about digitising the mom and pop shop concept (see how strong E commerce growth has been globally) and automation in industrial and material sectors.
It is no longer an exaggeration to say people of all ages cannot live without the online world !
Read articles here , here and here
Then compare the constant war that US and China have over the tech industry - Huawei being the classic case. It is said that China is now no longer a copycat like before but an innovator in the tech industry worldwide. The Government is also spending lots of money to boost this industry.
Not forgetting Covid-19 - is it getting better or worse now , on average ? SG has just returned back to dining from 5 to 2 due to a new recent cluster case. Malaysia and Indonesia along with other countries like India are facing staggering number of cases per day. Their healthcare system is at the brink of COLLAPSE , overworked , underpaid medical staff working long hours and poor distribution of vaccines plus insufficient education on the need to wear masks in some areas.
Connecting this dot, will travel and tourism business return anytime soon? Closely related are the hospitality industry like hotels, cruises, amusement parks, cinemas, entertainment industries - all will be hit hard. Is the government going to continue dig into its depleting coffer to support these industries ? Many companies will be forced to close shop and call it a day while others hang on a tight budget hoping to last another better day !
But it is not all gloom and doom if you know where to find the gems ! I will be sharing more in the next few posts .

Bearish Divergencenot financial advice. all in the chart. this ship is sinking. everything bubble is popping

Nasdaq Bull Market Over? Near perfect symmetry says soNo one will read this which is a shame as the Super Cycle wave relationships are as close to perfect as possible; meeting all of the Elliott Wave Theory standard fib relationship criteria. Everyone is calling a top soon, but I don't think they fully understand the length of correction we're likely entering.
After today's price action, super cycle wave 5 is now 1.6178x the length of Wave 1 (if you don't know why this is important/significant, you should research to find out -- it'll blow your mind). Wave 3 still remains at 1.6883 of wave 1. Initial retrace target of wave 2 is to the 0.382 fib retracement at 9195.83. If this level breaks, then we are open to hit 5705.10 (this might be getting a little ahead of ourselves, but fib levels are well respected in this market). This full 5 wave super cycle was ~2440 weeks, so a compromise on fibonnaci time (0.382) proportionality means it may be 932 weeks until we see an end to wave 2.
This almost seems ridiculous to talk about and project like this, but all cycles on all time frame are always a fractal part of a larger set and I contend we've completed a Grand Duper Cycle Wave 1, comprised of five Super Cycle waves. There is an extensive amount of fib confluence over head from today's highs and I'm betting we don't go any higher than 15,300 before a prolonged market collapse with INITIAL TARGETS of nearly 40% from the highs.
Here are my super cycle begin/end points for each of the 5 waves.
Wave Date Hi/Low Amount
Beg 3---Oct-74. 54.87
Wave 1--- 10-Mar-00 5132.52
Wave 2 ---9-Mar-09 1265.62
Wave 3--- 19-Feb-20 9838.37
Wave 4 ---23-Mar-20 6631.42
Wave 5 ---23-Jul-21 14846.06
I'm not used to really sharing this with people as I usually fade into the back ground, but I'm happy to put this little bit together for you. I'd love to hear yours too.

#djia 36,000 a historic milestone is coming fast!congratulation to 401k retirees who were fully invested in the market.
With offices opening up
will spark a wave of retirement by the boomers.

Nasdaq Completes Super Cycle Wave 5 -with Fib Confluences GaloreIf you zoom out on the Nasdaq using a 13D chart, you'll see a clear 5 wave sequence having recently completed. This argument is bolstered by both wave 3 and wave 5 which are 1.618 extensions of wave 1. Wave 3 and Wave 5 are both identical in length. Using this Wave count you'll also see a myriad of confluent fib levels, extensions, etc; but I'm trying to spare you a convoluted chart.
To me this says we are at a super cycle top and have completed Grand Super Cycle wave 1. At the Nasdaq's recent all time high, we cleared the 2.618 of wave 1 by less than 2%.
If you even remotely respect the Elliott Wave guidelines,, you know what this means. There really isn't a downside limit (well, the all time lows around 50 in 1974) and this likely means we are entering a years or decades long Wave 2 correction.

Dow Jones: Recovery! 🚑🚑🚑After the recent correction, the Dow Jones is recovering again. However, we believe that there is still some potential on the downside until somewhere around 33299 points. Once within that area, the Dow can start its final recovery and push for new all-time highs above 35000 points. It is only important that it stays above 32902 points.
Exciting times!

Correction is over. 38-43K by August.The correction is over. Big upside ahead in the US equity indices.

WARNING SIGNS DJI Bear case for DJI presented with an ABCDE correction unfolding. My take - E WAVE down on deck. Price target provided.
Last summer starting in August and running through all of October DJI witnessed an ABC correction which is highlighted on the chart for comparison. However, last time - following the correction the DJI price smashed up through a potential triple top formation clarifying that it was an ABC down and that DJI was done correcting (No ABCDE Correction).
Today's price action on DJI stalled out @ ~35K and sold off (note = lower high than May 10th) , thus potentially completing WAVE D up in the chart as shown. Stoch and RSI pointing downward and Woodies CCI appears to be confirming the trend. Further, the recent lapse as highlighted in the Stochastic indicator where it could not get Overbought for several days is flashing a warning that DJI is top heavy/needs to correct.
Futures price action tomorrow and the rest of this week will likely be telling, to see if the price can power up like it did last October - however will still need watch for a potential megaphone top on DJI, but if it flies up like last time, bear case will be suspect.
Hearing more and more that early Bears will be squeezed - nibbling on the short side only, waiting for confirmation.
Not financial advice.

EUR/USD Daily Outlook: All Eyes on the US CPIDaily outlook for EUR/USD with fundamentals, intermarket, sentiment, and technicals.
Daily outlooks are stripped down versions of my Weekly outlook posts, focusing on daily events and price-action, so make sure to check out the Weekly Outlooks as well.
Fundamentals: No major reports from Eurozone today puts the pair at mercy of USD dynamics. On July 22, the ECB will unveil their new monetary stimulus guidance, with Lagarde noting that the event will have “some
interesting variations and changes”. She also emphasized that the PEPP will run at least until March 2022.
Markets are focused on the US CPI report later today, with y/y numbers expected at 4.9% (vs 5.0% in May) and m/m expected at 0.5% (vs 0.6% in May). A beat of forecasts could lift the USD during the day.
Upcoming market reports:
Tuesday at 12:30: USD CPI m/m (Expected: 0.5% , Previous: 0.6% )
Tuesday at 12:30: USD Core CPI m/m (Expected: 0.4% , Previous: 0.7% )
Tuesday at 17:01: USD 30-y Bond Auction (Previous: 2.17|2.3 )
Intermarket: Yield differentials (2y German-US) are slightly supportive for the pair.
Sentiment: Asia closed slightly higher, Europe is mixed. US markets reached fresh highs ahead of today's earnings reports (JP Morgan and PepsiCo among blue chips reporting.) JPY and USD are the strongest currencies so far, GBP the weakest. Sentiment is mixed and could be both bullish and bearish for EUR/USD.
Technicals: The pair entered a bear run this morning after trading in the vicinity of weekly highs (1.1880 resistance), forming lower high on the 1-hour chart. Volume was rising on increased selling pressure, but the latest 1-hour pinbar candlestick suggests some stopping volume entering the market and a possible turning point.
Below, 1.1825 remains an important support (level between the 50% and 61.8% Fibs, and a trendline support). A disappointing CPI could push the pair above the 1.1880 highs, while a strong reading could see a retest the 1.1780 region.

Top Trade Ideas & Morning Meeting for July 09🌐 MORNING MEETING & TOP TRADE IDEAS - JULY 09
🔴 GLOBAL STOCK MARKETS (MAIN CHART)
Morning trader and happy Friday! It looks like investor mood is finally turning better after a wave of risk aversion in the last few days.
Asia closed almost unchanged, but Europe turned green with the CAC 40 leading the pack (up 1.73%). US market futures are also turned bullish after yesterday's lower close.
🔴 US DOLLAR INDEX
The US dollar has faced some selling pressure this morning, attempting a break down below a hourly bullish trendline. Yields are somewhat higher, with the 2-year yield retreating from daily highs and pointing downwards now. If risk sentiment stay positive, we could see further downside in the USD during the day.
It's worth noting that the second half of the year is typically not as bullish for the US dollar as the first half, but a potential bear flattener (faster rising short-end yields as the Fed prepares for tapering and tightening) could provide some support for the US dollar in the coming months.
🔴 CURRENCY STRENGTH
The currency strength chart shows the completely opposite picture of yesterday. Risk currencies are charged, while USD, JPY and CHF are the weakest for the day.
🔴 ECONOMIC CALENDAR
- The top reports for today include the CAD employment report (expected better than last month).
- BoE's Bailey and ECB's Lagarde are expected to participate in a panel discussion in Venice titled "Digitalisation, intangibles and potential growth in a post-COVID world".
- A series of weaker UK reports, but the GBP is pretty much unfazed and breaking yesterday's highs. GBP/USD is currently a story of the USD.
🔴 TOP TRADE IDEAS - JULY 09
1. We are sticking to our trades from yesterday (we've been long GBP/USD and have another pending order)
2. The Canadian dollar could be an interesting trade today (oil inventories came in lower yesterday, oil is stronger, yield differentials are supportive, and employment numbers for Canada are expected better)
✅ REVIEW OF YESTERDAY'S TRADE IDEAS - JULY 08
- The 1.1735-50 support in GBP/USD held perfectly (check yesterday's post) and we closed part of our GBP/USD position in profit.
- We still have a pending order in NZD/USD

The 6 Principles Of The Dow Jones Theory !!!Hello everyone , as we all know the market action discounts everything :) I've prepared a video explaining the 6 principles of the Dow Jones theory , everything you need to know about the Dow Jones theory is in this video or if you prefer to read i got you :)
The Dow Theory is a trading concept conceived by Charles H. Dow, an American journalist and founder of the ‘Dow Jones & Company’ financial firm. The ‘Jones’ part refers to the statistician and co-founder of the company who also took part in the development of Charles Dow’s concepts. Initially, it consisted of 255 editorials. Dow himself didn’t actually create and name the theory. After Dow’s death, Rea, Schaefer, and Hamilton gathered the editorials, formed the theory and named it after Dow.
Even though it’s more than 100 years old, this is the theory that technical analysts use and swear by today.
The 6 Principles Of The Dow Jones Theory :
1_ The market action discounts everything
2_The market has 3 types of Trends :
The Primary Trend: It can be as long as years and is the ‘main movement’ of the market.
The Secondary Trend: lasting between 3 weeks to several months, retraces the last primary move some 33-66% and is difficult to decipher.
The Minor Trend: is least reliable, lasting from several days to few hours, constitutes of noise in market and may be subject to manipulation.
3_The market trend has 3 phases :
The beginning of a primary upward (or downward) trend in a bull (or bear) market is known as the accumulation phase. Here, Smart traders enter the market to buy (or sell) stocks against common market opinions.
The participation phase, more investors enter the market as business conditions improve and positive sentiments become evident. This results in higher (or lower) prices in the market.
The distribution phase is marked by excessive buying by inexperienced investors. This could result in great speculation. At this stage, it is ideal for investors to book profits and exit.
4_The averages must confirm each other :
Dow, is referring to the DJIA and the Transport Index , meant that no important bull or bear market signal could take place unless both averages gave the same signal, thus confirming each other. He felt that both averages must exceed a previous secondary peak to confirm the inception or continuation of a bull market. He did not believe that the signals had to occur simultaneously, but recognized that a shorter length of time between the two signals provided stronger confirmation. When the two averages diverged from one another, Dow assumed that the prior trend was still maintained
5_Volume most confirm the trend :
According to Dow theory, the main signals for buying and selling are based on the price movements of the indexes. Volume is also used as a secondary indicator to help confirm what the price movement is suggesting
From this tenet it follows that volume should increase when the price moves in the direction of the trend and decrease when the price moves in the opposite direction of the trend.
The reason for this is that the uptrend shows strength when volume increases because traders are more willing to buy an asset in the belief that the upward momentum will continue. Low volume during the corrective periods signals that most traders are not willing to close their positions because they believe the momentum of the primary trend will continue.
6_A trend will continue until on apposite force is applied :
An uptrend is defined by a series of higher-highs and higher-lows. In order for an uptrend to reverse, prices must have at least one lower high and one lower low (the reverse is true of a downtrend).
However, the longer a trend continues, the odds of the trend remaining intact become progressively smaller.
Make sure to Follow and Like for more content
If you have any questions please ask
Thank you for reading & watching .

EUR/USD Daily Outlook: FOMC, yields push the pair higherEUR/USD Daily Outlook
FUNDAMENTALS:
The euro has briefly managed to break above the all-important 1.18 mark due to the US dollar's strength ahead of the FOMC meeting minutes yesterday. However, the minutes of the June meeting came in less hawkish than markets expected as the Fed wouldn't rush into tapering. This has also calmed market fears that the Fed would move aggressively towards tapering despite an obviously uneven economic recovery in the US.
The eurozone recorded a rise in Covid infections with the new Delta variant at the beginning of Q3. This could increase market fears that countries in the euro area could delay their reopening plans and that economic recovery could be derailed. Another interesting story is that the ECB will follow the Fed in targeting an average inflation rate with occasional overshoots above the 2% level. The ECB will have a hard time convincing markets to increase their long-term inflation expectations, especially compared to the Fed, which could add to selling pressure in the euro. However, it's unlikely that this change in monetary strategy will be of great interest to the markets these days.
Latest Headlines:
USD News:
- US futures extend fall in European morning trade
- US Dollar Index eases from tops, back near 92.60
- USD to remain bid as optimism over a robust global growth is tested – MUFG
- US 10-year yields face strong support at 1.30% - UOB
- US 10-year Treasury yields bounce off five-month low amid covid concerns
- Fed's Bostic: At this point it feels the US will revert back to 2% inflation
EUR News:
- EUR/USD clinches fresh tops near 1.1830 ahead of ECB
- EUR/USD: COVID-19 concerns and ECB policy review pose downside risks – MUFG
- EUR/USD to move downward towards the 1.17 level – OCBC
- EUR/USD: Noticeably under pressure, March lows at 1.1704 in the crosshairs – Commerzbank
- Germany Current Account n.s.a. came in at €13.1B, below expectations (€16.7B) in May
- Germany Imports (MoM) above expectations (0.4%) in May: Actual (3.4%)
Upcoming Market Reports:
Here are the most important market reports for EUR/USD to follow in the coming days (all times are UTC timezone):
Thursday at 12:30: USD Unemployment Claims (Expected: 345K , Previous: 364K )
Thursday at 15:00: USD Crude Oil Inventories (Expected: -4.0M , Previous: -6.7M )
Friday at 10:00: EUR ECB President Lagarde Speaks (Expected: , Previous: )
INTERMARKET:
With the fall in the US yield curve (bull flattening), the 2-year German/US yield differentials pointed higher this morning. If risk sentiment turns somewhat positive and the US dollar starts to move in line with yields (positive correlation has already been established this morning), this could lead to further upside potential in the pair.
SENTIMENT:
Currency Strength Index:
Typical risk-off in currency strength charts. EUR and USD are somewhat range-bound (but both slightly higher today).
TECHNICALS
Buying volume entered the market after a push below 1.18, which was somewhat expected. Although still in a technical downtrend, the push above a bullish wedge pattern could lead to further strength, particularly if the USD decides to finally follow yields. The price is now trading near the 50% Fib level which aligns with a short-term resistance, with the 1.1850 (61.8% Fib level) acting as the next major hurdle for the pair.
Another important development is the falling volume along with a narrowing range in the last few candlesticks. If the price keeps rising with smaller candlestick bodies and decreasing volume, we could soon see a top.
Levels to follow (Liquidity):
Major resistance: 1.19
Minor resistance: 1.1850 (61.8% Fib)
Major support: 1.1780 (weekly low)
== SUMMARY ==
There are conflicting signals in the market, but I would rather look to trade EUR/USD from the buy-side than the sell-side.
Please hit the 'LIKE' button if you find this post useful. Also, don't forget to follow to get more trade ideas like this. Thanks!

🌐 MORNING MEETING - MARKET PREVIEW - JULY 07🔴 GLOBAL STOCK MARKETS
Good morning traders. After yesterday's slight shifts towards risk-off (USD firmer and risk currencies softer), Asian markets closed mixed with Shanghai and Australia posting gains, but Nikkei and Hang Seng in the red. European markets recovered some ground after yesterday's sell off and trade in the green, with the DAX taking the leading position (+0.81% so far).
🔴 USD INDEX
The USDx has enjoyed a strong Tuesday but entered into a consolidation phase this morning ahead of the FOMC Meeting Minutes (released at 8:00 PM CET this evening).
Yields are softer, which could pose a risk for USD bulls during the day. The positive correlation between the USDx and 2-year yields is still broken (USD higher despite lower yields.)
🔴 COMMODITIES
Comms hold up pretty well this morning, with Copper futures taking the lead. Could be beneficial for the AUD and some other commodity currencies.
🔴 CURRENCY STRENGTH
Commodity currencies are the strongest so far (CAD, NZD, and AUD), while EUR and JPY are the weakest.
AUD seems to pick up on slightly positive risk sentiment, the shift in RBA's monetary policy stance, and higher copper prices. NZD is also supported by market expectations about a hawkish shift in the RBNZ, while CAD enjoys higher oil prices.
🔴 ECONOMIC CALENDAR
The FOMC Meeting Minutes is the main event of today that can have a strong impact on the USD. How will the hawks and doves argue their cases for a rate hike in 2022?
Other important reports include the EU Economic Projections, and the CAD Ivey PMI and CAD JOLTS Job Openings (both expected slightly stronger).
🔴 TOP TRADE IDEAS FOR JULY 07
- Bullish bias on USD - There are not many reasons to turn bearish on the USD today, especially given the FOMC Meeting Minutes, which can fuel another bull run in the currency.
- Bullish AUD against weak currencies - The AUD should be able to recover some ground (given risk appetite doesn't turn negative), especially against weaker currencies

DJI early signs of bear market.The price of the DJI is not following anymore the primary upward trend line that began in march 2020, neither the channel line. Is not able to make new higher highs and there is a shooting star in the top of the advance. There is been a 93% upward move since march 2020, which is a record upward move in such a short period of time. Volume is heavier on downward moves than upward moves, there is a volume and price divergence. Also the price is moving sideways, all of this is suggesting that distribution may be happening already.

🌐 FX MORNING MEETING: Let's prepare for the trading day June 30Hi traders, here is our FX Morning Meeting for June 30.
This market overview will help you find market opportunities where they actually exist ("Trades of the Day section"), based on a number of fundamental, intermarket, and sentiment signals.
Leave us a comment what you want to trade today!
🌐 MORNING MEETING - JUNE 30
🔴 GLOBAL MARKETS (main chart)
Morning traders, global markets remain in a cautious mode ahead of the US NFP release and holiday ("event risks").
This has supported safe havens so far and put selling pressure on risk assets.
Asian markets closed mixed/unchanged, while European markets entered a strong downtrend this morning.
🔴 US DOLLAR INDEX
Looking at the USDx, the currency traded higher today despite slightly lower US yields, likely fueled by risk-off flows. The 92.40 resistance remains a strong obstacle to the upside, but we could see additional strength in the currency during the day.
🔴 CURRENCY STRENGTH
Our currency strength index shows a typical risk-off pattern: JPY and USD are among the strongest (together with GBP), while CAD, AUD, and NZD are the weakest currencies so far.
🔴 ECONOMIC CALENDAR
The economic calendar is packed with reports today, although few of them will have market-moving potential.
China PMIs came in weaker than expected (negative for AUD).
EUR CPI Flash Estimate (an early reading of eurozone inflation) matched forecasts (1.9%).
Upcoming events to follow:
- US ADP NFP Change (expected 555k)
- US Chicago PMI (expected 70.2)
- US Pending Home Sales (an important leading indicator, expected -1.1%)
🔴 TRADES OF THE DAY (JUNE 30)
- We hold to our short AUD/USD and AUD/JPY trades (Take-Profit hit, remaining position at Breakeven)
- Today's trade setups are similar to yesterday's: Long safe-havens (USD, JPY) and short high-beta risk currencies (AUD, NZD, CAD).

🌐 MORNING MEETING: Pre-NY Market Preview, June 29Morning traders! Here is our morning meeting ahead of the NY open. Leave us a comment about what you want to trade today! Let's make this a constructive discussion for the trading day.
🔴 GLOBAL MARKETS (main chart)
Morning traders, Asian markets closed lower, including the Nikkei 225 which is down 0.80%, which is one of the reasons why the JPY has been performing exceptionally well this morning.
European markets are in the green so far, with the DAX leading the other indices (up 0.79%). The FTSE is the weakest among the major three European markets, but the traditionally high correlation between DAX and FTSE could lead to further strength in the latter.
🔴 USD INDEX
The US dollar edged higher this morning on a slight rebound in short-term US yields. The positive relationship has been established again, and the support at 91.50 is still a major obstacle to the downside.
To the upside, 92.40 remains the next hurdle.
🔴 COMMODITIES
Among commodities, copper is clear loser, down more than 2% in the last few days. Other comms also feel the pressure of a strengthening US dollar, including Brent crude.
Weak copper prices added to selling pressure in the AUD, which is one of the weakest currencies today.
🔴 CURRENCY STRENGTH
Looking at the individual currencies this morning, the JPY and USD are the top performers (lower Asian indices, risk-off, and the rebound in US yields), while AUD and NZD are the weakest (falling copper and commodities, one of the reasons).
🔴 TRADE PLAN FOR TODAY (JUNE 29)
- Long USD and JPY on pullbacks and short risk currencies (AUD and NZD).

Dow Jones: C’mon speed up! 👀👀👀As things stand right now, the Dow Jones is still indecisive in the sense that the bulls on this market were not strong enough to push for new all-time highs. Most importantly, the Dow needs to cross the resistance at 35000 points in order to show us that the following movement towards 36401 points is in full effect. Once this mark is reached, we face another correction before moving towards 37281 points.
Stay positive!

DOW JONES Is this a giant Bullish Flag?DJIA has been trading within a Channel Up since the U.S. elections last November. However since the May 10 Top, it has been trading under Lower Highs and Lower Lows which are the characteristics of a Channel Down.
Last time we had such pattern was the sequence before the U.S. elections, which turned out to be a giant Bullish Flag. The 1D RSI has bounced off the 1 year Support Zone, same as late October prior to the elections. Can this be a similar Bullish Flag? If yes then Dow Jones will aim at the 1.382 - 1.5 Fibonacci Zone.
** Please support this idea with your likes and comments, it is the best way to keep it relevant and support me. **
--------------------------------------------------------------------------------------------------------
!! Donations via TradingView coins also help me a great deal at posting more free trading content and signals here !!
🎉 👍 Shout-out to TradingShot's 💰 top TradingView Coin donor 💰 this week ==> StockSwinger
--------------------------------------------------------------------------------------------------------

Dow Jones Industrial Average - The DOW is at a Critical point! Dow Jones Industrial Average - The DOW is at a Critical point! Are we at the end of a Cycle? Will we see a dip?

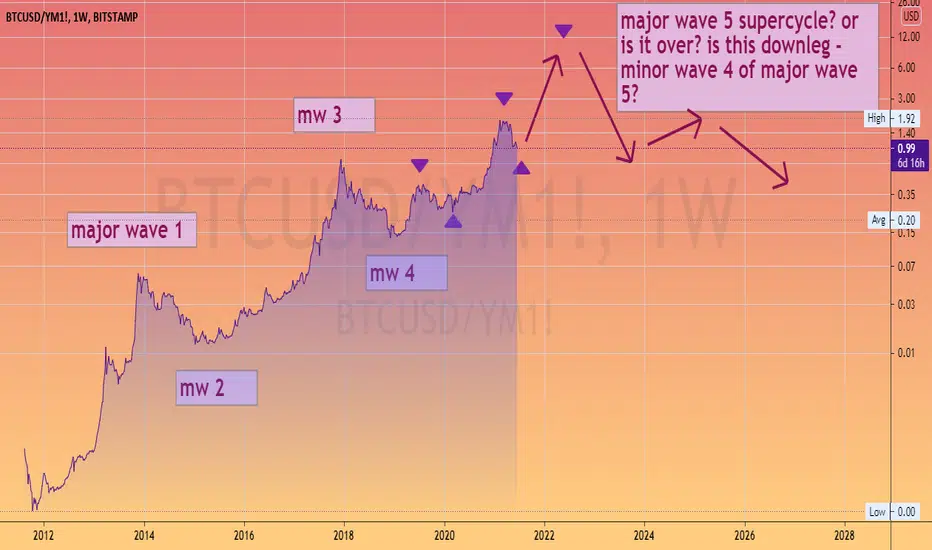
#bitcoin priced in the #dowjones #djia Elliot Wave TheoryThe problems underlying the mechanics of legacy are plain to see for anyone with an understanding of Blockchain DLT
Digital Property ownership with Transferability 24/7 is not available for stocks & bonds
With each passing day, this is getting glaringly obvious Wall Streets' days are numbered without a big reorganization from top to bottom.
Bitcoin and Cryptos are EXTREMELY disruptive
But of course, it will be a Bumpy Ride.
#HODL