#bitcoin scenario cast 6.19.21Slander is the signal
Risk off in legacy
Will they risk a debt bubble blow up?
No they inflate it away as always
Stimulus forever until enough people have migrated to debt-free money that the machinations of a central bank are no longer relevant to a mjority of the global pop
Its a process, that will likely take another 15 - 20 years
You guys are still early, but not as early as the middle of last decade obviously
do you want to arrive in 2025-27
and have been fudded out of your holdings?
Djia

Dow Jones Industrial Average - Is it due for a dip or a pop?Dow Jones Industrial Average - Is it due for a dip or a pop? We were expecting some action this week. So far it has been a slow decline. What will happen next as the market cycles? We will see? We are neutral on the Dow.

#BITCOIN & #CRYPTOCURRENCY IS THE RELEASE VALVE FOR A PROPPED UP "RIGGED" LEGACY #FINANCIAL SYSTEM
You may have gotten off zero
but what about your loved ones - friends & family
Shilling is hard work to no coiners... but maybe showing them this chart will be a wake-up call?
Look out for them, as we are in a S curve adoption phase of Digital Ledger Technology

Sector early indicator? Yes, Banks often are.The Banking sector, a sub-sector of the Financial sector - here represented by NASDAQ Bank Index (BANK , in green) - often acts as an early indicator against the broader market (here represented by the DJIA in gray, and the NASDAQ in black)... falling from peaks: as early as from 1998, in Feb 2007, steadily declining from Jan 2011, continuing underperformance from July 2018, and in Dec 2019.

Sector early indicator? No: Health & Utilities, not usually.The Healthcare sector and Utilities sector - here represented by the S&P Health Care Index (S5HLTH, in blue) and Dow Jones Utility Average (DJU, in purple) - do not usually act as early indicators against the broader market (here represented by the DJIA in gray, and the NASDAQ in black)... except perhaps for DJU falling from a peak in Jan 2015, and in Dec 2017.

Sector early indicator? No: Natural Resources, not really.The Natural Resources sector - here represented by BHP (in green) and Rio Tinto (RIO, in orange) - does not generally act as an early indicator against the broader market (here represented by the DJIA in gray, and the NASDAQ in black)... only possibly during the fall in their share prices over Jul and Aug of 2018.

Sector early indicator? No, Consumer Staples, not that much.The Consumer Staples sector - here represented by Procter & Gamble (PG, in pink), Coca Cola (KO, in yellow) and PepsiCo (PEP, in purple) - are mostly not strong early indicators against the broader market (here represented by the DJIA in gray, and the NASDAQ in black)... KO & PEP fell from peaks in July 1998, then a period of over six months of weak underperforming prices from Dec 2014, a period of around two and a half months of weak underperforming prices from Aug 2017, then weak underperforming prices for KO & PEP during all of Aug 2018, and a period of around two and a half months of weak underperforming prices from mid Oct 2019.

Sector early indicator? Telecommunications - not much at all.The Telecommunications sector - here represented by AT&T (T, in teal) and Verizon (VZ, in pink), - does not often clearly act as an early indicator against the broader market (here represented by the DJIA in gray, and the NASDAQ in black)... falling from peaks in Jul 1999, then a prolonged period around two years of weak underperforming prices from 2013-2015, and then another prolonged period of around ten months of weak underperforming prices in 2017, and a period of around two months of weak underperforming prices from Nov 2019.

Sector early indicator? Media sector, only occasionally.The Media sector, a Consumer Discretionary sub-sector - here represented by Disney (DIS, in purple) and Comcast (CMACSA, in blue), - only occasionally act as an early indicator against the broader market (here represented by the DJIA in gray, and the NASDAQ in black)... falling from peaks: prior to the end of May 2007, prolonged 5 months of weak underperforming prices in 2017, a month and a half of weak underperforming prices around Nov 2019.

Sector early indicator? Retail sector - not much (but watch WMT)The general Retail Sector (as opposed to retailing of hardware home improvements by Home Depot and Lowes - studied in an earlier chart) - here represented by the VanEck Vectors Retail ETF (RTH, in green), and the mighty Walmart (WMT, in blue) - only occasionally (more often by WMT) acts as an early indicator against the broader market (here represented by the DJIA in gray, and the NASDAQ in black)... falling from peaks... WMT peaking on 29 Dec 1999, WMT falling from a peak in Jun 2007, WMT fading from a peak in Jan 2011, WMT in Jan 2015, WMT in Dec 2019.

Sector early indicator? Yes, Real Estate can be sometimes.The Real Estate sector - here represented by iShares U.S. Real Estate ETF (IYR, in orange), Simon Property Group (SPG, in purple), Equity Residential (EQR, in red), - can sometimes act as an early indicator against the broader market (here represented by the DJIA in gray, and the NASDAQ in black)... falling from peaks in 1998, Feb 2007, Mar 2015, Nov 2017.

DOW JONES touched the 1D MA50. Time to rebound?Dow Jones is trading within a wide Channel Up on the 1D time-frame since the November U.S. elections break-out. Applying the Fibonacci Channel levels really gives this a better perspective.
Yesterday the price hit the 1D MA50 (blue trend-line). As you see every contact within the 1D MA50 since January has been a buy opportunity. So far even when the 1D MA50 breaks slightly, the price never goes below the Ichimoku Cloud. Yesterday we had a hit both on the 1D MA50 and the Ichimoku. I believe that should be enough to initiate a rebound within the current phase of the Channel Up.
The question is, will that be like the March 04 rebound which broke above that Channel and took the index to the higher Fibonacci levels? What do you think?
** Please support this idea with your likes and comments, it is the best way to keep it relevant and support me. **
--------------------------------------------------------------------------------------------------------
!! Donations via TradingView coins also help me a great deal at posting more free trading content and signals here !!
🎉 👍 Shout-out to TradingShot's 💰 top TradingView Coin donor 💰 this week ==> AngusMcK
--------------------------------------------------------------------------------------------------------

DJI (& certain sectors) falling ovr aftr May volatility stressesDow DJIA (& certain sectors - but not yet the NASDAQ) falling over in June after May VIX volatility stresses, and diverging from a strongly rising IXIC Index (NASDAQ)... Sectors shown are Transportation, Finance, Consumer Staples and Natural Resources.

Dow Jones Transportation Signal Market Sell Off?The Dow Jones Transportation index usually tops and reverses prior to the Dow or S&P. The Transportation index has also fell below its support line while the Dow is in the apex of a bearish rising wedge pattern. Will the Fed save the markets again or will Wall Street finally meet reality? If the Fed didn't exist this would be the easiest short play.. I still think a pullback or consolidation is extremely likely

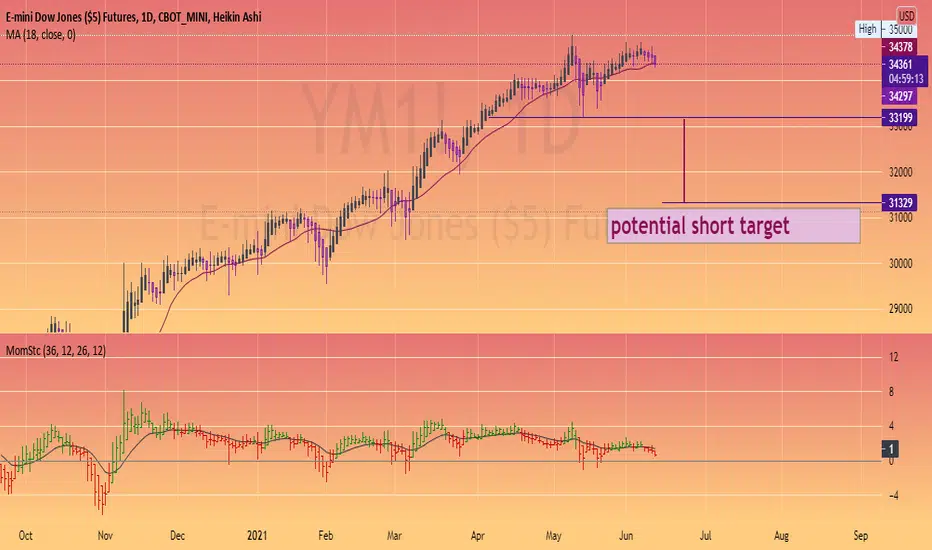
$dji pullback zone, then we reassess the climate if it reaches this area.
I don't play stocks but still keep an eye on it.
Dow Jones: Heart Eyes! 😍😍😍It increasingly seems that the global indices are gaining momentum and that we are entering another bull market. The Dow Jones, too, is looking healthier by the day. We expect the index-giant to rise between 35314 – 35513 points. There, a correction should add to the momentum for even stronger increases.
Good days ahead!

Dow Jones CYCLE? EXPECT VOLATILITY AROUND JUNE 11 - 18?Dow Jones CYCLE? EXPECT VOLATILITY AROUND JUNE 11 - 18? Is the Dow Jones about to end a cycle and start a new cycle? Will price pull back significantly after the push towards $36,000? Or, will it explode to the upside? We will see? Manage your risk? Not financial advice.

2021-05-29 DJIA Birdseye view 1929 till 2021Sometimes one needs to take a step back to see the bigger picture on what is going, to learn from the past and start making plans of actions on what to do next ✌
1929 Crash (Wikipedia article)
en.wikipedia.org
1987 Black Monday Crash (Wikipedia article)
en.wikipedia.org(1987)
1999-2000 Dot-Com Bubble (Wikipedia article)
en.wikipedia.org
2007-2008 Subprime Mortgage Crisis (Wikipedia article)
en.wikipedia.org

Dow Jones Industrial Average - Final push to $36,000?Dow Jones Industrial Average - Final push to $36,000? Will it happen during the First week in June? After price hits around $36,000, we may get a major pullback. We will have to monitor the market closely and expect volatility at that point. Expect some sort of shake up around early to mid June. We will see. For now the market is still bullish.

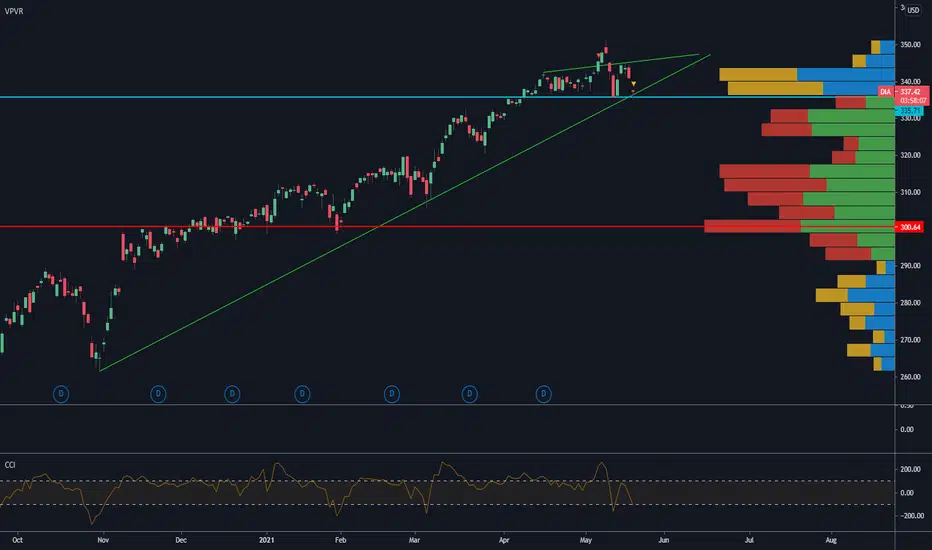
DIA - Tested the 50day - Long above the 50dayMAHowever; it hit the longterm trend support. Showing a nice reversal candle so far today.
If holds the 50day MA stay long.


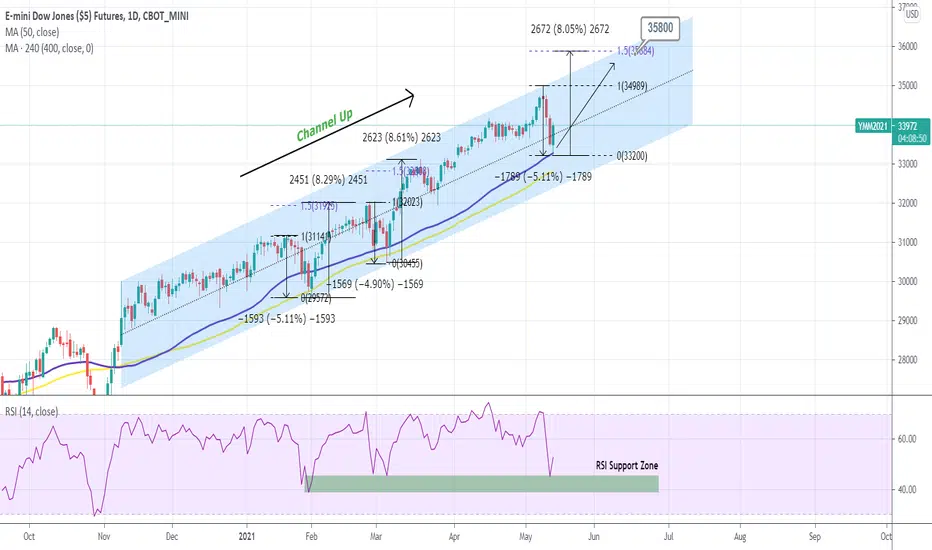
DOW JONES Buy SignalPattern: Channel Up on 1D.
Signal: Buy as the price hit the 1D MA50 (blue trend-line) and the zone within the 1D MA50 and the 4H MA400 (yellow trend-line) has been a buy opportunity within the Channel Up. Also the previous -5% pull-backs have been buy opportunities, both of which made a bottom within that zone. In addition, the RSI bounced on its Support Zone.
Target: 35800 (every such pull-back has rallied +8% to the 1.5 Fibonacci extension).
** Please support this idea with your likes and comments, it is the best way to keep it relevant and support me. **
--------------------------------------------------------------------------------------------------------
!! Donations via TradingView coins also help me a great deal at posting more free trading content and signals here !!
🎉 👍 Shout-out to TradingShot's 💰 top TradingView Coin donor 💰 this week ==> xBTala
--------------------------------------------------------------------------------------------------------