Diversification vs Concentration StrategyI get this question from time to time. Which is better ? Diversify your stock portfolio or place all bets in one sector ?
The answer really depends.
You heard of people becoming millionaires trading cryptocurrencies, high risk stocks like Gamestop, AMC Entertainment, IPOs, commodities and what have you.
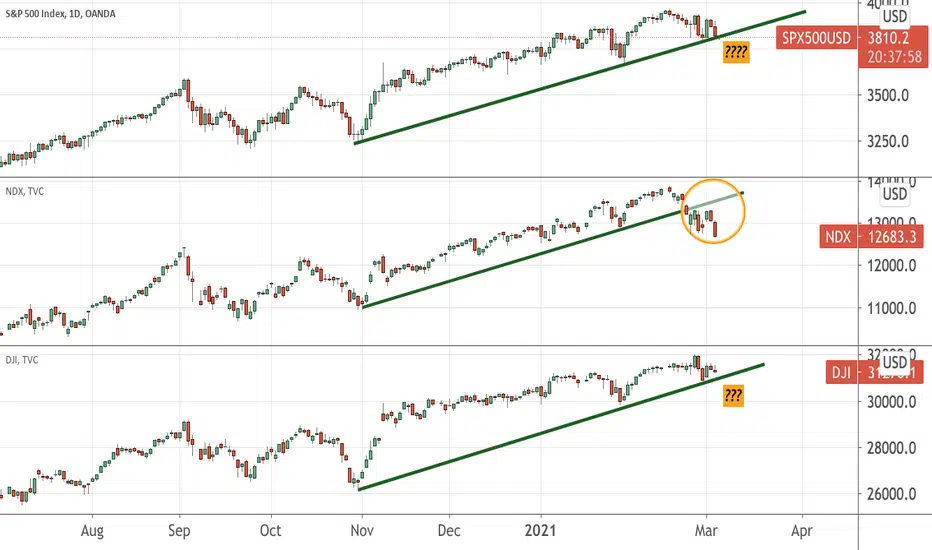
Personally, I prefer a diversified portfolio for a fairly simple reason. It is not easy to spot sector rotation where tech stocks are not falling out of favour and in are the banks, real estate, industrial stocks, etc.
So, that way, when my tech stocks are down, my other portfolio shore me up , leaving my overall portfolio in the green. Please note that all 3 indices are still in the bullish trend so a healthy correction of 5-10% is acceptable. It is not to be viewed as BEARISH market as some analysts or the media would want you to believe.
Of course, you may suffer had you bought in recently.
Another thing about this strategy is your domain knowledge of that sector. For example, if you are very familiar in a particular industry , say banks, then you would know how to value it differently from other traders/investors. Still, no one sector is 100% bullish nor bearish all the time but they go through cycles. You need not be an expert at catching at the exact top or bottom but participate at a fairly good price and you still can make good profits.
Think of the sector as a specific sport you like. If you spent a lot of time swimming, then you are going to improve on your strokes, stamina and speed as compared to someone who does it once a fortnight. Same for the sector - you do your research , review the charts more than others, you will spot more patterns, understand the "personality" of the chart and your confidence grow over time as you invest in it.
Others like to have a flavour of different sports as it is more fun that way. Like me, I love running, swimming, walking in the nature, etc. So, you know a bit of each sport but not deep enough to win medals at competition, so to speak.
In conclusion, there is no one fixed strategy for everyone. Find something that you like and you can relate to so doing the research work becomes fun.
Djia
DowJones/Gold (1w) - Critical momentDear Everyone,
We are at critical moment at Dow Jones Index. If you will compare that index to gold (which is the real store-of-value with stable inflation 2% annually), there is formed a W pattern (which is bullish). However, RSI and MACD indicator suggest that bullish continuation might be difficult - especially when we are at the neckline of the pattern.
IMO this doesn't look catastrophic and does not predict the severe dump in the imminent, however, multi-week smaller correction and than sideways could be very possible.
Regards,
Paweł

The Best (passive) Index SHORT in the world. - The Dow!The Title Chart is the DJIA/Nikkei225 - the best of them all.
Here are the rest;
This one is not very representative since it reflects the weakness in the Pound.
Still, it is a country-mile better deal than holding the Dow (Long).
Well, you get the idea as the rest of the worldwide indexes reflect the same story, across the board. (With the Asian Indexes leading the pack vs. the DJIA!)
One other, important issue to consider that these - above -declines haven't even factored in the Currency Differential(s) between between local currencies and the U$D. - Doing so, the Dow has an even grimmer future.

DJIA / Gold Ratio - SHORT; SELL it "forever"!!Well, at least for a generation - or two.
The long term Dow Jones Industrial Average:

DOW JONES (DJIA) – Week 10 – Bearish pressure increasing.The main stock market Indices had a strong session on Tuesday as Treasury yields backed off a bit. Dow Jones hit a record high before backing off with expectations that The House will pass the vote for the $1.9 trillion Biden stimulus bill on Wednesday.
Technically speaking, the price made a new historical high, reaching the 32180.0 level. At the moment it looks like this bullish move needs some space to breathe, as the price started to lose some momentum at the upper channel line.
We expect a bigger degree bearish pullback to take place, with a chance to find some support around the 30k level. If that area is breached, we anticipate the momentum to increase and continue towards our first target in order fill the GAP created at the beginning of November.
Trade with care.
Best regards,
Financial Flagship
Disclaimer: The analysis provided is purely informative and it should not be used as financial advice. Remember that you need a plan before you start trading; so, take this knowledge and use it as a guidebook that will ultimately help you understand the market and easily predict your next move

Dow jones generational top is inThis is it, I think the big one is coming. Easy short here not even worried, I cannot believe how easy this short trade is going to be.


NASDAQ LEVELS To Look Out ForNDX Holding the current support level at 12700. If the index breaks this level a re-test or a continued sell-off is in play.
Scenario 1: Re-test at 12400 or a re-test of the monthly low at 12200.
Scenario 2: A continued sell-off could force the price to test the 200 MA. A move to test the 200 MA would be mean this sell-off will approach -15%!
Nevertheless, as long as the index holds at 12700, we're looking bullish for the time being.


𝗖𝗵𝗮𝗿𝘁 𝗼𝗳 𝘁𝗵𝗲 𝗠𝗼𝗻𝘁𝗵: $DJI Monthly. Strong CandleBlowing out a 💫 w/ a large green candle and MACD looks very bullish
$YM_F $DIA $DJIA $QQQ $SPY $IWM $TLT $TNX $GLD $DXY $VIX $BA $GS $UNH $CRM $MSFT #Trading #Stocks #StockMarket 📈

MA200 TO STOP FOMODJIA current price suggests over extended and better to wait for price to revert to the mean - price is like an elastic band around MA200 normally a violent move one way leads to a similar the other way

How is it possible that the DJIA loses 90% of it's value? ..."It is very simple, really. First, it loses 50% of it's value and then, 80% of the remainder." - Answered Benjamin Graham, to a reporter, in a 1934 interview.

𝗕𝗼𝗲𝗶𝗻𝗴 𝗨𝗽𝗱𝗮𝘁𝗲: $BA Weekly. Time to Fly?Biggest trade last year for us were Leap Puts anticipating the massive diamond breakdown on this POS company. They somehow survived #737MAX crashes AND #COVID. Micro wave-3 looks to be starting
$DIA $YM_F $DJIA #Stocks #Trading #Boeing ✈️

US30/Nikkei225 - (Continuation) SHORT; SELL it until ...... it can be shorted no more!!
Here is the original post;
Been making stupid amounts of money in this spread, ever since!3
Obviously, this still has quite a few country miles left in it (SHORT). - Then, on the top of it, factor in the currency differential and Baam! ... Probably the best (passive) index trade out there, bar none.

V (DJI) - When Break Price Fly UpHumbled, we would like to thanks for your support who has already liked, commented and followed us.
Your support, strengthens us, to help in analyzing the market.
V (DJI) - When Break Price Fly Up

DJIA long trade ideaPlan: resistance level breakout --> wait for the price to bounce off from support level --> wait for the rejection candle pattern to form e.g. bullish engulfing, pinbar, etc --> BUY
**Disclaimer** the content on this analysis is subject to change at any time without notice, and is provided for the sole purpose of assisting traders to make independent investment decisions.
Traders!! if you like my ideas and do take the same trade as I do, please write it in a comment so we can manage the trade together.
_____________________________________________________________________________________________________________________
Thank you for your support ;)
GWBFX


Stock Indices video analysis $SPX In this video overview, we will take a look at the $SPX, $DAX, DJIA, NASDAQ, and Nikkei. Key levels are on test

I believe that Gold is gonna blow off then jump down.This is an early development but, I believe that since GOLD is in a downward trend in the short term, a breakout will occur but then once it reaches to 1950s, then I expect a drop-down or a continued up. Just a theory. The RSI is in the normal territory, which does not signal it is a blow-off or a blowdown but check the coming days and then see if an up is made or a down is amde. Warning! I am not a financial adviser and take this with a grain of salt. Happy trading!

WALL ST VS OIL CORRELATIONKeep an eye on the price of oil as there is a direct correlation with DJIA due to % of energy related stocks

Stock Indices video overview $NASDAQ $DAXIn this video overview you can see analysis for Indices $SPX $DJIA $NIKKEI $DAX
