US30 in support zonePEPPERSTONE:US30
It may go down a little further, but it is now in the support zone. Looking for a swing trade here to about the 61.8% Fibonacci Retracement. RSI is oversold.
Djia

DOW JONES Sell target hit. When will it reverse?Dow Jones (DJI) hit the 38050 Target that we set on our last bearish call (March 28, see chart below) and broke below Support 1 (February 13 Low) and the 1D MA100 (green trend-line):
The price now faces more selling pressure being below two MA periods and with the long-term Channel Up (started on the October 13 2022 bottom), having considerable downside to give. As we mentioned on our March idea above, the most effective buy entry within this long-term pattern is when the 1D CCI makes the first Higher Low after having broken below the -100.00 oversold barrier.
That is what happened on March 13 2023 and September 22 2023 (even though that sequence had one more Low to give). The most fascinating characteristic of both those corrective Legs was that they both declined by -9.25%. If Dow repeats this decline, we are looking at 36285, which is just above Support 2 but currently exactly where the 1D MA200 (orange trend-line) is.
The latter is our main point of focus and assuming the index will give a dead-cat-bounce now towards th 1D MA50 (blue trend-line), we project that it may hit the 1D MA200 around 36900. If that coincides with a 1D CCI Higher Low, it will be in our opinion the most optimal buy entry for the next long-term Bullish Leg, targeting 41000.
Note that the dead-cat-bounces on both previous Bearish Legs, never closed a 1D candle above the 0.618 Fibonacci retracement level, so that is the parameter that will keep the current correction valid. If we do get a 1D candle close above the 0.618 Fib, it will technically be a pattern invalidation and trend reversal upwards so we will buy the bullish break-out and Target 41000 regardless.
-------------------------------------------------------------------------------
** Please LIKE 👍, FOLLOW ✅, SHARE 🙌 and COMMENT ✍ if you enjoy this idea! Also share your ideas and charts in the comments section below! This is best way to keep it relevant, support us, keep the content here free and allow the idea to reach as many people as possible. **
-------------------------------------------------------------------------------
💸💸💸💸💸💸
👇 👇 👇 👇 👇 👇

Rising towards the upper trendline of the bearish channelDJIA (US30) has made a bullish reaction off the pivot and could potentially rise towards the 1st resistance.
Pivot: 37,672.13
1st Support: 37,164.30
1st Resistance: 38,025.73
Risk Warning:
Trading Forex and CFDs carries a high level of risk to your capital and you should only trade with money you can afford to lose. Trading Forex and CFDs may not be suitable for all investors, so please ensure that you fully understand the risks involved and seek independent advice if necessary.
Disclaimer:
The above opinions given constitute general market commentary, and do not constitute the opinion or advice of IC Markets or any form of personal or investment advice.
Any opinions, news, research, analyses, prices, other information, or links to third-party sites contained on this website are provided on an "as-is" basis, are intended only to be informative, is not an advice nor a recommendation, nor research, or a record of our trading prices, or an offer of, or solicitation for a transaction in any financial instrument and thus should not be treated as such. The information provided does not involve any specific investment objectives, financial situation and needs of any specific person who may receive it. Please be aware, that past performance is not a reliable indicator of future performance and/or results. Past Performance or Forward-looking scenarios based upon the reasonable beliefs of the third-party provider are not a guarantee of future performance. Actual results may differ materially from those anticipated in forward-looking or past performance statements. IC Markets makes no representation or warranty and assumes no liability as to the accuracy or completeness of the information provided, nor any loss arising from any investment based on a recommendation, forecast or any information supplied by any third-party.

$DJIA is breaking lower below the bearish flagAMEX:DJIA break below 39000 opened a new bearish wave cycles near-term and possibly long-term

DJIA H4 | Strong bearish momentumDJIA (US30) is exhibiting strong bearish momentum and could potentially extend this current downtrend.
Sell entry is at 37,770.60 which is a potential breakout level ( wait for 1-hour candle to close below 37,770.62 for confirmation ).
Stop loss is at 38,100.00 which is a level that sits above a pullback resistance.
Take profit is at 37,175.41 which is a pullback support.
High Risk Investment Warning
Trading Forex/CFDs on margin carries a high level of risk and may not be suitable for all investors. Leverage can work against you.
Stratos Markets Limited (www.fxcm.com):
CFDs are complex instruments and come with a high risk of losing money rapidly due to leverage. 66% of retail investor accounts lose money when trading CFDs with this provider. You should consider whether you understand how CFDs work and whether you can afford to take the high risk of losing your money.
Stratos Europe Ltd, previously FXCM EU Ltd (www.fxcm.com):
CFDs are complex instruments and come with a high risk of losing money rapidly due to leverage. 70% of retail investor accounts lose money when trading CFDs with this provider. You should consider whether you understand how CFDs work and whether you can afford to take the high risk of losing your money.
Stratos Trading Pty. Limited (www.fxcm.com):
Trading FX/CFDs carries significant risks. FXCM AU (AFSL 309763), please read the Financial Services Guide, Product Disclosure Statement, Target Market Determination and Terms of Business at www.fxcm.com
Stratos Global LLC (www.fxcm.com):
Losses can exceed deposits.
Please be advised that the information presented on TradingView is provided to FXCM (‘Company’, ‘we’) by a third-party provider (‘TFA Global Pte Ltd’). Please be reminded that you are solely responsible for the trading decisions on your account. There is a very high degree of risk involved in trading. Any information and/or content is intended entirely for research, educational and informational purposes only and does not constitute investment or consultation advice or investment strategy. The information is not tailored to the investment needs of any specific person and therefore does not involve a consideration of any of the investment objectives, financial situation or needs of any viewer that may receive it. Kindly also note that past performance is not a reliable indicator of future results. Actual results may differ materially from those anticipated in forward-looking or past performance statements. We assume no liability as to the accuracy or completeness of any of the information and/or content provided herein and the Company cannot be held responsible for any omission, mistake nor for any loss or damage including without limitation to any loss of profit which may arise from reliance on any information supplied by TFA Global Pte Ltd.
The speaker(s) is neither an employee, agent nor representative of FXCM and is therefore acting independently. The opinions given are their own, constitute general market commentary, and do not constitute the opinion or advice of FXCM or any form of personal or investment advice. FXCM neither endorses nor guarantees offerings of third-party speakers, nor is FXCM responsible for the content, veracity or opinions of third-party speakers, presenters or participants.

DOW JONES Secret Cycles you didn't know existed!On this analysis we examine the Dow Jones index (DJI) from the longer term perspective of the 1M time-frame. A lot of market participants has started to get nervous because of this month's pull-back and this is the best way to keep a calm mindset and view the price action objectively. In order to see if the market has a legitimate reason to panic or not, the answer can be given by observing the index from a cyclical point of view.
To begin with, the 1M MA50 (blue trend-line) has been the absolute multi-year Support level (since October 2010 only two candle closings below it, March 2020 COVID flash crash and recently the September 2022 inflation bottom). The market deems every pull-back towards it, a buy opportunity with the lowest possible risk.
Since the bottom of the 2008-2009 Housing Crisis, the 1M RSI bottoms on Lower Lows help us classify the multi-month phases into Cycles. The duration of each Cycle since the 1st, has been pretty consistent (39 to 48 months so far).
When the index closes a 1M candle below the 1W MA50 (red trend-line), the correction towards the 1M MA50 is usually under way. Also there is a striking consistency on the growth of each Cycle. As you can see, with the exception of the first (naturally the most aggressive since it was the start of the recovery after a Bear Cycle), every Cycle sees gains within the range of +70% and +77%.
As a result assuming the new Cycle follows a similar pattern, we can expect a minimum Target of 48850 (+70% from Low) and a Cycle ending on December 2025 (39 months from previous Low). Technically the index should peak around the the start of 2025, entering a volatile period towards the end of the year. This is as close to a projection one can make on such a long-term horizon and with tons of fundamental risks involved.
Where do you think Dow Jones will top at?
-------------------------------------------------------------------------------
** Please LIKE 👍, FOLLOW ✅, SHARE 🙌 and COMMENT ✍ if you enjoy this idea! Also share your ideas and charts in the comments section below! This is best way to keep it relevant, support us, keep the content here free and allow the idea to reach as many people as possible. **
-------------------------------------------------------------------------------
💸💸💸💸💸💸
👇 👇 👇 👇 👇 👇

DOW JONES below the 1D MA50 after 5 months!Dow Jones (DJI) gave us an excellent sell entry following our last analysis (March 28, see chart below) as it got rejected and made a bearish reversal exactly where we expected it to:
Last Thursday it even broke below the 1D MA50 (red trend-line) for the first time in exactly 5 whole months (since November 03 2023)! This is a bearish break-out confirmation signal and we expect a new sell-off soon.
As you can see the former (dotted) Channel Down broke downwards and has given way to a (blue) Channel Down. The 4H MA50 (blue trend-line) has now been turned into Resistance with one confirmed rejection already (April 04).
The Channel Down has fairly symmetrical Bearish Legs so far, -2.36% and -2.20%. Assuming the new will be at a -2.20% minimum, we are expecting a Lower Low at 38200.
-------------------------------------------------------------------------------
** Please LIKE 👍, FOLLOW ✅, SHARE 🙌 and COMMENT ✍ if you enjoy this idea! Also share your ideas and charts in the comments section below! This is best way to keep it relevant, support us, keep the content here free and allow the idea to reach as many people as possible. **
-------------------------------------------------------------------------------
💸💸💸💸💸💸
👇 👇 👇 👇 👇 👇

Overlap resistance at 61.8% Fibonacci retracementDJIA (US30) could rise towards the pivot which has been identified as an overlap resistance. Could this index stall around this level before potentially reversing to drow lower towards the 1st support?
Pivot: 39,042.57
1st Support: 38,560.25
1st Resistance: 39,412.72
Risk Warning:
Trading Forex and CFDs carries a high level of risk to your capital and you should only trade with money you can afford to lose. Trading Forex and CFDs may not be suitable for all investors, so please ensure that you fully understand the risks involved and seek independent advice if necessary.
Disclaimer:
The above opinions given constitute general market commentary, and do not constitute the opinion or advice of IC Markets or any form of personal or investment advice.
Any opinions, news, research, analyses, prices, other information, or links to third-party sites contained on this website are provided on an "as-is" basis, are intended only to be informative, is not an advice nor a recommendation, nor research, or a record of our trading prices, or an offer of, or solicitation for a transaction in any financial instrument and thus should not be treated as such. The information provided does not involve any specific investment objectives, financial situation and needs of any specific person who may receive it. Please be aware, that past performance is not a reliable indicator of future performance and/or results. Past Performance or Forward-looking scenarios based upon the reasonable beliefs of the third-party provider are not a guarantee of future performance. Actual results may differ materially from those anticipated in forward-looking or past performance statements. IC Markets makes no representation or warranty and assumes no liability as to the accuracy or completeness of the information provided, nor any loss arising from any investment based on a recommendation, forecast or any information supplied by any third-party.

Bearish momentum to extend?Could the DJIA (US30) extend its current downturn beyond the pivot point and drop toward a support level at 38,693.81?
Pivot: 39,078.84
Support: 38,693.81
Resistance: 39,329.55
Risk Warning:
Trading Forex and CFDs carries a high level of risk to your capital and you should only trade with money you can afford to lose. Trading Forex and CFDs may not be suitable for all investors, so please ensure that you fully understand the risks involved and seek independent advice if necessary.
Disclaimer:
The above opinions given constitute general market commentary, and do not constitute the opinion or advice of IC Markets or any form of personal or investment advice.
Any opinions, news, research, analyses, prices, other information, or links to third-party sites contained on this website are provided on an "as-is" basis, are intended only to be informative, is not an advice nor a recommendation, nor research, or a record of our trading prices, or an offer of, or solicitation for a transaction in any financial instrument and thus should not be treated as such. The information provided does not involve any specific investment objectives, financial situation and needs of any specific person who may receive it. Please be aware, that past performance is not a reliable indicator of future performance and/or results. Past Performance or Forward-looking scenarios based upon the reasonable beliefs of the third-party provider are not a guarantee of future performance. Actual results may differ materially from those anticipated in forward-looking or past performance statements. IC Markets makes no representation or warranty and assumes no liability as to the accuracy or completeness of the information provided, nor any loss arising from any investment based on a recommendation, forecast or any information supplied by any third-party.

So goes Apple so goes the market? The old wall street adage! so goes apple....
Were at a pretty interesting level.
Are market makers going to make this breakdown in apple easy?
A head & shoulders breakdown is now on watch for a confirmed break.
This does imply a decent down move and will undoubtedly weigh on markets if it happens.
Keep an eye on the second largest company in the world.

Bullish momentum to continue?The DJIA (US30) is rising towards a potential breakout level at 39,817.48 which has been identified as a pivot point. Could price potentially break through this level and rise higher towards the 1st resistance?
Pivot: 39,817.48
Support: 39,186.86
Resistance: 40,178.47
Risk Warning:
Trading Forex and CFDs carries a high level of risk to your capital and you should only trade with money you can afford to lose. Trading Forex and CFDs may not be suitable for all investors, so please ensure that you fully understand the risks involved and seek independent advice if necessary.
Disclaimer:
The above opinions given constitute general market commentary, and do not constitute the opinion or advice of IC Markets or any form of personal or investment advice.
Any opinions, news, research, analyses, prices, other information, or links to third-party sites contained on this website are provided on an "as-is" basis, are intended only to be informative, is not an advice nor a recommendation, nor research, or a record of our trading prices, or an offer of, or solicitation for a transaction in any financial instrument and thus should not be treated as such. The information provided does not involve any specific investment objectives, financial situation and needs of any specific person who may receive it. Please be aware, that past performance is not a reliable indicator of future performance and/or results. Past Performance or Forward-looking scenarios based upon the reasonable beliefs of the third-party provider are not a guarantee of future performance. Actual results may differ materially from those anticipated in forward-looking or past performance statements. IC Markets makes no representation or warranty and assumes no liability as to the accuracy or completeness of the information provided, nor any loss arising from any investment based on a recommendation, forecast or any information supplied by any third-party.


Resistance overhead?The DJIA Index (US30) could rise towards an overlap resistance at 38,911.37 which has been identified as a pivot point. Could price potentially reverse around this level to drop lower?
Pivot: 38,911.37
Support: 38,494.85
Resistance: 39,294.29
Risk Warning:
Trading Forex and CFDs carries a high level of risk to your capital and you should only trade with money you can afford to lose. Trading Forex and CFDs may not be suitable for all investors, so please ensure that you fully understand the risks involved and seek independent advice if necessary.
Disclaimer:
The above opinions given constitute general market commentary, and do not constitute the opinion or advice of IC Markets or any form of personal or investment advice.
Any opinions, news, research, analyses, prices, other information, or links to third-party sites contained on this website are provided on an "as-is" basis, are intended only to be informative, is not an advice nor a recommendation, nor research, or a record of our trading prices, or an offer of, or solicitation for a transaction in any financial instrument and thus should not be treated as such. The information provided does not involve any specific investment objectives, financial situation and needs of any specific person who may receive it. Please be aware, that past performance is not a reliable indicator of future performance and/or results. Past Performance or Forward-looking scenarios based upon the reasonable beliefs of the third-party provider are not a guarantee of future performance. Actual results may differ materially from those anticipated in forward-looking or past performance statements. IC Markets makes no representation or warranty and assumes no liability as to the accuracy or completeness of the information provided, nor any loss arising from any investment based on a recommendation, forecast or any information supplied by any third-party.

Potential bullish bounce?The DJIA Index (US30) could fall towards a pullback support at 38,151.50 which has been identified as a pivot point. Could price potentially reverse around this level to bounce higher?
Pivot: 38,151.50
Support: 37,093.60
Resistance: 39,303.36
Risk Warning:
Trading Forex and CFDs carries a high level of risk to your capital and you should only trade with money you can afford to lose. Trading Forex and CFDs may not be suitable for all investors, so please ensure that you fully understand the risks involved and seek independent advice if necessary.
Disclaimer:
The above opinions given constitute general market commentary, and do not constitute the opinion or advice of IC Markets or any form of personal or investment advice.
Any opinions, news, research, analyses, prices, other information, or links to third-party sites contained on this website are provided on an "as-is" basis, are intended only to be informative, is not an advice nor a recommendation, nor research, or a record of our trading prices, or an offer of, or solicitation for a transaction in any financial instrument and thus should not be treated as such. The information provided does not involve any specific investment objectives, financial situation and needs of any specific person who may receive it. Please be aware, that past performance is not a reliable indicator of future performance and/or results. Past Performance or Forward-looking scenarios based upon the reasonable beliefs of the third-party provider are not a guarantee of future performance. Actual results may differ materially from those anticipated in forward-looking or past performance statements. IC Markets makes no representation or warranty and assumes no liability as to the accuracy or completeness of the information provided, nor any loss arising from any investment based on a recommendation, forecast or any information supplied by any third-party.

DOW JONESPair : DJI - Dow Jones
Description :
Bullish Channel as an Corrective Pattern in Short Time Frame
Break of Structure
RSI - Divergence
Completed " 12 " Impulsive Waves

We might see new ATH in DJIA (US30) soon 41k levelsNow I changed my view on all global Indices, any dip looking forward to buy the dip. My stop losses is in place and tight stop losses for now until it breaks last month high. I think we are in major wave 5 and we are in 3(5) in minor cycle considering Elliot wave theory.
this is just my study and I might change my view depending on price action.

TARGET REACHED - And ongoing to Target 2 - 40,0042The trade analysis we had for Dow Jones couldn't have played out better.
On paper and theory, this just rocked to its first target 37,242.
But then, it entered into a trending market. This is where it's very tough for breakout traders to get in.
This is very tough for reversal traders to trade.
This is very tough for range bounded trades to buy and sell.
So, all we can do is wait for the trend to continue up and form a new pattern. Or continue holding and raising the trailing stop loss each week.
But it looks like the next target is set for 40,0042.
I'll wait and observe as it feels top heavy and I don't really have a good strategy to get in right now.

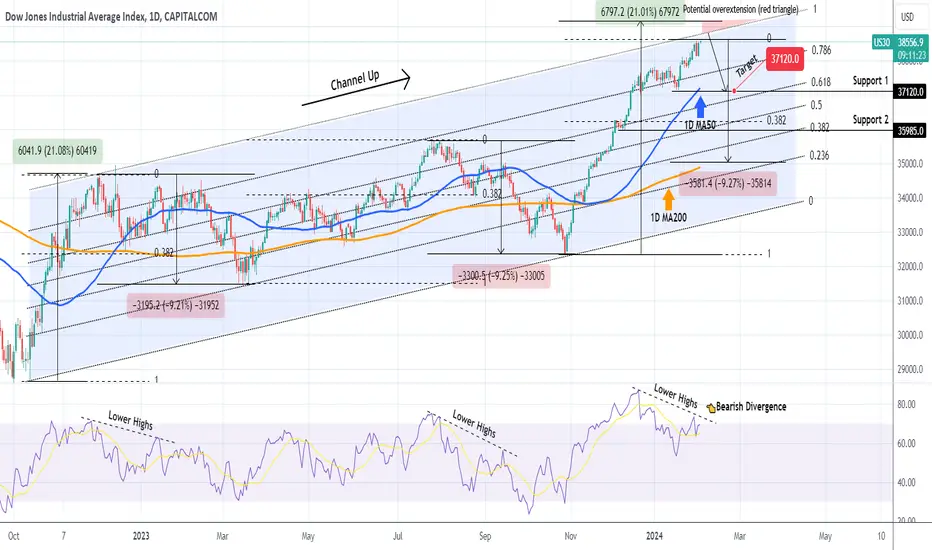
DOW JONES at the top of the 18month Channel Up. Medium-term SellDow Jones has been trading within a 18-month Channel Up pattern since the October 13 2022 global market bottom. The current price action is approaching its top (Higher Highs trend-line) for the first time in more than 1 year (since December 13 2022). With the 1D RSI on Lower Highs, which is a Bearish Divergence against the Higher Highs of the price action, the current levels are a strong candidate for a medium-term pull-back.
Even though we are past the transition year of 2023, which got the index out of the 2022 Bear Cycle and into the new Bull Cycle, thus we do not necessarily need a strong correction like those of August - October 2023 and December 2022 - March 2023, a smaller technical pull-back would be natural to normalize the overbought technical indicators and extend the long-term bullish trend.
As a result, we are targeting at least 37120, which is Support 1 and just above the 0.618 Fibonacci Channel level, the first target of the December 19 2022 pull-back and a typical % correction similar to August 24 and May 25 2023.
Not that the 1D RSI was under a Lower Highs trend-line both during the August 2023 and December 2022 corrections. Interestingly enough, both corrected by -9.20%, so technically we can see a correction as low as the 1D MA200 (orange trend-line) and the 0.236 Fibonacci Channel level at 35000 (even though it is less likely unless very negative fundamentals hit the market). Also it is worth pointing out that there is a technical maximum extension above the Channel Up, which is the red Triangle, in case the current Bullish Leg of the pattern goes for a +21% rise, like the December 01 2022 did.
-------------------------------------------------------------------------------
** Please LIKE 👍, FOLLOW ✅, SHARE 🙌 and COMMENT ✍ if you enjoy this idea! Also share your ideas and charts in the comments section below! This is best way to keep it relevant, support us, keep the content here free and allow the idea to reach as many people as possible. **
-------------------------------------------------------------------------------
💸💸💸💸💸💸
👇 👇 👇 👇 👇 👇
New all time high by end of JanFollowing DJI and NDX, SPX is on its way to ATH by the end of January.

Cup with Handle on IBM Attempting to Break $140 Resistance LevelWe have a nice looking Cup with Handle on IBM and it's currently Challenging the $140 Psychological Resistance Level, if it can get above that i think we will see IBM's stock price push towards the $175-$180 measured move. On a side not i also believe the Dow will be the strongest performing Maor US Index and reach all time highs before any other index and that IBM will be one of the more major stock leading the way along with Microsoft and Intel.

$US30 is reaching the top of the five upside wavesBLACKBULL:US30 reached the most important resistance 38000 level which can be seen also as the fifth wave of the five upside waves and can lead to a reversal lower if see a rejection like it is happening now. Look for the short trade entries

$DJIA s reaching the rising wedge resistanceAMEX:DJIA has reached the rising wedge resistance 38000 and here it will either break above or reverse for a healthy pullback. Watch the analysis

🅱️ Bitcoin Is The Dow Jones In 1968 | Elliot Wave TheoryBack in 1968 the two major proponents of the Elliot Wave theory concept where divided as to the wave count of the DJIA.
While AJ Frost would consider the 1966 peak as Wave B of an irregular top in a flat correction, Hamilton Bolton was looking at it as the 5th wave of a bullish impulse.
One thing is certain, while they disagreed on the count they both agreed that what should follow was a new bull-market regardless of the count and they were right.
We ended up with a triple zig-zag followed by a new bull-market:
We have the same situation today with Bitcoin, people are divided between the third and fifth waves.
One interpretation calls for the top to be April 2021 with the low in November 2022 being Wave C of a flat and Wave 4 of the impulse in a higher degree:
While some others are calling for new lows taking the November 2021 irregular top as Wave 5 of the bigger impulse:
Well, there is actually a big difference with the Dow Jones forecasters from the past.
While they had a different count as to the irregular top, both agreed that what would be now equivalent to the November 2022 low in Bitcoin was the bottom in the Dow Jones before a new major leg up or bull market, our Cryptocurrency analysts, some, are still divided between new lows and a new bull-market.
Now, let me offer you my count, it is pretty simple.
The 2017 peak is definitely the end of a major 5-up wave, no doubt about that, we can easily draw a 5-up wave pattern with multiple extensions.
What follows is a correction, you can draw it in any way you like and here we have an A-B-C or Zig-Zag from Dec. '17 to Dec. '18.
The next wave can be either an inverted Zig-Zag or another 5-up wave, makes no difference, from Dec. '18 through June '19.
This is followed by another correction ending in March 2020 and here a new 5-up wave pattern starts.
From March 2020 through April 2021 we have another impulse and April 2021 marks the orthodox end of this bull market.
What follows is a correction, classic EW theory and you can see it on this chart.
If you want to be conservative or lets just say not bullish, you can say that another correction can follow after the Nov. 2022 low, this is possible and you can draw an upward Zig-Zag or whatever you like, we can only really confirm the wave count in retrospect.
But, if you consider go past market action and the way Elliot Wave theory works, we are set for a new 5 waves up impulse.
Which is really just the fifth wave of a higher degree since the correction from April 2021 through November 2022 is only Wave 4, which tends to be complex, hard to read and long. We have all these characteristics here...
Bitcoin is going bullish... Can any Elliotter confirm/comment if I am right or wrong?
Namaste.
