DOW JONES Best buy entry on a 7 month basis.Dow Jones is approaching Support (1) and the Rising Support of the 2023 Channel Up.
The Support (1) level has been holding for 5 months.
Based on the Falling Resistance that initated the current correction and the rejection on the MA50 (1d), the price action is identical to November 2022 - March 2023 so far.
Trading Plan:
1. Buy on the current market price.
Targets:
1. 34800 (Falling Resistance).
Tips:
1. The Sine Wave tool very accurately displays the Cycle of peaks and bottoms since late 2022 and shows the price is on the most optimal bottom buy level time wise.
Please like, follow and comment!!
Notes:
Past trading plan:
Djia

DOW JONES: Support Zone intact. Buyers are favored short term.Dow Jones is volatile on the 4H timeframe (RSI = 37.485, MACD = -170.620, ADX = 29.943) after almost testing the S1 level (32,813) yesterday but following a 4H MACD Bullish Cross formation, it is a low risk buy opportunity. The rejection of the previous rise took place on the 4H MA200, so that is our target again. Buy and TP = 33,700.
## If you like our free content follow our profile to get more daily ideas. ##
## Comments and likes are greatly appreciated. ##

DOW JONES The bottom isn't in yet.Dow Jones may be trading inside a long term Channel Up but the medium term pattern is a Bearish Megaphone.
The last Bottom of the Channel Up was closer to the 1week MA200, this time the MA level is even closer, a strong candidate for a bottom.
The previous correction leg made a -10.15% extension, a new one of this size meets almost perfectly the bottom of the Channel Up and a little over the 1week MA200.
Sell to 32400 then reverse to buying and target 33600 (1week MA50).
Follow us, like the idea and leave a comment below!!

DOW JONES: Strong short term buy signalDow Jones is on a range with the 1H timeframe neutral (RSI = 46.672, MACD = -41.790, ADX = 29.739), giving us an opportunity to buy the decline of the last three days and target the 1D MA50 (TP = 34,000). Technically this consolidation, even on 1D RSI structure which is inside a Rectangle, mimics early September. The medium term trend remains bearish inside a Bearish Megaphone but the long term bullish inside a Channel Up.
See how well our prior idea has worked:
## If you like our free content follow our profile to get more daily ideas. ##
## Comments and likes are greatly appreciated. ##

DOW JONES Inverse Head and Shoulders signals for a new buyDow Jones (DJI) has completed an Inverse Head and Shoulders (IH&S) pattern and this week's pull-back, caused by a rejection on the 4H MA200 (orange trend-line), may be the last before it starts rising to a new Higher High. We are taking this opportunity to buy for the short-term and target the top of the dashed Channel at 34200. The IH&S can complete its long-term target on the 2.0 Fibonacci level (35000) after it breaks above the Lower Highs trendline.
-------------------------------------------------------------------------------
** Please LIKE 👍, FOLLOW ✅, SHARE 🙌 and COMMENT ✍ if you enjoy this idea! Also share your ideas and charts in the comments section below! This is best way to keep it relevant, support us, keep the content here free and allow the idea to reach as many people as possible. **
-------------------------------------------------------------------------------
💸💸💸💸💸💸
👇 👇 👇 👇 👇 👇

$DJI - Rising Trend Channel [MID-TERM]💡 Pattern: Cup & Handle
💡 RSI: Neutral
💡 Risk: Low
✅ Resistance: 34200
✅ Support: 32800
PERFORMANCE
🔴 ST: NEGATIVE
🔴 MT: NEGATIVE
🟡 LT: HOLD
*ST: Short-term | MT: Mid-term | LT: Long-term
Verify it first and believe later.
WavePoint ❤️

DOW JONES May be starting a new Bull rally under our nose..Dow Jones (DJI) is printing on its RSI on the 1W time-frame an astonishingly symmetric Higher Lows pattern as 2015/ 2016. As with today, the price was within a Rising Wedge at the time, making a fake-out bearish break but still was emphatically supported by the lower Bollinger. In fact the Bollinger Bands have been instrumental in containing the price action.
It we are indeed (based on the 1W RSI) on a bottom similar to October 31 2016, then a very aggressive Bull rally is about to begin. And as always the majority isn't taking notice.
-------------------------------------------------------------------------------
** Please LIKE 👍, FOLLOW ✅, SHARE 🙌 and COMMENT ✍ if you enjoy this idea! Also share your ideas and charts in the comments section below! This is best way to keep it relevant, support us, keep the content here free and allow the idea to reach as many people as possible. **
-------------------------------------------------------------------------------
💸💸💸💸💸💸
👇 👇 👇 👇 👇 👇

DOW JONES Small pull back on the cards.Dow Jones hit the 1day MA200 yesterday and failed to close over it.
As a result, the price got rejected and started pulling back today.
Based on the 1day RSI, we could be in a minor corrective candle similar to March 22nd, which found Support between the 0.618-0.786 Fibonacci range.
Buy on the 0.618 Fibonacci and target 35000 (Resistance A).
Previous chart:
Follow us, like the idea and leave a comment below!!

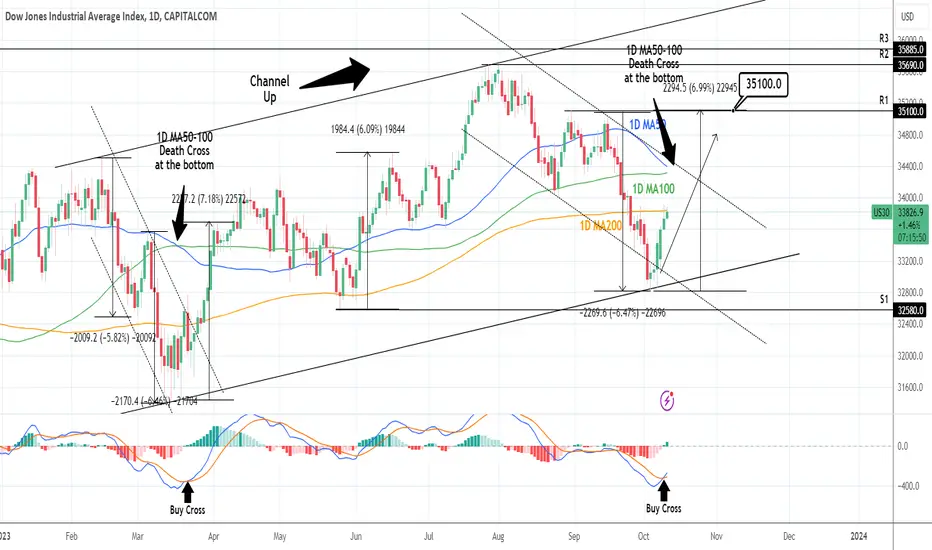
DOW JONES: This is only the beginning of the recovery.Dow Jones touched yesterday the 1D MA100 and with it turned the 1D technical outlook neutral (RSI = 47.338, MACD = -251.570, ADX = 41.460). As presented last time (see idea link at the bottom) the rebound level was the bottom of the Channel Up and now that is confirmed as the 1D MACD formed a Bullish Cross.
Much like the bearish wave of February-March, the 1D MA50-100 Bearish Cross signifies the bottom and the beginning of a new long term rally. Since the drop has been remarkably similar (both -6.46%) it is possible that the rise will be proportional too (+7.18%). This will be a little over the R1 level (TP = 35,100).
Prior idea:
## If you like our free content follow our profile to get more daily ideas. ##
## Comments and likes are greatly appreciated. ##
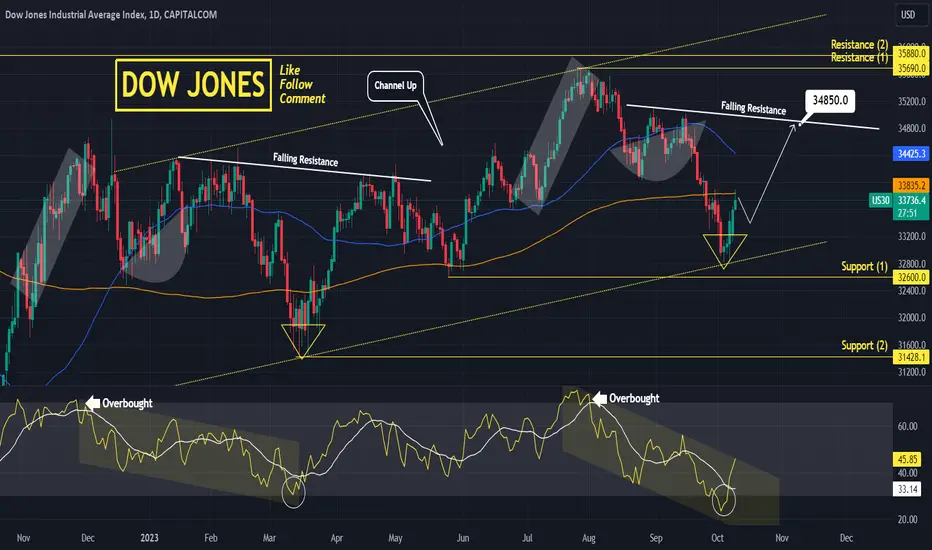
DOW JONES has considerable upside potential targeting 34850.Dow Jones touched the MA200 (1d) today after bouncing off the bottom of the Channel Up.
This is a standard V shaped reversal, much like the one in March.
Trading Plan:
1. Buy on the next MA200 (1d) break out.
Targets:
1. 34850 (Falling Resistance contact in similar fashion with April 14th).
Tips:
1. When the RSI (1d) is rebounding after being oversold, which is what took place on the March 13th Low. The two patterns are identical, this is why we expect the same target symmetry as then.
Please like, follow and comment!!
Notes:
Past trading plan:
Dow Jones 10/10 MoveDow Jones - DJI
Description :
Bullish Channel as an Corrective Pattern in Short Time Frame and it has Breakout the Lower Trend Line , It will Complete its Retracement at Previous Strong Support or till its Lower Trend Line at Fibonacci Level - 61.80% / 78.60%
Entry Precautions :
Wait until it Rejects with Strong Bearish Price Action

DOW JONES Channel Up Double Bottom. Solid buy entry either way.Dow Jones (DJI) is rising following a vastly oversold 1D RSI reading (reached even 23.60) at the bottom of the (blue) Channel Up. Based on the RSI pattern itself, we can draw comparisons with the December 2022 - March 2023 correction. According to that the 1D RSI has one more Low to make before it bottoms and that bottom will be leg (e). This will justify the emergence of a diverging Channel Up (dotted), where leg (e) will be its Higher Low while also completing a symmetrical -9.30% decline from the top.
Still, the price has dipped well below the 1D MA200 (orange trend-line), which was March's bottom formation, thus either entry is equally probable. As a result it is best to buy on both levels so that a low risk indeed opportunity won't be missed. Our target is 35000, which is the 0.786 Fibonacci retracement level as well as Resistance 1.
-------------------------------------------------------------------------------
** Please LIKE 👍, FOLLOW ✅, SHARE 🙌 and COMMENT ✍ if you enjoy this idea! Also share your ideas and charts in the comments section below! This is best way to keep it relevant, support us, keep the content here free and allow the idea to reach as many people as possible. **
-------------------------------------------------------------------------------
💸💸💸💸💸💸
👇 👇 👇 👇 👇 👇

Forget Soft, Hard Or No Landing, Higher For Longer...Is the Stock Market Dead Money For The Next 10-20 Years?
So much of how our markets work is based on optimism. Can you imagine being a money manager and your entire sales pitch is some negative diatribe about how the market is going down and will continue to go down?
Would you fork over your hard-earned savings based on such a story? Not a successful plan of attack for a person trying to raise capital if you ask me.
However, therein lies the disconnect between what is really going on in today’s market, versus what the average person reads and hears in the financial news. The same optimistic money managers sponsor those articles or those TV shows. Would your business buy an ad on a show or in a magazine that constantly gave a negative outlook on your business?
I’ve always considered myself an optimist. However, nowadays, I find nothing to be optimistic about with respect to the US stock markets. The reason is, my prevailing analytical thesis is, the markets are now entering a long-term cycle in which many aspects of our economy will be reverting to their respective long-term mean. From interest rates, to income inequality. This time frame, I refer to, is meant to be a reset in expectations. If I am correct in my analysis, this will unfold over a long period of time. During this period, many of old correlations and metrics used to determine the value of the stock market, assets in general, (housing, for example) will break down and end up becoming less useful to those who fundamentally analyze assets, stocks and the markets for a living. The cycle I am referring to is one in which none of the current market participants have experienced. Now before you draw a hasty conclusion, and think this article is about me warning you, the reader, a 1987 stock market crash scenario is on the horizon, I’ll caution you. It is not.
However, my analysis shows that the market will essentially become dead money for at least the next decade or two. That means buying most market-based asset classes, and holding them, will not produce the desired results of the past.
Please indulge me while I provide some background and explain.
I practice a form of market analysis that is exclusively focused on price action. I guess you could sum up my work by styling me as a pattern analyst. That means stock market news, events, corporate earnings and all external data is of little concern to me as I carry out my day-to-day analysis on the SP500. I never take those external events into account while analyzing any of the markets I cover. I watch the patterns market participants create with their buys and sells. I study those patterns across the many markets I cover and over both the short and extremely long periods of time. One could say I took my mother’s advice to heart, and watch what they do, not what they say. It’s the law large crowds, and the larger the crowd, the more accurate the forecast. The SP500 contains one of the largest crowds assembled. Each day it involves millions of participants, exchanging large volumes of assets for vast sums of money. Suffice to say, my work can produce some scary accurate forecasts based on the participation of the crowds in those markets.
A final anecdote to explain my work lies in a simple experiment I observed some time ago on YouTube. To illustrate the power of large crowds, a YouTuber decides to conduct an experiment. The individual fills a large mason jar with marbles. The half gallon sized mason jar is now brimming with marbles, and the metal lid is twisted on, sealing the jar. The individual then attends a local carnival and sets up a booth to solicit guesses as to the total amount of marbles contained in the mason jar. Volunteers are asked to simply observe the jar, and write down their guesses on a post-it-note. After collecting a large number of post-it-notes, the guesses are entered into a spreadsheet. Next, the marbles are emptied on a carpet and counted. 1340 marbles. Comparing the spreadsheet data, the conclusion was, although some volunteers came close in guessing the correct number of marbles, no one guessed correctly. Guesses ranged from as low as 300 to as high as 3,000. A seemingly random data set. However, under further examination, the average of the total guesses were 1335 marbles. This simple experiment explains the legitimacy of some sort of “inexplicable collective consciences” when involving a large crowd.
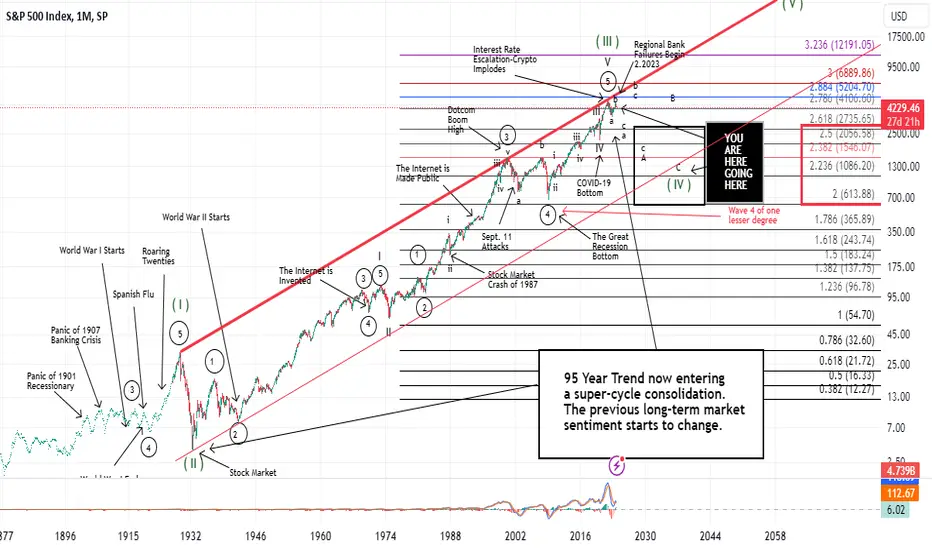
My current bearish perspective manifests itself in this same notion of the large crowd of market participants but over an extremely long-time frame of the SP500 (INDEXSP: .INX).
Below is a chart of the price action of the index from inception.
To put a simple explanation on the chart above. Since the stock market crash of 1929, the price pattern of the SP500 has essentially advanced in a 45-degree angle higher. I will spare you my explanation of the labeling of the chart as to not bore you as those details do little to further my explanation of the analysis. However, I will state that all our society has achieved since in the last 150 years is notated on the above chart. The advancement of technology, medicine, communication, war and peace is all included. For me, this becomes a visual picture of some of the best and worst times humanity has experienced during this time. What is compelling, is some of those pivotal moments barely stands out on the chart.
Fast forward to today.
After almost a 100-year price advance from the 1929 crash, we are now entering a prolonged period of digesting all those gains. I cannot over emphasize that this area of consolidation I forecast is 100% natural and should be no cause for alarm from a pattern analysis standpoint. As stated, that is a simplified explanation of what a super cycle event wave (IV) accomplishes. Additionally, our last Supercycle event, labeled (II), is an area of digesting gains that was hastened once the events of the Spanish Flu of 1918 were behind us and that pent-up demand was unleased. In the US, those times are referred to as the roaring twenties. Cyclically there are many character similarities in our wave (II) and our current wave (IV). Chief among them was a global pandemic and the aftermath. However, in my form analysis, a wave (II) and a wave (IV) are supposed to alternate in terms of time duration and retracement depth. If one takes place over a short period of time, the other should be long. I can see this sort of alternation I refer to take place every day, as it pertains to the very short timeframes. These patterns, whether long or short term, tend to be fractal in nature. Meaning, if you removed the dates and timeframes from a 1-hour chart of the SP500 and a 150-year chart (like the one displayed above) they would look strikingly similar. To a pattern analyst, like myself, I would be unable to discern what timeframe I was looking at. Nonetheless, the patterns would be instantly recognizable. Because these fractals form and complete on the smaller timeframes, through observation we can forecast the same effects on the much longer time duration charts. These fractal patterns tend to be self-similar and repeating.
In conclusion, if what I see unfold each and every day is indeed similar and repeating when observing a price pattern that is 150 years in the making, the conclusion will be a decade or two of dead money due to a long-term cyclical digestion of gains. Call it a “massive reversion to the mean event”. From things like interest rates to income inequality, a total reset to longer term norms.
Additionally, if my analysis is correct, the January 2022 stock market highs will not be breached for a very long time to come. This will be a time where investors will be forced to become more creative and pickier, as it pertains to seeking a return on capital.

US is running a clinic on how to self-inflict financial woundsEarlier today I was on a conference call with traders examining the index price patterns and discussing the initial price action of The SP500 (INDEXSP: .INX) and the Nasdaq (INDEXNASDAQ: .IXIC) off their July highs. Currently my company is forecasting we revisit, and ultimately breach the October 2022 lows sometime in the first half of 2024. However, what the catalysts are to get us there is speculation. A black swan event of such some stature would need to unfold.
Mid conference call one of the attendees’ types into the zoom chat box, "McCarthy was just removed as speaker!" On the call was a collective...whoa!
I could understand some of you reading this article would say, so what! The US congress has been dysfunctional for some time now. Unfortunately, I would agree and could not find fault with such apathy. However, consider the unintended consequences of such a historic action. Never has a US speaker of the house been removed in such fashion.
What could develop into unintended consequences?
Which such acrimony and division in the lower chamber how can the house agree on anything? The hill conservatives in the house want to die on is the growing national debt. Whether that is disingenuous or not is not the point of this article. I'll let the political pundits argue that. I want to keep this article focused on what is directly related to the US markets.
Government Funding
Through some rare bipartisanship we averted a government shut down just this past weekend. Leading up to this weekend, the news media had all but written the obituary for a funded government through regular order. However, the legislation only funded the government for 47 days. That means it's possible we're back to worrying about a funded US government next month.
Rating Agencies
I have to admit when Fitch downgraded the credit rating of US government debt in August, I was skeptical of that decision. In retrospect, I now understand with all the self-inflicted uncertainty. However, do we need to now worry about Moodys and Standard & Poors. What is the consequence to interest rates if the US credit rating becomes under assault.
Interest Rates
The US markets have yet to acknowledge high interest rates are a structural headwind for company earnings and by extension, the market as a whole. Case in point, the below chart shows the yield on the 10y treasury.
10-year US Treasury Chart
Today, yields are higher than when at the October 2022 lows. The uncertainty created today by historically removing a US speaker of the house does not scream the US should be getting a lower rate on it’s debt. No, it most certainly means the opposite.
Mortgage Rates
12% of US GDP is housing. Aside from Fed action, if rates now go up because of the added uncertainty, we could easily go from positive to negative GDP. No US sector is more rate sensitive than housing.
Consumer Spending
If you thought housing at 12% of GDP was large, the consumer represents 70%. From mortgages, to credit card debt, the consumer was already starting to slow. Higher rates due to uncertainty will cause the consumer recoil, and that's the ballgame.
I could go on about current labor strikes in America and how that could change the employment outlook and the economy on a dime. I could discuss in depth the quantitative tightening action of the federal reserve. All concerns we're currently trying to weigh its impact on the economy.
Now we have to deal with this new added uncertainty. It appears in the US we know how to run a clinic on self-inflicted wounds.
Are the Bears about to get BOLD?In my latest installment of the repeating Sentiment chart, we get a front row seat on how trader sentiment ebbs and flows with price action. Once we hit the target of 4172-4180, that will be a function of the bearish thesis getting aggressive.
A complete unwinding of the utter junk spewed on CNBC a month ago. New highs possible? Soft landing? The magnificent seven? I stand by the comment I made in my trading room yesterday... CNBC is the most detrimental content I professional trader can ingest.
Why is Tom Lee not on CNBC today? LOL...
Stay safe out there.
Chris

DOW JONES Bottom formation buy only on the short term.Dow Jones is priting a bottom on the newly emerged Channel Down which calls for a short term buy.
The same kind of formation was witnessed in middle March on the long term bottom pricing when the (recently broken) Channel Up started.
Trading Plan:
1. Buy on the current market price.
Targets:
1. 34400 (MA50 1d).
Tips:
1. The RSI (1d) is on the 30.00 oversold support. Same as on March 13th. An additional buy indicator.
Please like, follow and comment!!
Notes:
Past trading plan:
DOW JONES Channel Down bottom buyDow Jones / US30 hit the bottom of the Channel Down that is correcting the index to the Rising Support of the larger Channel Up pattern.
It did cross under the 1day MA200 (bearish) but on the other hand the 1day RSI is rebounding on the Oversold Support (bullish) like on the March 13th low.
Keep a tight SL on the low of the bottom candle and buy. Target 34400 (1day MA50).
Previous chart:
Follow us, like the idea and leave a comment below!!

All Targets Hit in the SP500 FuturesToday we hit my long standing targets and so far have bounced.
I have carried an orange bullish count and a bearish blue count on this chart for a while now. If we can develop an impulsive 5-wave structure up that breaches 4508. I'll remove the bearish blue count targeting 4030-4060.
Should we rally in a corrective 3-wave manner and fail to take out key resistance, then breach today's LOD at 4277.25. Then I will remove the orange bullish count.
Best to all,
Chris
Weekly Update: Why is the Street Asleep at the Wheel?Post 2009 Financial Crisis, they made movies about the housing and economic downturn. Here’s the thing, there are over 10M financial advisors, money managers, hedge fund managers, and fundamental and technical analysts in the industry. This doesn’t include the geniuses in the Financial News business. However, why did only a hand full of that total population (less than a dozen) see the SPX dropping 60% from 1587 to 666 in a matter of 5 months?
Did you watch the movies?
Because the reason was on average, housing has always been a 3-5% asset yielding per year over the long term. There was no way the housing market was going to crash. 10M smart people and only a dozen got it right? What does that say about the other 9.999M smart people in the industry?
No, I’m not writing about how I am smarter than 10M professionals in the industry, but you have to admit, by and large, EVERYONE IN THE INDUSTRY got it wrong. It's easy to manage money when the market just goes up for 100 years...what about when that is no longer the case. During the very long cycle paradigm shifts, the old norms no longer apply.
In my opinion, they’re cranking up the ignorant train once again. I’ll attempt to over simply this.
INTEREST RATE REVERSION TO THE MEAN
Most market participants are not used to interest rates at 10%...I on the other hand, used to think 10% was competitive. But long-term cycles being what they're are, their purpose is to clean the slate, re-educate participants, get rid of the old and welcome the new, all while reverting back to an equilibrium or a cycle norm.
I'm curious when the street will stop discussing soft landing, no landing, higher for longer, etc. Start concerning themselves with how our economy looks and functions next year, the year after that, and 5 years from now in a long-term rising interest rate environment. I have a feeling the 10M in the financial services industry will shrink, and those smart people, will have get a lot smarter to survive.

DOW JONES Approaching a critical Support cluster.The Dow Jones index (DJI) has broken below the long-term Higher Lows trend-line and has transitioned into a Channel Down. The current Lower Lows leg is approaching not just the bottom of the Channel Down but more importantly the 1D MA200 (orange trend-line) and the 1W MA50 (red trend-line). The latter in particular provided a Double Support Bounce on (June 01 and May 25) and hasn't been broken since March 29.
We are waiting for the first 2-day green 1D candle streak in order to buy and target (at least) the 1D MA50 (blue trend-line). Projected contact at 34450 (target). The 1D RSI has hit the 34.80 Support, which provided the bounce on the August 24 bottom.
-------------------------------------------------------------------------------
** Please LIKE 👍, FOLLOW ✅, SHARE 🙌 and COMMENT ✍ if you enjoy this idea! Also share your ideas and charts in the comments section below! **
-------------------------------------------------------------------------------
💸💸💸💸💸💸
👇 👇 👇 👇 👇 👇

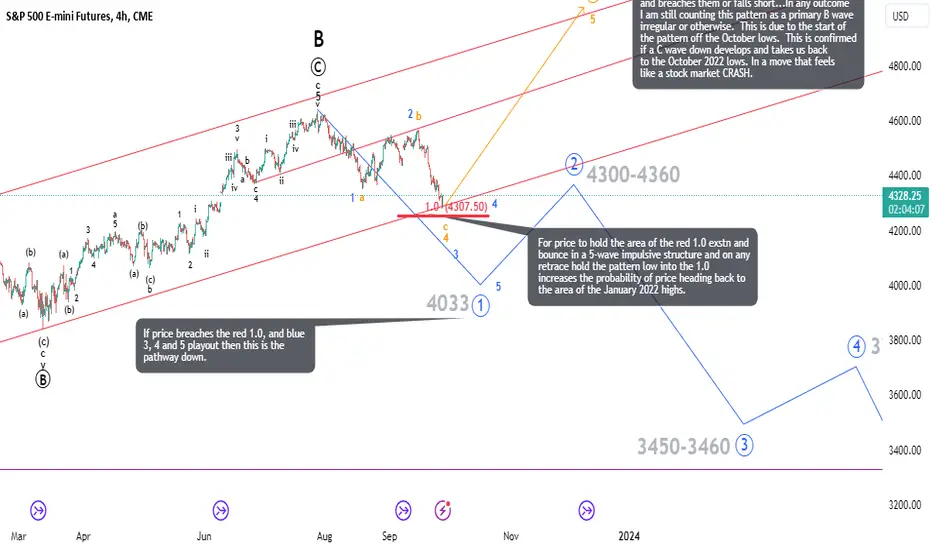
As we Approach the 4307.50 target, a Reminder Seems AppropriateI’ve written about price heading to the mid 4200’s to low 4300’s for a while now. By my count, I’ve written a total of 4 times just in the month of September.
Links below:
Sept 15
Sept 14
Sept 8
Sept 2
The target moved up slightly following the Sept contract change to Dec from 4256 to 4307.50. As the analysis changed, I adjusted my targets. But I must be honest, this has been a difficult pattern to trade so far up till today.
From an educational standpoint, yes, I found some silver linings. Ones in which I feel will end up working in my favor in the future. However, I didn’t decide to write this article to announce to my followers how great of an analyst I am.
I did so to issue a reminder.
When price does finally come into the 4307.50 area…if we bounce impulsively higher in a 5-wave pattern, we may complete an abc correction to the downside and rally for the remainder of 2023.
However, if we breach 4307.50 to the downside for a sustained period of time, and price continues to move through the 4250 level. That is our first big clue (NOT CONFIRMATION) that we’re headed to 3200-3300 MINIMUM IN early to mid 2024...
Just a friendly reminder.
Best to all,
Chris

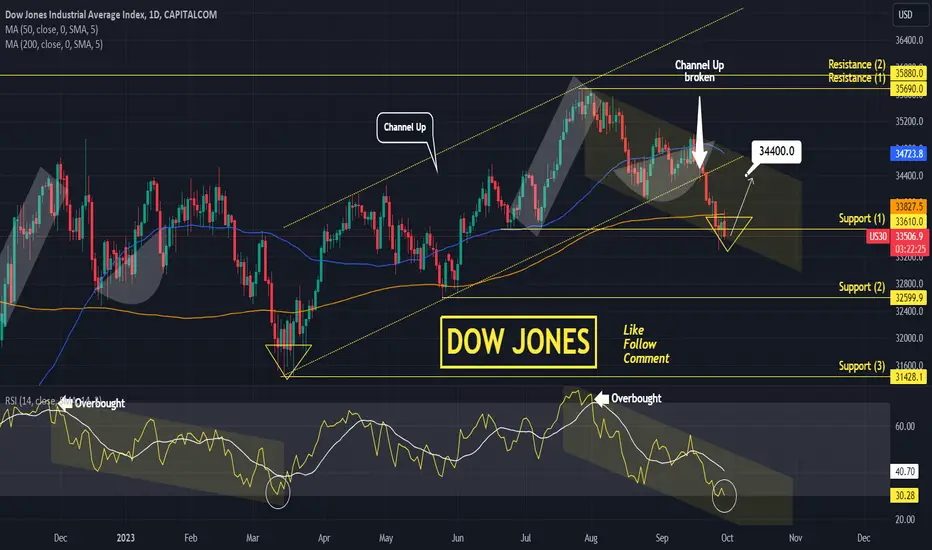
DOW JONES crossed below the 6 month Channel Up.Dow Jones is waving a strong bearish break out signal as it crossed under the bottom of the 6 month Channel Up today and most likely will close that way.
This means that the trend is shifting to bearish on the medium term as a new Channel Down could emerge.
Trading Plan:
1. Sell on the current market price.
Targets:
1. 33840 (MA200 (1d)) and if it breaks after a small bounce target extension 33200 (bottom of Channel Down).
Tips:
1. The RSI (1d) is trading in a Channel Down of its own. Last time it did was from December 2022 to March 2023 and as you see that price action is similar to today's. It bottomed some way under the MA200 (1d), which is consistent with our target extension.
Please like, follow and comment!!
Notes:
Past trading plan:

DOW JONES Buy signal to 35300 short termDow Jones crossed again over the former Falling Resistance after making a bounce near the 1day MA100.
This is the third time this level holds in almost one month.
This keeps the long term Channel Up pattern intact.
The 1day RSI is on the exact level of the June 2nd break out, showing a high level of symmetry of waves inside the Channel Up structure.
Buy and target the 0.786 Fibonacci level (35300).
Follow us, like the idea and leave a comment below!!
