Timing the Bubble Burst Sequence (DJIA/Gold); Part II, UpdateThis is an Update of the original post ;
This is now at a 36 month Major Resistance! It is quite likely this will be the (very) long-term, final top.
Djianalysis

Dow Jones: Where to go? 🚧🚧🚧Chances are good that the Dow Jones does not stop at 34000 points and crushes through that zone like Shaq used to do back in the day. If the Dow manages to also crush the resistance at 34336 points, our alternative scenario will prevail and bring even higher quotations. In our primary scenario, however, we believe that we take a long road here and that the Dow will correct a bit, before pushing for 34500 points.
Stay trading!

SPXI think a nice correction back here to the inverted head & shoulders neckline is coming. Would be super bullish and set up for the next parabolic move towards 4600.
We have the Fed buying bonds 20-30yr in order to implement YCC. We have also the fed stating the inflation is not a concern. (Which is B S IMO)
We have a reopening economy, entire world soon to be vaccinated if not already and Trillions of dollars in stimulus money floating around looking for a vacation and some DOGE coin entries.
Don't be a stupid bear and buy the dip like BIG MIKE Fam!
As always BIG MIKE PERMA BULL loves you guys and hopes we all get rich AF. ;)


So I'm Bearish...LongtermLooks like we are in the end of an extended wave 5.
Looking for a market top coming in the next year or so.
Retail reddit traders blowing up stocks is a clear sign that we are in the final impulse as retail traders don't typically get personally involved until the end. Also the hedge funds getting margin called is a warning sign that people are overleveraged.
*Notice how in the 70's when Nixon took the USD off the gold standard, the market began it's extended 5th wave. If he hadn't have done that, the market most likely would have had a normal 5th wave comparable to where our current subwave 1 of 5 ended around 1987. So in that reality the 80's would have marked the end of the cycle. We would have gone through another depression and then started a new cycle with the internet boom, but nope.
Honestly China might take over because they'll be able to fund larger deficits and sell their bonds to take over blockchain, while we're paying off all of our ancestors debts!
Building up positions in the VIX.
If this is the top of the top though....WTF do we do...?
People say gold and silver. We also have crypto and defi now so that's good. Maybe other countries or emerging markets?
The U.S. dollar cracking is gonna be part of this so sitting in dollars isn't really an option this time!

Dow Jones: No Fooling here! 🤡🤡🤡The Dow Jones is going to experience its biggest crash in history in just about a week. No, we’re just kidding. It’s April Fool’s Day, folks! In reality, we expect the Dow to further grow and expand all the way up to regions around 34000 points. After a short correction, we are set to tackle all-time highs above that level, too.
Happy Easter Holidays!


The Best (passive) Index SHORT in the world. - The Dow!The Title Chart is the DJIA/Nikkei225 - the best of them all.
Here are the rest;
This one is not very representative since it reflects the weakness in the Pound.
Still, it is a country-mile better deal than holding the Dow (Long).
Well, you get the idea as the rest of the worldwide indexes reflect the same story, across the board. (With the Asian Indexes leading the pack vs. the DJIA!)
One other, important issue to consider that these - above -declines haven't even factored in the Currency Differential(s) between between local currencies and the U$D. - Doing so, the Dow has an even grimmer future.


DOW JONES (DJIA) – Week 10 – Bearish pressure increasing.The main stock market Indices had a strong session on Tuesday as Treasury yields backed off a bit. Dow Jones hit a record high before backing off with expectations that The House will pass the vote for the $1.9 trillion Biden stimulus bill on Wednesday.
Technically speaking, the price made a new historical high, reaching the 32180.0 level. At the moment it looks like this bullish move needs some space to breathe, as the price started to lose some momentum at the upper channel line.
We expect a bigger degree bearish pullback to take place, with a chance to find some support around the 30k level. If that area is breached, we anticipate the momentum to increase and continue towards our first target in order fill the GAP created at the beginning of November.
Trade with care.
Best regards,
Financial Flagship
Disclaimer: The analysis provided is purely informative and it should not be used as financial advice. Remember that you need a plan before you start trading; so, take this knowledge and use it as a guidebook that will ultimately help you understand the market and easily predict your next move

DJI March 2021Not legal and financial advice;
Any information provided here is only the personal opinion of the author.
SPX let's see, I hope the bulls come thru here because I am long and hurting a bit more than I'd care to admit. ;)

DJI FORECAST AND COMMENTARY - DOW JONES INDUSTRIAL AVERAGEDow Jones now trading at the area I would expect a turn around. It could push right through before retracing. I would look for a modest short position in this area with a tight stop loss above 52.5, taking profits at the lines below. Possibilities are 1. it comes down to the orange and tests highs again. Or 2. It comes down to the red line before testing highs again. Or 3. The damn thing just continues upward. Hope this helps your trading ideas but remember this is NOT financial advice, do not take trades based solely on this idea, I am not a financial advisor. This is record keeping only. This is also more commentary than a call but I'm marking it a short call. :P
Be safe out there yall.

DOWGOLD Ratio - SHORT; Look where it is sitting!What "global recovery"??... Are "they" serious? - Of course not. But it is entertaining, that much is true.
Going long Game Stop makes a great deal more sense than owning US equities - or any other, for that matter.
(At least a case can be made for he former .)
... and here is one (among many!), reasonably reliable Risk On(Off) FX pair ...
... which says that the title chart just hit the wall.

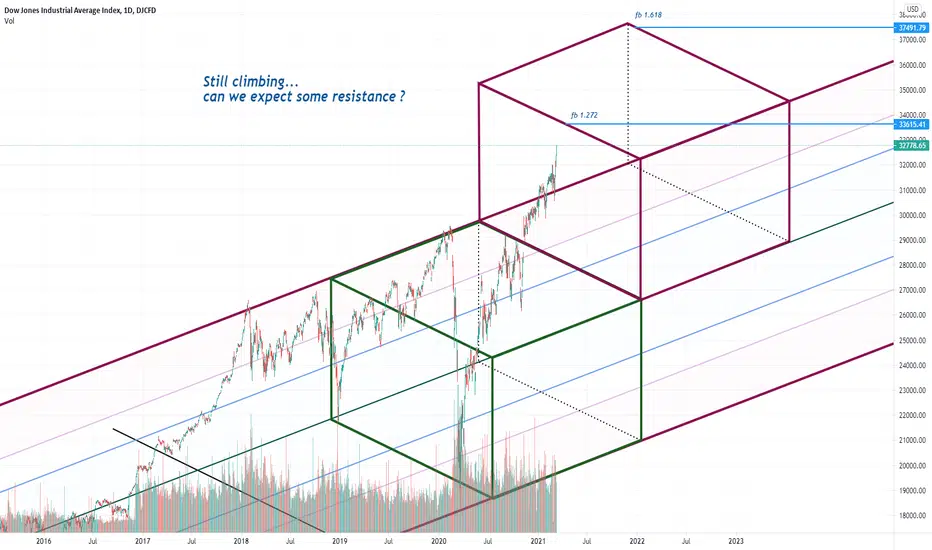
These violent delights have violent endsThe DJI is now contained in a channel up to resitance around 37,000. I was watching Romeo and Juliet and the above quote hit me like a brick wall. The crash from 40,000 will be something to behold.

DJIA AT A KEY LEVEL The multi year bull channel coincides with the steep rally channel from March lows so these levels are key for breakout or profit taking


My expectation for DJIGood day to all
As you can see I just try to make it easy for you
I already made all the explanation on chart so if you like this idea and you prefer it better than explaining in description box here
Let me know so I can do it always
Hope you a nice day

DJI IDEAbeen watching the price for few days and drew the most significant resistance and support levels.
if price manages to break 30625 would be good level to sell at.
this is just an idea and a way to get to know market better and what range it moves in.
CHEERS!

DJI, Dow Jones, 1D, Correction IdeaDJI just broke through the trend line and at minimum we should see a correction of about 3-5%, however there is about a 40% chanse it will keep going up tomorrow and create a new trend.

DJI Rising WedgeAs we can see rising wedge so we are expecting retest of uper trendline then a big fall and then recovery.

DJI 90 year-old Dow Jones index hints at correctionGlobally, Dow Jones industrial index has been on the growth for almost 90 years since the Great Depression.
Ironically, World War II launched an industrial boom in the United States that pushed the index up.
It took 30 years and increase in 10 times of the DJI value before a more or less significant correction took place in 1973 , and the oil crisis can be called the main driver.
The next corrections came again 30 years later: the crash of the Dotcoms of the 00s and the financial crisis of 2008-2009 , which should already be in the minds of most readers.
And now, not a simple 2020, closed with the Japanese candle "hanging man" , which can be regarded as the first bearish signal.
The collapse of the index in the spring 2020 through the first wave of coronavirus, and then its rapid growth amid subsidies to the population and the economy, formed a large shadow under the body of the candle.
How long will the economy be supported by the US printing press, will vaccination have an effect, or maybe something else will happen, we do not know...
But according to candle analysis, if the next candle behind the Hangman opens lower , then many traders may want to consider selling.
It's very interesting how the trades will open in 2021!
You will say that journalists refer more to the DJI index , and traders are guided by the S&P 500 (by the way, Tesla shares were added to the index a week ago) and you will probably be right. The Dow index has been calculated since the 19th century and is historically very important, but in 1957 appeared a competitor S&P 500.
All the same, the S&P 500 index, which includes the value of shares of 500 companies, more realistically shows the mood of the modern market than the Dow Jones industrial index, which includes only 30 companies.
We have added the S&P 500 to the chart below and what do we see? Another "hanging man" or Hangman.
By the way, it's not bad enough, historically they work out Fibo levels on the indices , everyone can find something that he likes.
Write in the comments, your expectations for 2021

DOWN(Dow)Jones after 17:24GMT21.12.2020$DJIA $DJI $YM $MYM
#DRAWDOWN
♁ 21.12.2020AD — possibly
today 17:24 GMT 12:24 EST
or before 31.12.2020AD
⛢ new #Economic #FULCRUM
2nd for 2020AD
cf. March 18, $VIX
VoC ☽
♃ ☐ ♅
📉 #DowJones down
→ #downJones *
#Gann #WDGann
Via
Breadth Swinging Methodology
BreadthScreener Portfolio
