$DJI- Massive Crash ImminentElliot wave patterns always move in the same specific way. In a 5 wave pattern which will inevitably be followed by an ABC correction. The textbook example of the pattern is shown right below the monthly Dow Jones Chart.
The Dow Jones is a compilation of the top 30 stocks. A crash in the majority of these stocks would rock the global economy in ways that we have never seen.
By now you’ve probably been hearing people say here and there that the stock market is a bubble. They’re not the majority, but we saw the same sort of behavior during the Bitcoin rise to $20,000. Which was, of course, a massive bubble. These views should be taken seriously.
Because of the way that the Elliot wave works it is impossible for there to not be a massive ABC correction to follow, which could potentially last for decades.
Instagram: @Crypto_Planet_VIP
Website: Cryptoplanet.cash
Djianalysis

Dow [ Trade Setup]
Trend is down and but at the same time don't forget about the uptrend.
Interesting to see if history(Jan-Aug ,2013) will repeat itself
Trade with care
Milad
Jan - Aug 2013
Jan - Aug 2019

BRACE! Wall street (DJI) in trouble. I review some of the potential moves on DJI and probabilities (not predictions) ahead. Importantly price has violently punched down through a daily investor zone. The weekly and daily time frames create probabilities for the south on lower time frames. This is both an opportunity and risk. Have a look and get ready.
Disclaimer : As usual if you lose your own money, kindly sue yourself.

DOW looking bearishI assume based on Dows failure to rally, perhaps this is a sign that market wants to turn around
At each test of resistance, after dropping more than 500 points, the market has continued to push bearish as well as the Divergence also validating the direction.

Dow Jones Index! Trade war and Rate cuts, what to expect!So as we can see at the fundamental analysis we see rate cuts and the trade war on the table. I think that we can assist to a down move on the MN, W1 and D1 chart, but at the same time don't forget about the uptrend.
Enjoy it and have fun!


THE DOW JONES INDUSTRIAL AVERAGE INDEX THE DOW JONES INDUSTRIAL AVERAGE INDEX
DJI OUTLOOK MONTHLY CHART

DJI big fall aheadThe Dow Jones hit historical maximums. I believe this is just a bull trap and a big fall is on the cards.
We see on the chart a big RSI divergence and the price printed somewhat of a doji just before season earnings started. Also MACD (not in picture) confirms the bearish momentum. It has been reported that earnings this quarter are going to be pretty bad and the Fed rate cut has probably already been weighted in.
A fall to the 26700 area will happen in a quick way. I believe the correction will be stronger and a fall all the way to the 25400 area is very very plausible.
I am ready to short this market at the minimum retracement.
Do you have different ideas? Let me know in comments!


DJI short target @26225 SL@27200DJI , short to 26225 as first target , market priced all the good news, any bad news coming will be huge negative effect specially china trade war front ,
trade with huge potential as far as i can see . Good luck all

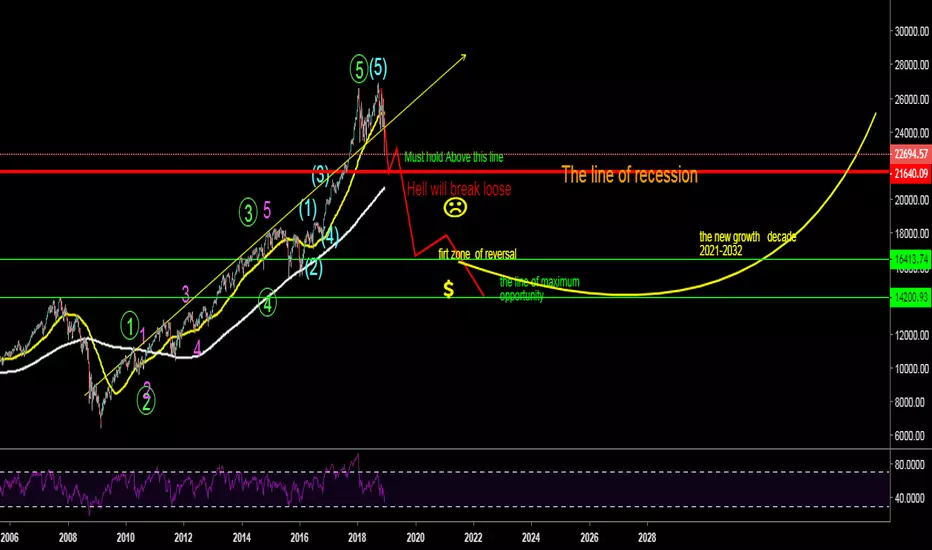
Recession Part 1 : The Dow CrashSince last recession(2007-09) DJI have been growing steadily in last 10 years without any break.
All impulsive trends comes with pullback/recession/ and DJI is no such exception..
If dow jones cant hold above the redline (21640) we might see big down trend coming in markets which has already been started.
Few reason:
www.nasdaq.com
www.theguardian.com
www.washingtonpost.com
If recession comes then it would be a new opportunity in coming decade and can make you super rich and wealthy.But the question is will you be at the right side of the trend?
Fly me to the moon...27420-27460 is the overhead trend-line resistance...but how can the US Stock market resist 28000? Or even 30000? They just love hitting the big numbers.

DJI - shorts at 27400?If you are greedy to short here, wait for 27400s...trend-line resistance there.

The DJI is Going To Make a Move SoonThe DJI has formed an Inverse Head and Shoulders Pattern, a break above the neckline will signify a pretty big move to the upside. However, it also is showing a Bearish Divergence on the RSI. If we fail to breakout, I believe we could see a sharp move down. It is also interesting to see Gold breakout recently, proceed with caution.

Daily DJI(Dowjonies) Forecast View26-Jun
Forecast timing analysis by pretiming algorithm of Supply-Demand strength
Investing position about Supply-Demand(S&D) strength: In Rising section of high profit & low risk
Supply-Demand(S&D) strength Trend Analysis: In the midst of an adjustment trend of downward direction box pattern price flow marked by limited rises and downward fluctuations.
Today's S&D strength Flow: Supply-Demand(S&D) strength flow appropriate to the current trend.
read more: www.pretiming.com
D+1 Candlestick Color forecast: RED Candlestick
%D+1 Range forecast: 0.2% (HIGH) ~ -0.5% (LOW), -0.1% (CLOSE)
%AVG in case of rising: 0.8% (HIGH) ~ -0.2% (LOW), 0.6% (CLOSE)
%AVG in case of falling: 0.2% (HIGH) ~ -0.7% (LOW), -0.3% (CLOSE)
Price Forecast Timing Criteria: Price forecast timing is analyzed based on pretiming algorithm of Supply-Demand(S&D) strength.

Dow DJI LONG but massive Resistance in FrontHello to all watching my charts
Here i show the Dow Jones after the Fed Meeting
and market is closed on 19.6.2019
My channel system tells me we have still a Long Channel
and a long position should used.
BUT (what i normally not note ) we have now really
a lot of resistances in front which i have show also in blue color.
As you know form my other posts i always say:
Trend channel lines beats resistance lines
but if we such a power of resistance in front i cant ignore that.
So of course maybe this time trend beats also
but i would be very cautions with new longs at that point.
If you have a long position with a fine profit
maybe from 25100... i personally would tale the profit here
Please remember that.
Good trades
Renkotrade

Daily Dow jones forecast timing analysis.Stock investing strategies
Read more: www.pretiming.com
Investing position about Supply-Demand(S&D) strength: In Rising section of high profit & low risk
S&D strength Trend Analysis: About to begin an upward trend as a adjustment trend gradually gives way to increasing limited falls and strong rises.
Today's S&D strength Flow: Supply-Demand(S&D) strength flow appropriate to the current trend.
D+1 Candlestick Color forecast: GREEN Candlestick
%D+1 Range forecast: 0.5% (HIGH) ~ 0.1% (LOW), 0.4% (CLOSE)
%AVG in case of rising: 0.8% (HIGH) ~ -0.2%(LOW), 0.6% (CLOSE)
%AVG in case of falling: 0.2% (HIGH) ~ -0.7%(LOW), -0.3%(CLOSE)
Stock Price Forecast Timing Criteria: Stock price forecast timing is analyzed based on pretiming algorithm of Supply-Demand(S&D) strength.

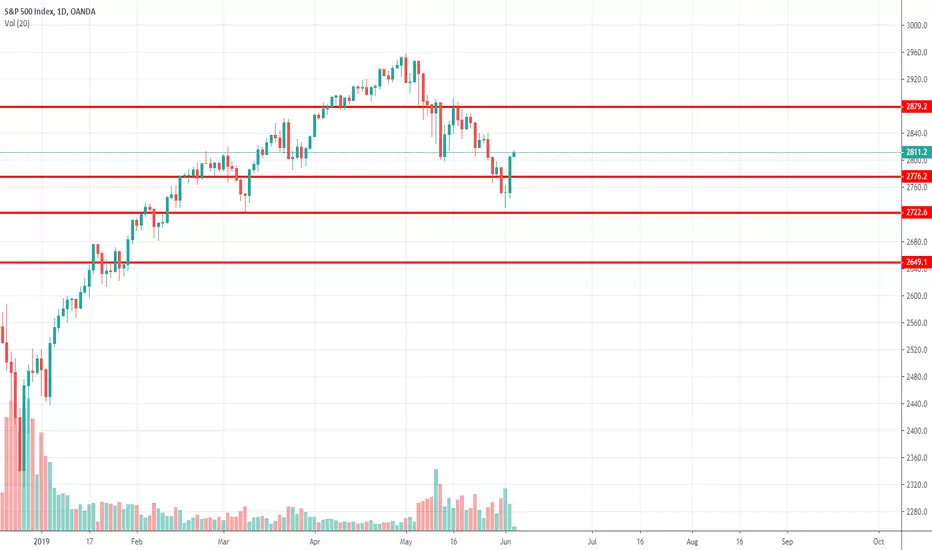
Bullish momentum spotted on spx 500. 19 june 2019. 2879 is well supported. Bullish momentum is going strong . Shall see how the trade deal goes next week. Retracement back to 2879 for a long , watch 2952 closely, price might bounce off from there back to 2879.

DJI 1HR Chart LONG ChanneltradingHello to all watching my charts.
Here is the Dow Jones DJI in a 1 HR in my chartsystem
with channel trading.
At the moment we are long and we will check on monday
whether these channel will continue to give further up the direction
or if the index will fall out or make a break out.
Whats very interesting is that same channel in the past has function
as support and resistance in May.
Best trades for all
Renkotrade

DOW/DJI Market Analysis - Entering Consolidation PeriodDOW/DJI graph looks like it's in consolidation.The blue lines (solid and dotted) represent areas where I expect the price to go up/down to. They are the support and resist.
The green circle represents a period of time where I think the consolidation will come to an end.
What is consolidation? It's when the market is undecided if it will go up or down.
What happens when the consolidation comes to and end? We will see a move that will "break" the blue lines and head up or down.
The way current conditions are, this consolidation period will come to and end between January 2020 and May 2021. We could then see a crash or break-out. The move up or down, when we come out of consolidation, might be slow as well.
The lowest the price will go (before the end of consolidation) is around 22000, the highest around 26500.
This is not financial advice. Remember that everything is dynamic and up to interpretation of the trader and the tools they use. I will keep updating this graph every so often as conditions change.

SPX500 will be bullish for the rest of the week? 6 May 19A very nice morning star formation. With market participants expecting the Chair of Federal Reserve reducing interest rate in the near future, we might see 2879 by the end of this month. This is a trend continuation trade.
DJI - Are we setting up for a recession?Are we set up for a recession in the coming years??
Looks like a classic Wycoff Market Cycle pattern.
Paired this with Fibonnaci to predict levels.

Very simple possible scenario ..Ifsimply the thing is to see what happened last time ( year 2018 ) with the famous commercial war, and its result in the index, a marked negative readability ( end of 2018 ), why would it be different now? Well, it will not be. we will see the same results as the previous time, of producing this war in all its splendor this series the most probable scenario. // to end of 2019 or 2020
