DowJones - Are We In a Recession?Hello everyone,
I am very hesitant re; sharing this idea. I do hope by putting this out there, I will gain valuable feedbacks & perspectives that I otherwise would not have had.
I am fully aware that this is a bold statement to make: we have a recession coming up soon. In fact, I think the recession has already begun.
-----
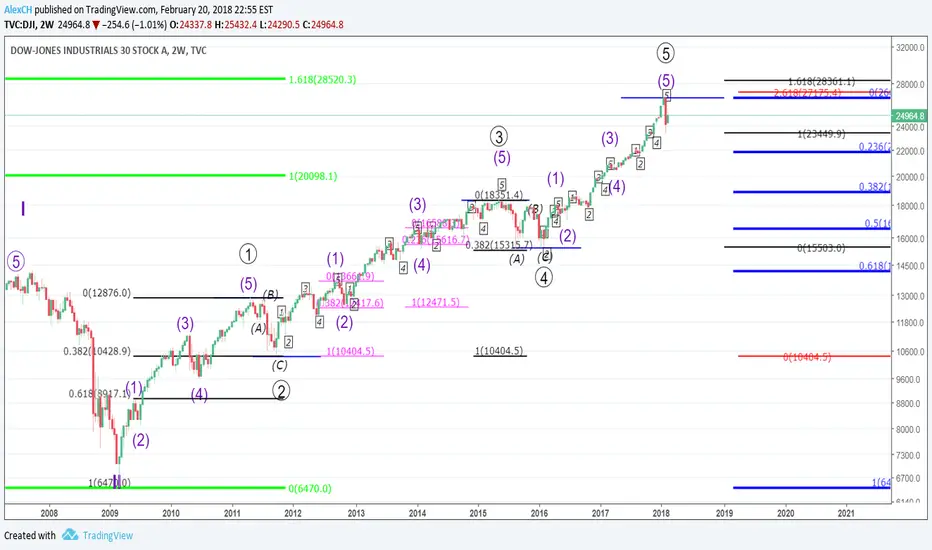
This is a 2 week chart of DJI. It is impossible to fit everything in one screenshot- to keep the chart simple, I will be posting more detailed analysis in the updates below.
I will first share the conclusion of my analysis, and the rest of the post will be me justifying this idea.
- Conclusion: It is my opinion that we have finished the 3rd wave of the cycle and we are now in the fourth wave. The start of this cycle dates back to the autumn of year 1974. That is 44 years ago – it has been almost half a century.
From my analysis, this 3rd wave of the cycle began after the great recession of 2008, which would be the 2rd (corrective wave) of the first wave of the cycle.
- The evidence that has led me to believe the third cycle has ended are the following:
1. I counted out all the primary waves (in black) and their sub waves- intermediate waves(in blue).
2. For the minor subwaves of the intermediate waves of the 3rd and 5th primary waves of the third cycle, I labelled them in the enclosed boxes (in black).
3. The Fibonacci retracements of the first and third intermediate waves of the third primary wave in the third cycle are in magenta.
4. The Fibonacci retracements of the first and third primary waves of the third cycle are in black.
5. The price level $26616.7 (high of 2018) is in confluence with the primary wave 1-2 (of the third cycle) 2.618 Fibonacci extension – marked in red on the right.
6. Continuing the previous point, the price level $26616.7 is also in confluence with the primary wave 3-4 (of the third cycle) 1.618 Fibonacci extension level- marked with black on the right.
7. Continuing points (6),(7) – the price level $26616.7 is in confluence with the wave 1-2 1.618 Fibonacci extension of THE WHOLE CYCLE. Marked in green on the left. This 1-2 cycle extension dates back to price level of $570 in late 1974 and the high of $14198.1 dating back to mid 2007; the extension starts at $6470, which is the low formed by the end of the great recession in 2009. This low in 2009 marks the end of the second wave of the cycle.
8. Now the price has shown reversal signals from this Fibonacci clusters formed by 3 critical Fibonacci extensions, I have enough reason to assume the third wave of the whole cycle has ended. This third wave has taken almost ten years to complete.
9. For these reasons, I believe we are entering the fourth wave of the cycle. Entering a corrective wave, that is, a move to the down side, might be the start of a recession.
10. The Fibonacci retracement of the third wave of the cycle is marked in blue on the right. An a:b = 1:1 extension at the daily timeframe will give us a retracement to the .236 level.
Please do read through all the points and share your opinions.
I do not know where this correction will take us. It might just be a small one – to the .236 Fibonacci retracement level of the third wave of the cycle. Or it could be all the way to around $14166 – at the .618 retracement level. Only time will tell.
What would make this idea wrong?
A close above the previous high of $26616.7 – In that case, we will have to re-count.
AL.
A historic moment?
Djianalysis
#DJIA Fib and Trend Line WatchLooking for bounces or cross throughs. Neutral for now. We should see some short term down-side action, for sure. But a couple places where it could bounce off, heavy.


^DJI Dow Jones Industrial Average at Key support levelDow jones have been falling sharply of late and it is currently rested at the 61% retracement level on the fibonacci . A close at that level along with oversold RSI could trigger a relief rally in DJI but it will find really hard to break 24500-25000 at closing level today.

DJIA: REDRUMYesterday was a buying opportunity. We needed to see follow-through today, which did not materialize. This rejection compounds the bearish reversal.
What happens next? ...think of the elevator scene in The Shining for a clue.
We are about to witness the sacrifice of 2017's gains, in a very short space of time. Make no mistake; it will be bloody, fast, but it is not the high of the market. January is A high, not THE high, and this move will be an epic false move.
The only technical analysis I have marked on the monthly chart is the 2017 low. Watch this level. Institutions take note of yearly highs and lows, and a penetration of this level will flip investors bearish - which will provide fuel for the next bullish leg.
In the meantime, my strategy is simple: SELL ALL BOUNCES AND BREAKS

Large DJI Correction on the Way?I am fairly new to the markets, but I found a few similar features between the chart for the stock market crash of 1987 and our current situation. Any feedback is greatly appreciated!

DJI (CBOT)B&B Pattern. Trade setup with Buy Limit position (EP) at 25387 Stop Loss (SL) at 24531 and Take Profit (TP) at 26186.
Money Management
I have 22,800 USD in my portfolio. I can lose 10% of the port which is 2,280 USD. I will Trade MINI DOW JONES ($5)
Position Sizing
1 Tick = $5
1 Contract size need IM = $3,685 (I can open not more than $22,800 / $3,685 = 6.187 Cons)
It is 856 Tick from EP to SL, with 1 Con, I will lose 856 * $5 = $4,280
To lose 2,280 USD I need to open 2,280 / 4,280 = 0.53 Con
Then I will put 1 Contract
If I win, I will gain (26186 - 25387) * $5 * 1 Con = $3,995
P.S. I will not trade this position because stop loss is beyond my acceptable number

a retracement neededhi all
after 20 months of upward way needs a correction
i smell it should correct to 20000 area as a historic support area
so iam seeing 22900 and 20700


DJI - Where The Parabola EndsIt may be crazy to short the bull, but I think it is time. Weekly RSI is over 90. Should be time to take a step back.

Dow Jones Index TargetI expect the Dow Jones within a week or so to be hitting a $26225 price point. I definitely say it is bullish and potential resistance could be near. However, the correlations have been seemingly positive and as an index of the general market, it looks like a good position. As a HODL it looks to be a fairly conservative investment strategy to be in your portfolio. Still obviously you got that risk, but I would not withdraw to quick. You can always invest in many different index funds or the S & P as well as just the top performing stocks. Overall, it is about mitigating risk and maximizing returns.

DJI (DOW JONES): HOLY PARABOLATHIS, my friends, is a parabola.
It is a glorious sight, but parabolas never last forever.
On the chart I've marked levels in red, every 1000 points up to 30k: 25k,26k,27k,28k,29k,30k...
I'm not such idiot to call THE top on the market. I'm simply saying my understanding of technical patterns leads me to safely conclude that this move will shift and a new pattern will form. We now need to watch closely for this shift.
What will give us a clue that it's near? A near term topping pattern. This MAY be preceded by a fast run up, where price eats away at the levels marked in red like pac man on crack. We will need to see how price handles these levels.
IF a temporary high is temporally close, it will fall short of 30k, in order to trap late longs who buy expecting a pop above 30k. My best guess is that this will be somewhere around 27k to 28k.
Let's look at the big picture. The Dow is not finished - far from it. Since the 1970s, the markets have been pricing in a space-age, where we as a Humanity explore the galaxy and beyond. However, the angst against Trump will intensify; there is a maniacal and hysterical element that does not want the technological/spiritual evolution of Humanity to occur, and will do anything to attempt to repress anything that does not fit its status quo. Destabilization in American politics should result in some foreign selling of US equities, and we should expect this to manifest soon.
If you bought in 2008 and you're sitting tight, remain in your deck chair and sip another kale juice and martini. If, like me, you weren't in the markets in back then, and like short-term setups, stay long... but BE WARNED. THE PATTERN WILL SHIFT IN 2018, perhaps sooner than later.
(Some may say - but what if we just keep going? Quick answer: markets require momentum to move. If this move were to extend then it would surely climb much higher, but would be limited in price and time. In other words, it would imply a crash sooner rather than later. Since I see no fundamental basis for this, this possibility is off the table for me.)

Dow Jones Tax Reform 2019 Fundamental:
I do not think that with the extension of the fiscal reform, the bullish euphoria will decrease in the index.
Technical :
As you can see in the attached image, the price at this moment is in a very important area, 1.61 fibonacci. what would be the culmination of the 3 "Super Wave". We should wait for the two confirmations that are in the graph to go down with more security.

Lord What Is This ? Look at the macd. Screen is not enough :). It is in the sky.
I guess no one can imagine such rally.
If this is not BUBLE nothing BUBLE on earth.
Amazing man unbelievable.
Anyone trades dow jones i guess shorted this anytime in lifetime and bail out.
When this rally finishes there will be major breakdown. :)
Anyone wanna see buble this is the buble.
Good Luck.

Time to buy the Dow Jones Index? (DJI)look at the chart for further information. Retracements are based on Fibonacci retracements.

DJI Daily Chart for Possible Short into Week 26/06/17 - 30/06/17Possible short of DJI ahead in the next 5 days. To be used in conjunction with the weekly DJI Chart.


CORRECTIVE STRUCTURE IN DJI - 1H CHARTHey Traders,
Just wanted to pull this simple analysis on DJI (Dow Jones Industrial Average)
We had an impulse and a corrective structure, I am sure we can get a brakeout soon, watch for that and then go long for a short term trade.
-
Hey Traders,
Simplemente compartir este analisis en DJI (Índice Down Jones)
Tuvimos un impulso y una corrección. Estoy seguro que pronto el mercado rompéra alcista, estad al tanto y en la ruptura de la estructura buscad una oportunidad en largo a corto plazo.
Carlos

