Dow Jones 10/10 MoveDow Jones - DJI
Description :
Bullish Channel as an Corrective Pattern in Short Time Frame and it has Breakout the Lower Trend Line , It will Complete its Retracement at Previous Strong Support or till its Lower Trend Line at Fibonacci Level - 61.80% / 78.60%
Entry Precautions :
Wait until it Rejects with Strong Bearish Price Action
Djianalysis

US30 H4 Possible Buy Price Test the trendline and close above thats indicate possible reversal from there.

Global Equities; The decline of rationality ...... and the rise of financial engineering - manifesting in a generational shift toward pure leverage.
"When they look back at this segment of history they will probably ask: What the hell were they thinking?!"
Reporter: "How is it possible that the DJIA loses 90% of it's value? ...
B.G.: "It is very simple, really. First, it loses 50% of it's value and then, 80% of the remainder." - Benjamin Graham, from a 1934 interview.

Dow Jones (DJI) -> Back To The TrendlineMy name is Philip, I am a German swing-trader with 4+ years of trading experience and I only trade stocks , crypto , options and indices 🖥️
I only focus on the higher timeframes because this allows me to massively capitalize on the major market swings and cycles without getting caught up in the short term noise.
This is how you build real long term wealth!
In today's anaylsis I want to take a look at the bigger picture on Dow Jones.
At the moment the Dow Jones is retesting its previous all time high which is roughly at the $35.500 level and the index is already starting another bearish rejection.
If we see a retracement back to the lower bullish trendline of the rising channel which is sitting at the $30.000 level, this will be a textbook bullish continuation setup on the Dow Jones.
- - - - - - - - - - - - - - - - - - - -
I know that this is a quite simple trading approach but over the past 4 years I've realized that simplicity and consistency are much more important than any trading strategy.
Keep the long term vision🫡

DJI LONG DJI on verge of breakout, no idea on external events like feds etc but if it sustained 34000 for some more time, it should touch ATH

DOW JONES DJI 07/09 MovePair : DJI - Dow Jones
Description :
We have Break of Structure with Completed Retracement at the Lower Trend Line of Bearish Channel in Long Time Frame at Fibonacci Level - 50.00%. It has completed its Impulsive Wave " 1234 "

US30 ForecastAfter 3 weeks of being range, it seems us30 can fall towards 33% level, as a retrace for higher probable prices.

Dow Jones - 10/08Pair : DJI - Dow Jones
Description :
Completed " 123 " Impulsive Wave
Falling Wedge in STF and Rejection from UTL
S / R Level
Fibonacci Level - 38.20% / 50.00%
Divergence - RSI

TARGET REACHED Dow Jones to 34,826Cup and Handle formed, broke out and since then it's been a slow but consistent move up.
The only frustrating part with holding a trade like this since March is that there are these daily CFD Swaps which eats into the profits.
And when you hold for >2 months, you start to feel it. Anyway, the bias was right and I might need to lower the target in the future so we don't hold these trades for too long.
The first target reached 34,826 and the next target will be higher. We just need to wait for the next breakout pattern and I'll let you know.

DJI - Dow Jones Next Possible MovePair : Dow Jones ( DJI )
Description :
Impulse Correction
Bullish Channel as an Correction in LTF and Rejection from the Upper Trend Line
S / R Level
Completed " ABC " Corrective Wave and " 123 " Impulsive Wave
Break of Structure
RSI - Divergence

DJI- Bullish picture overallAfter the recent test of support at 32800, DJI reversed to the upside and tested 34300 resistance.
The recent correction is a higher low and with the price back at resistance there are high chances of an up break.
In such an instance continuation is probable and the index could test the ATH.
I'm bullish as long as the recent low remains intact

Dow Jones globally will fall due to the north node cycleTVC:DJI globally will fall, because the Gann square of 20, built for the New York Stock Exchange indicates the date 2023 (reversal), and since on the monthly chart is now flat, and the market is at high prices, then a fall is more than likely. In 2024, a global strongest crisis is expected in another astrological cycle. There was already a similar crisis in 2008, and then the same cycle worked.
The fall may begin both now and by the second half of 2024, as they can still pump money, or at least say everywhere that there is no stronger economy in the world than the American one, and this will delay the fall for some time.
It will be possible to speak about the end of the crisis no earlier than the beginning of 2028.

DJI is likely to enter a major oscillation mode !DJI is likely to enter a major oscillation mode !
This figure shows the weekly candle chart of the Dow in the past two years. The top to bottom golden section is superimposed in the figure. As shown in the figure, the Dow Index in the past six months has shown a large oscillation pattern between the 0.618 and 1.382 positions on the golden section of the graph! In the future, the Dow's probability will first shrink and then enlarge, and then choose a direction to break through. Personal prediction probability will break down! So let's use the 1.382 digit (31700) of the golden section as the long short split for the future!

Dow Jones Next Possible MovePair : Dow Jones ( DJI - US30 )
Description :
Bullish Channel as an Corrective Pattern in Long Time Frame
Impulse Correction
Completed " abc " Corrective Wave
Resistance Level
Divergence - RSI

DJI Dow Jones Next Possible MovePair : DOW JONES ( US30 - DJI )
Description :
Bullish Channel as an Corrective Pattern in Short Time Frame
Divergence
Exp FIAT
Break of Structure
Falling Wedge in STF with the Breakout of UTL
Completed " ABC " Corrective Wave and " 12 " Impulsive Wave

1500$+ prediction on the DJIHere's the afterward of my forecast on the Dow Jones Industrial(us30).
You can find the old idea attached to this post. Looking for more upside.
Feel free to ask questions, trade safe!

DOW looking dumpy (Featuring the Presidents)If the narrative holds true with recession/depression and other sad things, I could see this going back down to support.
Presidents added for fun and perspective.

DJI looking for upside resumptionGood morning all!
I'll be breef as I the count kind of speaks for itself. It looks like we are ready to resume higher into wave 3 as we are looking at what appears to be a clear three wave move into wave 2.
It looks like TECH will be giving a break and VALUE will come back strong into sector rotation.
CHECK OUT my previous post on the NASDAQ which played out perfectly, let's see if this post will have the same faith.
Feel free to ASK me questions in the comments.
Enjoy the weekend and trade safe!

DJI ARE you rdy for sell ?🧨🧨👌The fall of the Dow Jones index / Are you ready to sell?
It is easy to see that the Dow Jones index is going to fall, and the targets that I specified for you will first reach 31486.38, then it will have a corrective trend up to 32550.68.
The next target that the index will see will be 28781.97 and that is where you can decide to go long.

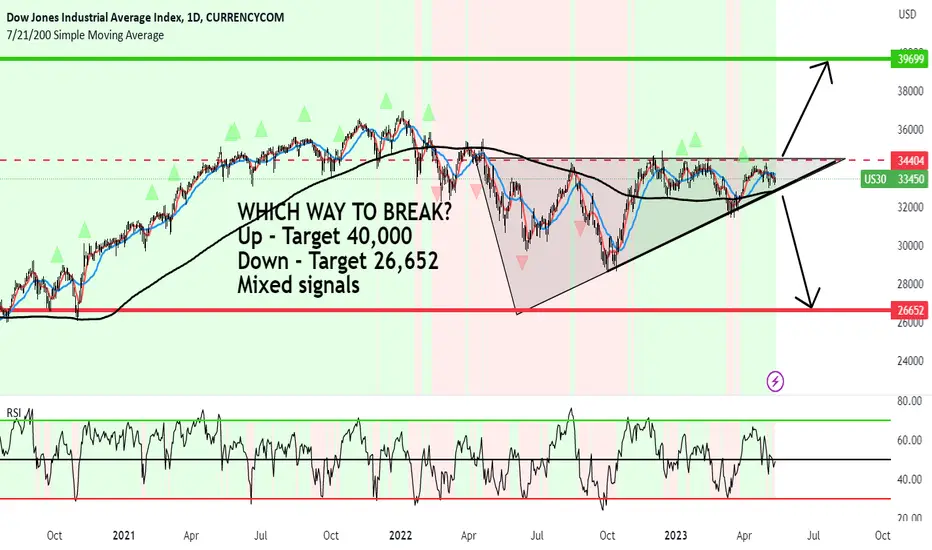
US 30 showing mixed signals - Waiting for break either wayWHICH WAY TO BREAK?
It's up to the market and for us to act accordingly.
There is an ascending Triangle that's clearly forming on the Daily.
And normally, with the higher lows and same highs, the bias is normally up.
If it breaks up the target will most likely hit 40,000.
My issue is the state of the world right now, which is probably wrong to think about as charts are charts.
But many main indices have been rattled with what's been happening (which I mention in many analyses before hand).
Also 21>7 and the price action is just not strong enough to break as of yet.
There are also conflicting signals with Nasdaq and SP500 which lead world indices.
I think my mind has been clouded with unnecessary information which needs to be corrected and humbled by the market.
But if the price breaks below the Ascending Triangle, the target will be 26,652
What do you think up or down?
We will live to witness the greatest downward cycle DJI is in 5t wave soon to finish and soon ABC cycle will start.
The downward cycle will lead the prices to previous wave 4 towards 18000 levels
and Weekly chart:
and Daily chart:
Little bit of steam left that can take prices high, and therefore there is chance of up move in the short term

DJI 33960 Target hit!Touchdown on that target!
All targets got satisfied! No more current upside targets, need a retracement at min.
May 1st could be the highest week for this year

DJI target is getting delivered!Getting close to the perfect touchdown target!
#NDX and #SPX have been in consolidation mode since Mar 31st.
No need to be always in trade; cash is a position too!
