DOW JONESPair : DJI - Dow Jones
Description :
Bullish Channel as an Corrective Pattern in Short Time Frame
Break of Structure
RSI - Divergence
Completed " 12 " Impulsive Waves
Djiaprediction

DJIDow Jones daily chart trendline breakdown.. it will might be go 38617. It's will be impact on Indian Share Market...

DJI will be able to create RSI divergence in the near future?TVC:DJI
DJI will be able to create RSI divergence in the near future?
DJI will have an adjustment in the near future, but no one knows how much, where and at what price.
But in a certain expectation, I think that the case of the price increasing a little more (maybe to near 40K) and then creating an RSI divergence is a fairly typical case for this bullish pattern.

UPDATE: Dow Jones almost reaching target at 37,242SInce the price broke above the breakout pattern, the price has been moving on a strong but unsustainable inclination trend.
Yes, it will most likely hit the initial target 37,242 as we're almost there.
But, we also need to consider that in the next three weeks, we could have some consolidation range.
This doesn't mean, we should expect a crash afterwards. On the contrary with the US dollar weakening and with the interest rate hike on hold - means we should expect futher upside in 2024.
But I'll let you know...

US30 DJI on 20-11-2023 : BEARISH BIASEDUS30 Index can go Bullish if,
H1/H4 closing happens above 35000, it can move bullish upto 35150 level.
or it can go Bearish if,
H1/H4 closing happens below 34880, it can move bearish upto 34730 level
#️⃣ Trend expectations from 8:00AM to 12:30PM USA Time EST.
#️⃣ Trade with 1-2% risk only.

US30 Dow30 DJI on 16-11-23 >> BULLISHUS30 can move on Bullish Bias on 16-11-23 if any H1/H4 closing happens above 35050 level upto 35500 level.
Alternatively, if any closing happens below 34850 level, then it may go bearish upto 34500 level.
For more details ,reach us . Thank you

Dow Jones 10/10 MoveDow Jones - DJI
Description :
Bullish Channel as an Corrective Pattern in Short Time Frame and it has Breakout the Lower Trend Line , It will Complete its Retracement at Previous Strong Support or till its Lower Trend Line at Fibonacci Level - 61.80% / 78.60%
Entry Precautions :
Wait until it Rejects with Strong Bearish Price Action

DOW JONES DJI 07/09 MovePair : DJI - Dow Jones
Description :
We have Break of Structure with Completed Retracement at the Lower Trend Line of Bearish Channel in Long Time Frame at Fibonacci Level - 50.00%. It has completed its Impulsive Wave " 1234 "

US30 ForecastAfter 3 weeks of being range, it seems us30 can fall towards 33% level, as a retrace for higher probable prices.

Dow Jones - 10/08Pair : DJI - Dow Jones
Description :
Completed " 123 " Impulsive Wave
Falling Wedge in STF and Rejection from UTL
S / R Level
Fibonacci Level - 38.20% / 50.00%
Divergence - RSI

TARGET REACHED Dow Jones to 34,826Cup and Handle formed, broke out and since then it's been a slow but consistent move up.
The only frustrating part with holding a trade like this since March is that there are these daily CFD Swaps which eats into the profits.
And when you hold for >2 months, you start to feel it. Anyway, the bias was right and I might need to lower the target in the future so we don't hold these trades for too long.
The first target reached 34,826 and the next target will be higher. We just need to wait for the next breakout pattern and I'll let you know.

Dow Jones showing upside with bullish breakout patternsThere are many bullish breakout patterns in the process.
On a larger scale there is an Inverse Head and Shoulders.
On a smaller scale, there is a Box Formation and a W Formation in the making.
We just need the price to break above and out of the formations, to get our confirmation.
Other indicators confirm including:
7>21>200
RSI>50
Target 36,426
SMC
Sell Side Liquidity is showing below the W Formation where Smart Money comes down and sweeps the selling from the retailers as they buy into it.
NOW WE WAIT!

DJI - Dow Jones Next Possible MovePair : Dow Jones ( DJI )
Description :
Impulse Correction
Bullish Channel as an Correction in LTF and Rejection from the Upper Trend Line
S / R Level
Completed " ABC " Corrective Wave and " 123 " Impulsive Wave
Break of Structure
RSI - Divergence

Dow Jones globally will fall due to the north node cycleTVC:DJI globally will fall, because the Gann square of 20, built for the New York Stock Exchange indicates the date 2023 (reversal), and since on the monthly chart is now flat, and the market is at high prices, then a fall is more than likely. In 2024, a global strongest crisis is expected in another astrological cycle. There was already a similar crisis in 2008, and then the same cycle worked.
The fall may begin both now and by the second half of 2024, as they can still pump money, or at least say everywhere that there is no stronger economy in the world than the American one, and this will delay the fall for some time.
It will be possible to speak about the end of the crisis no earlier than the beginning of 2028.

DJI Dow Jones Next Possible MovePair : DOW JONES ( US30 - DJI )
Description :
Bullish Channel as an Corrective Pattern in Short Time Frame
Divergence
Exp FIAT
Break of Structure
Falling Wedge in STF with the Breakout of UTL
Completed " ABC " Corrective Wave and " 12 " Impulsive Wave

1500$+ prediction on the DJIHere's the afterward of my forecast on the Dow Jones Industrial(us30).
You can find the old idea attached to this post. Looking for more upside.
Feel free to ask questions, trade safe!

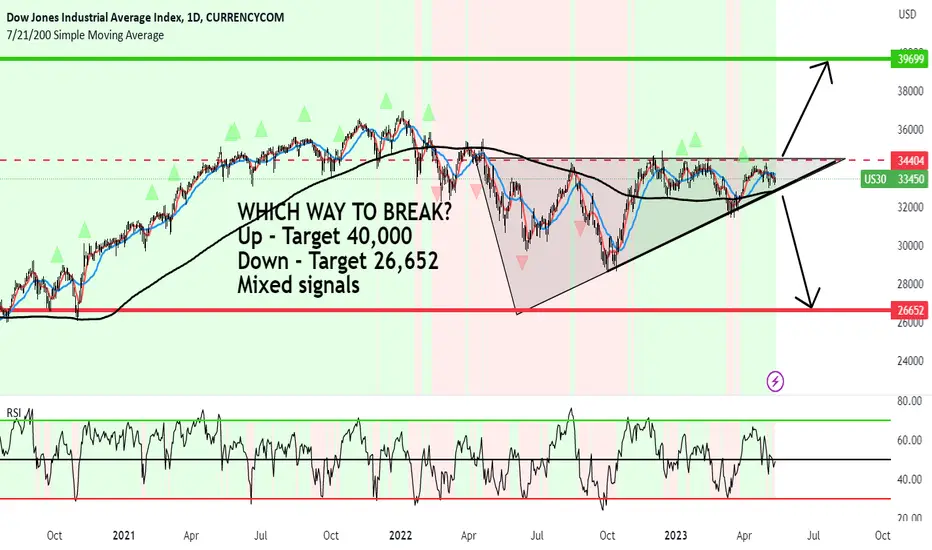
US 30 showing mixed signals - Waiting for break either wayWHICH WAY TO BREAK?
It's up to the market and for us to act accordingly.
There is an ascending Triangle that's clearly forming on the Daily.
And normally, with the higher lows and same highs, the bias is normally up.
If it breaks up the target will most likely hit 40,000.
My issue is the state of the world right now, which is probably wrong to think about as charts are charts.
But many main indices have been rattled with what's been happening (which I mention in many analyses before hand).
Also 21>7 and the price action is just not strong enough to break as of yet.
There are also conflicting signals with Nasdaq and SP500 which lead world indices.
I think my mind has been clouded with unnecessary information which needs to be corrected and humbled by the market.
But if the price breaks below the Ascending Triangle, the target will be 26,652
What do you think up or down?
DJI target is getting delivered!Getting close to the perfect touchdown target!
#NDX and #SPX have been in consolidation mode since Mar 31st.
No need to be always in trade; cash is a position too!

DOW Jones New Week Possible MovePair : DJI Dow Jones
Description :
Bullish Channel as an Corrective Pattern in Long Time Frame
Divergence
Break of Structure
Exp Fiat in Short Time Frame
Completed " ABC " Corrective Waves

Dow Jones - DJI 20 March - 24 March Pair : Dow Jones - DJI30
Description :
Impulse Correction Impulse
Break of Structure
Flag Pattern
Bearish Channel in Long Time Frame and Short Time Frame as an Corrective Pattern
Divergence
Completed " 12345 " Impulsive Wave " ABC " Corrective Wave

DJI in Bear ControlDJI according to Elliot wave principle the fifth wave complete and ABC pattern already formed so the price will drop to find the best demand zone to pull back the price may be the price break the nearest demand zones to find a strong support in down levels

Dji Drop or rally?As i see as a technical analyser the price will drop to find best support to change direction overall Dji market will crash maybe it is waiting to push by some news.

DOW Jones Buy or Sell ?Pair : US30 ( DJI - Dow Jones )
Description :
Impulse Correction Impulse
Completed " 1234 " Corrective Pattern
Divergence
S / R Level
Symmetrical Triangle as a Corrective Pattern need to wait until it Breaks the Upper or Lower Trend Line
