DOW Outlook 26 FEB 20See chart for key pivot points for todays trading day.
futures are up small at this moment, if we cannot obtain the pivots shown and we roll over into yesterdays low more volatility is to come, looking for sell setups
on the other hand if we can penitrate the pivot lines we could see a relief rally towards yesterdays open levels
Djiaprediction

Trading Pathways Analysis of DJI H4 Chart
The outlined white arrow pathway is the predicted pathway that the DJI H4 will follow in the coming days or weeks. Using my unique charting methods, I have been able to arrive at HIGH PROBABILITY turning points where DJI H4 will turn.
PLEASE NOTE THE ABOVE ANALYSIS IS FOR EDUCATIONAL PURPOSES ONLY. THEY ARE NOT DIRECT INSTRUCTIONS TO TRADE AND ANY LOSS INCURRED BY FOLLOWING THIS ANALYSIS IS AT YOUR OWN RISK.
Eiseprod of Trading Pathways

$DJIA 2019 perfect EW tramlinesDJIA in 2019 was a textbook tramline, even a pitchfork. Expect Q1 7% pullback, then a final 5-wave blowout into the election. Watch out for centreline resistance on the drop.

DJI Future Map - A Correction is Imminent$DJI has been on an absolutely MASSIVE bull run since the collapse back in 2008-2009; a decade ago!
We all know what goes up must come down though and the DJI is due for another +50% correction.
This chart is on the Weekly. I usually prefer using the Day charts however I noticed some interesting trends that I hoped to share.
2008-2009
-The correction in 2008 was 55% from top to bottom
-The RSI at the peak was slightly Overbought so a little surprised the price tanked -7784 points
2016-2018
-The 1.618 ratio (19008) took 8 years to be hit
-The 2.618 ratio (26793) took 1 year, 2016-2017
-The RSI at the 2.618 level was 95 – Super Overbought which made sense to see the beginning of a huge correction however that wasn’t the case. A double top formed at the same level and then -
the price corrected roughly -5000 points, -18-20% towards the end of 2018-2019
-This correction pinged off possibly the 1.702-1.786 level (21712) from the first FIB (08-09)
-The RSI was once again just slightly Overbought at 70-72 level
-Price has continued to climb due to various political measures; volatility between Trump and China (Tariffs) as well as the beginning of the Impeachment talk
-The FED also injecting the ‘NOT QE’ funds into the REPO arena has stimulated the economy as well
-The current RSI is at 67 so it’s getting once again very close to those Overbought levels that haven’t been met since a year ago when the correction occurred
-Trump officially Impeached on December 18th and the $DJI keeps pumping
Beyond
I can’t predict the future but based on my FIB mapping, I’m expecting the possibility of a massive recession/depression type correction to be made when the 3.618 (34577) level is met. This is based on the FIB calculation from 2008-2009.
The current movements are lining up quite nicely with this FIB chart and the new FIB chart if calculated from the future ‘top’ indicates that we will see a re-tracement to the 0.618 (26627) level and in my opinion ultimately back down to the 1.618 (13761) level where I believe a good amount of resistance will be met. This is a negative 60% drop!
In the event 2.618 (896) level is met (worse than a Depression) that’s a negative 96% dump. I dunno if this will happen, but my guess is that we'll see this drop in-between 2021-2022.

DOW JONES NOT REVERSING YET: WEEKLYThe Dow Jones Industrial Average is still looking like a strong bull on the weekly timeframe. The candles have not yet formed a reversal pattern, there is still potential for the upside after breaking the previous top. On a weekly candle once a pin bar formation of a strong reversal Doji forms then we can talk about the potential downside. For now, the target is still the top of the channel at 28650-28700.
There is a potential for a slight retrace but price should not get much below 27300 on a long-term perspective. That will ensure structure holds well bullish. Each failure off the top of the channel was followed by a 6.60% retrace, for that to occur price has to move up to the top of the channel, IF there is a 6+% retrace, the channel and bull structure is broken and the move lower can price the Dow Jones into correction territory.

DJIA Stay In A Risk-On MoodUS equities rallied last week to new record levels with the Dow Jones Industrial Average breaching 28,000 for the first time. Soft economic data, Trump’s impeachment hearing, Hong Kong protests, and Middle East unrest were all considered secondary factors in investment decisions.
Today European stocks kick off a new week a little flat, with more talks between the US and China failing to excite investors in the way they have been recently.
So, what now? With the economic calendar being empty to during the start of the week, any trade updates will dictate the mood in markets. As things around the trade talks stand optimistic, the Dow is set to hold above the 28K level at the open. The market is trading on the strong side of an uptrending Gann angle from the 25,743 main bottom on October 3. Look for the uptrend to continue as long as the Dow futures contract holds above this angle.
The 55-day moving average has risen to 26,972 and could provide support if the price begin to fall. A move through 27,400 will shift momentum to the downside. This will not mean the main trend has changed, but it will indicate the selling is greater than the buying at current price levels. While the nearest main bottom 25,743 hold, the uptrend is safe for now.


DJI SHORTDJI (US30) SELL
Entry 1 27,320
Entry 2 27,370
Sl 27,421
Tp.1 27,120
Tp.2 27,000
Tp.3 26,890

DJI Short --Waiting for Catalyst TVC:DJI FOREXCOM:DJI TVC:DJI OSE:DJIA1!
Waiting for catalyst to Short the market

Thoughts on the Dow Jones Heading Into the WeekendHope you guys enjoy the video, be sure to leave a like, comment, and follow for future posts!
The Dow Jones was down about 600 points today as President Trump continued his sparring session with China, and increased tariffs yet again. We can see a dangerous M forming on our 1 day time frame and I indicated crucial support levels with the fibonacci as well as the dashed red line. If those levels do not hold, we will see the Dow take a plummet in the next week, and the talk of a recession may become a reality. Looking at our shorter time frame, we can see the Megalodon timer giving us a green. I hope that this is a sign that buyers will hold the support levels for the Dow Jones, and hopefully the US and China can come to an agreement soon, so that we may continue our bullish run in the stock market!
Our most powerful indicator called the bottom on Bitcoin! Check it out here!

What's Next For the Dow Jones?The Dow Jones has been all over the news as always, but very volatile as of late. With trade wars escalating, the question of a recession is at the front of the headlines. If we look at our 1 day time frame we can see our fibonacci retracement level right below the dashed line I put on the chart. This is the danger zone. Looking at the chart pattern we can see a dangerous M beginning to form. The MacD also looks suspect as the DJI had a rough day. If the Dow cannot hold these levels between the dashed line and the fibonacci line, we may really see a volatile downwards movement. It is not looking great. If we turn to our shorter time frame though, we can see that the Megalodon timer is giving us a green. Hopefully this will be enough to boost us back upwards, because if not... the talk of a recession may become a reality!
The Megalodon indicator uses a machine learning algorithm, combined with data from over 500 buy setups, and over 2000 indicators to produce extremely accurate buy signals on any and all asset classes! You will also receive real time buy and sell signals for the stock market, cryptocurrency, as well as forex markets! We also completed our cryptocurrency automated trade bot. It trades for you, using our backtested indicator with phenomenal results! Click the link in my bio and try out the megalodon indicators today!

DJI big fall aheadThe Dow Jones hit historical maximums. I believe this is just a bull trap and a big fall is on the cards.
We see on the chart a big RSI divergence and the price printed somewhat of a doji just before season earnings started. Also MACD (not in picture) confirms the bearish momentum. It has been reported that earnings this quarter are going to be pretty bad and the Fed rate cut has probably already been weighted in.
A fall to the 26700 area will happen in a quick way. I believe the correction will be stronger and a fall all the way to the 25400 area is very very plausible.
I am ready to short this market at the minimum retracement.
Do you have different ideas? Let me know in comments!

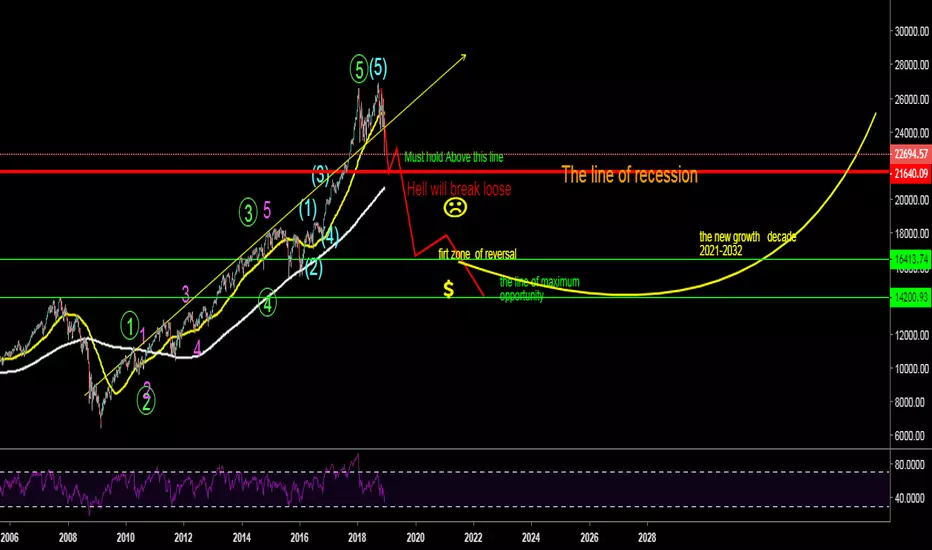
Recession Part 1 : The Dow CrashSince last recession(2007-09) DJI have been growing steadily in last 10 years without any break.
All impulsive trends comes with pullback/recession/ and DJI is no such exception..
If dow jones cant hold above the redline (21640) we might see big down trend coming in markets which has already been started.
Few reason:
www.nasdaq.com
www.theguardian.com
www.washingtonpost.com
If recession comes then it would be a new opportunity in coming decade and can make you super rich and wealthy.But the question is will you be at the right side of the trend?
Fly me to the moon...27420-27460 is the overhead trend-line resistance...but how can the US Stock market resist 28000? Or even 30000? They just love hitting the big numbers.

US30 - Friday BULL - REVERSE to SHORT by END OF DAYEntered LONG at 26600 and futures gapped up. TP1-26675, TP2-26790.
I plan to reverse my positions probably 1 hour before extended close today. To be ready for BIG SHORT on Monday.

DOW/DJI Market Analysis - Entering Consolidation PeriodDOW/DJI graph looks like it's in consolidation.The blue lines (solid and dotted) represent areas where I expect the price to go up/down to. They are the support and resist.
The green circle represents a period of time where I think the consolidation will come to an end.
What is consolidation? It's when the market is undecided if it will go up or down.
What happens when the consolidation comes to and end? We will see a move that will "break" the blue lines and head up or down.
The way current conditions are, this consolidation period will come to and end between January 2020 and May 2021. We could then see a crash or break-out. The move up or down, when we come out of consolidation, might be slow as well.
The lowest the price will go (before the end of consolidation) is around 22000, the highest around 26500.
This is not financial advice. Remember that everything is dynamic and up to interpretation of the trader and the tools they use. I will keep updating this graph every so often as conditions change.

The Great "FOMO" DEPRESSION - When to sell BITCOIN & buy STOCKSHi,
i zoomed out as far as i could (Dow Jones, logarithmic Chart)
My assumption is based on the believe of an historic trend channel.
At first, some Events, to put things into perspective:
The "Great depression" of 1929 - 1930
had Around 88 % Correction from Top to bottom.
Bretton Woods: 1971, the USA rendering the dollar a fiat currency
Lehman Brothers Collapse, Small Crash of 2008
Around 50 % Correction from Top to Bottom.
The Top of BTC will correlate
with the bottom of the Stock Market.
(Tripple Bottom in the end of 2020)
The Crash of 2019 - End of 2020.
Around 70 % Correction from Top to bottom.
Liquidity Crisis, Trade War & the Rise of Bitcoin.
BTC acting as a non-correlating asset due to decreasing global liquidity, + the BTC halvening May 2020.
XRP value will also increase & flood payment corridors with needed liquidity. (Nostro Accounts no longer needed)
Nostro Accounts are needed, if a Bank uses the Swift System to transfer money international.
In this Accounts is a lot money "Frozen" for settlement.


DJI SHORT 1 HR My Trading DiaryHere the turning point sin DJI
new highs
(Blue Line)
and new lows
(red line)
But with the real points where you had the chance to trade that system.
In many cases the shwon trades of trading services have never been
there in realtime.
In also many other cases it has not been for normal traders
any chance to do it like the pros.
But here you are able if you watch my 1 HR Charts
to start a long position at
25848
and to go short and out of this position at
26320
in Realtime = 470 Points Long + 180 Points Short at the moment 9.4. end
of trading day
as shown with the RED VERTICAL Lines.
Good trades for all

DJI Situation end of 15.3.2019 LONG
Hello everyone who is watching my charts.
Here is the update to the end of today's DJI trading day
The situation remains unchanged.
What should we pay attention to on Monday?
We now have 2 long trend lines
the one in the steep Long channel I have marked blue.
But I'm afraid this steep uptrend will not last long.
But below that we have an interesting 2nd new long trend line which has developed the last few days and which I marked red.
This trendline seems to me to be the more important in the longer term,
As long as they do not break the situation continues long.
First a break of this red line puts the Long Setup in a neutral setup.
Underneath there is an important support in the area 25550 which I marked black.
If it breaks we are in Short Terrain.
But at least there is no sign of this level tonight.
---------------------------
--This information is not a recommendation to buy or sell. It is to be used for educational purposes only .Alllways do your own research---
----------------------------

DJI LONG BREAKOUT 15.3.2019 11:30 NYTNow we have an interesting sign here.
DJI has break ot of the short channel (i have marked them in red)
and comes bak to our well known blue trendline from 11.3.2019
Thats a really strong sign.
DJI managed not only to go sideways out .
Strong up and trading along the long line in blue.
I exspected now higher prices
Also to notice
We have taken out the resistance at 25757 and thats also a fine
long sign.
I will update that at end of todays trading.

DJI Situation 14.3. 10:00 NYT SHORT but possible tredn changeDJI has managed to get our off the sharp short channel
i had marked fe day ago into a more wider short channel
now i have marked in red to see them easily.
But since 2 days we have also an established long trend
to see at the blue long trendline which i have marked
as support on the long side.
Now we only can wait what will happens next.
a) a brake of the blue long line as stay in short
or
b) a brake of the red line to get in a neutral and maybe long aerae.
Both possibilities are equal weighed in my eyes
and i cant see any advantage for one of them to forecast
Lets check the DJI end of today trading, i am shure
we can see more clearly the situation.

DJI SHORT end of 12.3.2019In the opposite direction to the Nasdaq situation we have here now the DJI.
DJI is still caught in the bigger short channel i have marked in red lines.
He tried to go out at end of yesterday and start of todays trading but
the outbreak failed.
Now the upper line (i have matrked the channel in red lines)
is the important resistance line for the ext trading days.
Unfortunately for the bulls the yesterday established
long trendline has been broken today (now in orange color)
That not a strong sign.
It is to exspect either a fall dwon in the trend channel or a
sideways go out, but also these possibility is NOT a long
setup.
If that occures we have to check the situation new
whether there comes up a new long trendlie or similar strong signs
or not.
So for now situation is still Short in the channel
--This information is not a recommendation to buy or sell. It is to be used for educational purposes only .Alllways do your own research---
