SEC Charges Trump Media Auditor With Massive Fraud Stock Slides The US Securities and Exchange Commission (SEC) has charged former president Donald Trump's auditor, Benjamin Borgers, with a "massive fraud" and a "sham audit mill." The SEC alleges that Borgers did not properly prepare and maintain audit documentation, fabricated audit planning meetings, and passed off previous audits for the current audit period. The SEC claims that Borgers and his firm were responsible for one of the largest wholesale failures by gatekeepers in financial markets, putting investors and markets at risk and undermining trust and confidence in markets.
Of 369 BF Borgers clients whose filings from January 2021 through June 2023 incorporated BF Borgers' audits and reviews, at least 75% incorporated audits that did not comply with the SEC's rules. The company acted for Trump Media ( NASDAQ:DJT ) during the period of the SEC's complaint. In late March, Trump Media merged with a publicly traded shell company, Digital World Acquisition Corp, in a deal that valued the minnow social network at close to $8bn. The company now trades under the ticker symbol "DJT", using Trump's initials.
Trump Media's shares ( NASDAQ:DJT ) have fallen sharply since their debut but have continued to significantly boost the former president's wealth. The company is now valued at more than $6.5bn, with Trump as the company's largest shareholder and recently qualified for a bonus for the company's share performance that boosted the paper value of his stake to $3.7bn.
Djt

🚨$DJT: It's Not Over Yet! 🚀🚀🚀Hi everyone,
Despite a significant drop of 21% today, our indicators suggest the downtrend might not persist. A rebound above the daily level could signal a bullish trend, potentially leading to a weekly cross above the monthly. This could aim the price towards the $63 mark, aligning with the 0.618 Fibonacci resistance level. Conversely, if the price dips below the daily level, the monthly level could offer support. Let's see where this goes in the next few weeks.
Good luck!

Trump Set to Receive Bonus Worth $1.2Bn for $DJT PerformanceFormer President Donald Trump to receive a staggering $1.2 billion bonus, courtesy of the performance of his social media venture, Trump Media & Technology Group (TMTG). Despite the tumultuous journey of $TMTG's stock value, Trump stands to benefit substantially from an "earn-out" windfall, underscoring the complexities of his post-presidential financial landscape.
The bonus, predicated on TMTG's shares maintaining a threshold value of $17.50 for a specified period, catapults the paper value of Trump's stake in the company to a staggering $3.7 billion. This windfall comes at a crucial juncture for Trump, as he grapples with mounting legal challenges and substantial financial liabilities stemming from civil lawsuits.
However, TMTG's stock performance has been far from steady, mirroring the tumultuous nature of Trump's post-presidential endeavors. Despite an initial surge following its debut on the Nasdaq stock exchange, TMTG's stock value has experienced sharp declines, punctuated by bouts of volatility and speculation.
The company's CEO, Devin Nunes, has hinted at potential market manipulation by short sellers, further adding to the intricacies of TMTG's stock saga. Additionally, political scrutiny looms large over TMTG, with allegations of influence peddling and financial backers drawing the attention of lawmakers and regulatory bodies.
Amidst this backdrop, Truth Social, TMTG's flagship platform, has emerged as a focal point for Trump's communication with his supporters. Despite its relatively modest user base compared to established social networks, Truth Social has carved out a niche within the right-wing digital sphere, amplifying Trump's voice and agenda.
As Trump navigates the complexities of his legal battles, including a landmark criminal trial, the financial windfall from TMTG serves as a testament to the intertwined nature of politics, media, and finance in the modern era. With each fluctuation in TMTG's stock value, Trump's fortunes wax and wane, reflecting the broader narrative of his post-presidential legacy.
As the saga of Trump Media & Technology Group ( NASDAQ:DJT ) continues to unfold, one thing remains certain: amidst the turbulence of the market and the corridors of power, the intersection of politics and finance continues to shape the trajectory of one of America's most polarizing figures.

Trump Media & Technology Group ($DJT) Rose Over 9.61Shares of Donald Trump's media and technology company, Trump Media & Technology Group (DJT.O), rose over 9.61% on Friday after it asked the Nasdaq exchange to help prevent alleged market manipulation in its shares by so-called "naked" short sellers. The company disclosed this in a Friday filing with the Securities and Exchange Commission.
In the letter to Nasdaq CEO Adena Friedman, Trump Media CEO and former Congressman Devin Nunes suggested that the "naked" short-selling practice was to blame for the highly volatile nature of the company's shares. Short selling involves borrowing a stock to sell it on the expectation that the price will fall, then repurchasing the shares and pocketing the difference. "Naked" short-selling, which is generally illegal in the United States, involves selling shares without first borrowing them or determining they can be borrowed, creating the risk that the seller may not be able to deliver the shares.
Trump Media shares have been volatile and, in recent days, have hovered at nearly half their March 26 debut closing price of $57.99. "Reports indicate that, as of April 3, 2024, NASDAQ:DJT was 'by far' the most expensive U.S. stock to short," Nunes said in the letter, citing a CNBC report from April 3. He did not provide evidence of naked short-selling but noted that as of April 17, DJT was on Nasdaq's Reg SHO threshold list, which he said is "indicative of unlawful trading activity."
The threshold list is comprised of securities that have failed to clear for five consecutive settlement days, which can indicate naked short-selling or administrative or technical issues. Nunes did not accuse any specific firms or individuals of naked short-selling but noted that "data made available to us indicate that just four market participants have been responsible for over 60% of the extraordinary volume of NASDAQ:DJT shares traded: Citadel Securities, Virtu Americas, G1 Execution Services, and Jane Street Capital."

DJT Dead Below $32 | Bullish Above $32Unbiased scenarios for DJT media of Truth Social, based on simple conditions of holding or losing a neckline at 32 bucks.
Below $32 = Bearish:
A weekly close below $32 that isn't immediately recovered in the following week likely means it is headed further down towards 12.50. There is an unfilled gap around ~17.50-18.50, so at the very least it could revisit that area.
Above $32 = Bullish:
Should the weekly remain above $32 instead, expect to see it revisit $82 with an eventual weekly close near that level, and then continuation up towards $132
Best of luck!

Trump Media's Truth Social Sink Amidst Share Registration FilingFormer President Donald Trump's foray into social media, Truth Social ( NASDAQ:DJT ), faced a significant setback as its parent company, Trump Media & Technology Group Corp., ( NASDAQ:DJT ) registered shares for potential resale. This move sent shockwaves through the market, with the company's stock plunging by as much as 20%.
The registration includes shares held by insiders and those linked to warrants, marking the first step towards allowing Trump and other insiders to potentially capitalize on their stakes in the company. With as many as 146 million common shares and 21 million shares issuable upon warrant exercise now registered, investors are closely monitoring the situation.
The impact was not limited to common shares alone; warrants, which are tied to the stock and allow holders to exchange them for shares, also experienced a significant downturn, dropping by 12%.
While such filings are customary for blank-check deals like Trump Media's, completed last month to take the company public, the move has raised concerns among investors. However, it's important to note that the filing does not necessarily mean an immediate sale is imminent, nor does it guarantee future sales.
Technical Outlook
Truth Social stock ( NASDAQ:DJT ) is trading below the 100-day Moving Average (MA) residing in the oversold region with a Relative Strength Index (RSI) of 27.12 indicating a strong bearish trend.

Donald Trump’s Stake in Truth Social Parent Drops to $3BillionIn a dramatic turn of events, shares of Donald Trump's media and technology ( NASDAQ:DJT )venture took a nosedive on Monday, plunging as much as 12% and exacerbating a relentless downtrend that has significantly diminished the value of his stake in the operator of Truth Social to a mere $2.9 billion.
Since its much-hyped debut in late March, Trump Media & Technology Group ( NASDAQ:DJT ) has been mired in turmoil, with investors growing increasingly wary following the disclosure of substantial losses earlier this month. The company's once-promising trajectory has now been overshadowed by mounting financial woes, casting a shadow over its prospects and sparking a mass exodus of disillusioned shareholders.
Closing at $37.17 on Monday, the company's stock languished far below its record high of $79 attained during its debut, marking a staggering 40% decline since the onset of April. The grim downturn not only spells trouble for Trump's financial interests but also poses a significant setback to his potential windfall, as he contemplates leveraging his shares to fund his anticipated 2024 presidential campaign and legal expenses.
With Trump's stake in the company shrinking from approximately $6 billion just last month to a paltry $2.9 billion, the precipitous slide underscores the tumultuous journey of Trump Media & Technology Group in the unforgiving landscape of media and technology.
While Trump's dwindling fortunes may spell gloom for the former president, short-sellers are reveling in the chaos, reaping market-to-market profits amidst the stock's freefall. With a short interest of approximately 4.75 million shares, short-sellers have capitalized on the company's woes, albeit at a significant cost. Despite Monday's decline translating into a $16 million profit for those betting against the stock, short-sellers remain ensnared in substantial losses, down 69% for the year.
As Trump Media & Technology Group ( NASDAQ:DJT ) grapples with its spiraling valuation and mounting investor skepticism, the company finds itself at a critical crossroads. With uncertainties looming over its ability to navigate the turbulent waters ahead, the fate of Truth Social's parent hangs in the balance, leaving stakeholders on edge and investors bracing for further volatility.

Trump Media & Technology Group ($DJT) Plummets by 21.47%The journey of Trump Media & Technology Group ( NASDAQ:DJT ) took a turbulent turn as the social media venture witnessed a steep decline of 21.47% in its stock value following revelations of significant financial losses and ongoing legal disputes. Despite a high-profile public debut, NASDAQ:DJT finds itself grappling with mounting challenges that have cast a shadow over its future prospects.
Financial Struggles and Market Volatility:
Trump Media & Technology Group ( NASDAQ:DJT ) disclosed a staggering loss of over $58 million in 2023, sending shockwaves through the investor community and triggering a sell-off. The initial surge in NASDAQ:DJT 's stock, driven by enthusiastic retail buyers, quickly reversed as the reality of financial setbacks emerged, leading to a sharp decline in share prices.
Implications for Trump and Shareholders:
While Donald Trump retains ownership of 78.75 million shares, potentially amounting to a significant windfall, the recent sell-off has eroded a substantial portion of its value. Legal restrictions prevent Trump from selling or borrowing against his shares for the next six months, adding another layer of complexity to the situation. Despite the downturn, DJT's market value still exceeds $6 billion, albeit significantly lower than its initial public offering (IPO) valuation.
Short Sellers and Market Dynamics:
Short sellers targeting NASDAQ:DJT witnessed a significant recovery on Monday, underscoring the heightened demand for shorting NASDAQ:DJT shares amidst financial uncertainties. However, the scarcity of borrow supply adds complexity to the short-selling landscape, reflecting the volatility and speculative nature of DJT's stock.
Financial Performance and Competitive Landscape:
DJT's financial struggles are further underscored by its modest revenue of $4.13 million in 2023, compared to competitor Reddit's $800 million. Additionally, Truth Social's relatively small user base poses a challenge in competing with established platforms, exacerbating DJT's uphill battle in the social media landscape.
Legal Battles and Uncertainties:
In addition to financial woes, NASDAQ:DJT faces legal disputes with co-founders Wesley Moss and Andrew Litinsky, adding another layer of complexity to its challenges. These legal battles compound the uncertainties surrounding DJT's prospects, highlighting the uphill battle it faces in establishing itself as a viable competitor in the social media arena.

Donald Trump’s Media Company Spikes 50% On Wall Street DebutIn a whirlwind of market activity, Donald Trump's media company, Trump Media & Technology Group ( NASDAQ:DJT ), made its much-anticipated debut on Wall Street, sparking fervent investor interest and a flurry of speculation about the former president's latest venture.
Shares in Trump's media empire surged an astonishing 50% in early trading, as eager investors clamored for a piece of the action in the inaugural session of trading on the Nasdaq index. The company, trading under the ticker name NASDAQ:DJT —aptly representing the initials of its founder—saw its stock soar to remarkable heights, with Trump's majority stake valued at a staggering $5.9 billion.
The meteoric rise in Trump Media & Technology ( NASDAQ:DJT ) Group's stock price was fueled in part by news of Trump's success in securing a substantially reduced bond of $175 million in his ongoing civil fraud case—a development that injected newfound optimism into the company's prospects. However, the exuberant market response belied underlying concerns about the company's financial performance, with Truth Social, Trump's social media platform, reporting significant losses in its operations.
Analysts, while acknowledging the enthusiasm of Trump's supporters driving the stock's valuation, cautioned against overstating the company's underlying business prospects. Thomas Hayes, chairman of Great Hill Capital, characterized the valuation as "rich relative to its underlying fundamentals," suggesting that investor enthusiasm may be outpacing rational assessment of the company's true value.
The emergence of Trump Media & Technology Group ( NASDAQ:DJT ) comes on the heels of its merger with Digital World Acquisition Corp, a blank-check company, underscoring Trump's knack for leveraging strategic partnerships to propel his business endeavors. The use of the DJT ticker, a nostalgic nod to Trump's earlier ventures in the 1990s, adds a touch of familiarity to the company's Wall Street debut, evoking memories of Trump's foray into the hospitality and gaming industries.
Yet, amidst the jubilation surrounding Trump's resurgence in the business world, lingering legal challenges loom large, casting a shadow of uncertainty over his financial fortunes. Trump's ongoing legal battles, including the civil fraud case and a criminal hush money case, threaten to disrupt his plans for leveraging his newfound wealth from Trump Media & Technology Group.
Despite the jubilant mood among Trump's supporters, skepticism remains regarding the company's long-term viability and its potential impact on Trump's political aspirations. The success of Truth Social and Trump Media & Technology Group hinges not only on financial performance but also on the broader cultural and political landscape, where Trump's polarizing persona continues to command attention and controversy.
As Trump navigates the complexities of both the business and legal arenas, the fate of Trump Media & Technology Group hangs in the balance, poised between triumph and turmoil. While the company's soaring stock price may herald a new chapter in Trump's entrepreneurial journey, it also underscores the volatile intersection of politics, media, and finance in today's ever-evolving landscape.
In the corridors of power and the boardrooms of Wall Street, the saga of Trump Media & Technology Group unfolds—a compelling narrative of ambition, resilience, and the enduring allure of the Trump brand. Whether it emerges as a triumph or a tempest remains to be seen, but one thing is certain: the world will be watching closely as the story unfolds.

U.S Equity Index’s Overview – A Repeating PatternU.S Equity Index’s Overview – A Repeating Pattern
The Bull Thesis – Ascending Triangles
The 200 day (blue line on each chart) is squeezing price up towards each red resistance line making each chart look like an ascending triangle (evident on every chart). With the 200 day as underside support for price and the 200 day sloping upwards, things remain positive.
The Bear Caution – Throw overs, Transportation Lag and the Hidden Wedge
We need to be aware and cautious of a throw over top on each chart which is always a possibility. Price on each chart would need to fall back below the red support line (pricing having only been thrown over the red line to come back down again).
The DJ:DJT – Transportation (Chart 1) is lagging behind all the other charts and has not taken out its Nov 2021 or Jul 2023 highs. This relative weakness in Transportation is worrying as this index offers an early indication of potentially less manufacturing and goods being transported, with this chart lagging and failing to take out its highs, it could be an early indication of a more pronounced slowdown in the economy. This chart we need to keep a very close eye on. If DJT fails to rise above its red line and loses the 200 Day, this could be a very bad signal.
We also need to be aware of how one important chart is showing a rising wedge pattern (Chart 3 – Major Market Index TVC:XMI ). This old school chart is watched by the OG traders and investors as a more general market chart. Lets keep an eye on the upper diagonal on the rising wedge for resistance on this one. A rejection here could be something of an early warning sign and obviously losing the red support line would confirm this.
Charts 4 - 6
4. S&P 500 SP:SPX
5. NASDAQ NASDAQ:NDX &
6. US Small Cap 3000 TVC:RUA
All these charts appear to be about to break into all time highs, however they are slightly lagging the Dow Jones Industrials TVC:DJI and the Major Market Index TVC:XMI which have broken all time highs. In the Charts 4 - 6 break out above their red lines (above recent all time highs), this could be another confirmation signal of bullish momentum. Obviously a rejection at this level does not bode well.
SUMMARY
In this hard to navigate market environment we need to pay attention to DJT (Chart 1) and XMI (Chart3) as they provide clear boundaries that we can watch for hidden bear signal warnings. On the contrary, in the even these charts and charts 4 - 6 breach their respective resistance levels mentioned above we can be assured that the wind is at out back in this currently confusingly bullish market.
If you like this overview please let me know and I will complete similar overviews for other markets and indices.
Thanks for reading
PUKA

GENERAL MARKET INDICES REACT POSITIVLY TO FOMCFOMC DAY
All Major Market Indices initially making progress higher and reacting positively to the the FOMC meeting. Whilst these are monthly charts I'm sharing the prices are updated as of moments ago.
Main comments from Powell Today:
🔸TODAY AT FED MEETING MANY PEOPLE MENTIONED THEIR RATE FORECASTS
🔸THERE WAS A GENERAL EXPECTATION THAT RATE CUTS WILL BE A TOPIC OF CONVERSATION GOING FORWARD
🔸LITTLE BASIS FOR THINKING ECONOMY IN RECESSION NOW
🔸ALWAYS A PROBABILITY THERE IS A RECESSION IN NEXT YEAR
The Charts
What originally looked like a series of double tops now appear to be showing significant strength. The top 3 charts have a habit of letting us know where the market is going. At present that appears to be higher albeit the Dow Transportation Index is still lagging a little (Chart 1) and technically one would think this would be leading all others.
We should still be on watch for a throw over double top, but for now we have nothing to suggest this is the case.
If these markets can make support on the red line this could be good solid confirmation signal of price moving higher for longer 😉
Stay Nimble and congrats if your in the green
PUKA
PUKA

ARE WE ARE ABOUT TO WITNESS A TRAIN WRECK FROM THE FRONT ROW?This evening I was watching TV and I get an email alert. The title of email, “Wall Street’s 2024 SP500 forecasts are out, are you positioned?”, … and to my surprise (not really) the future looks bright for the US stock markets next year. I immediately thought to myself…What did I click on to get this garbage? LOL Truthfully, I didn’t think that…I eagerly went to my office to open the email to see what firms were peddling what train wreck of a guess, and to what extent would market participants buy into this publicity stunt. If you’re like me and you’re either directly affiliated with the US markets or just a hit and run reader of online financial news, you probably get emails just like these. Obviously, these emails are click-bait for readers of market news…it worked on me.
I practice a form of market analysis called Elliott Wave Theory. To be brief, this form of analysis charts the price action that market participants create each of every time they buy and sell. The buys and sells are obviously based on their positive or negative sentiment within any particular market. The patterns tend to be repeating, and fractal in nature, from the intraday to the very long-term time durations. Based on their repeating nature these patterns can be very accurately forecasted long into the future. This form of analysis does not take into account market and economic news or events. The basis for this theory created by RN Elliott in the 1930’s is that news and external events are not causal with the respect to the pattern and its aftermath. A great example of this would be the last two earnings releases for Nvidia (NVDA) in both the August and November releases. Each release far exceeded analysts’ expectations on both revenue and EPS, but the resulting stock price behavior was to decline 20% and 10% respectively. However, in both cases those types of stock price behaviors could have been forecasted in advance.
On November 30 I posted this article,“ Is NVDA Headed to $467 " Later in the trading day, NVDA followed through as forecasted. This was not a function of magic, just EWT analysis and good ole' fashion math. Now for full disclosure, the rally off the October 27th bottom in the markets was not entirely unanticipated I just did not expect to the extent it has rallied and I had deemed that potential alternative pathway showing a rally, low probability . Now, having rallied from late October to last Friday, I would not get too excited about that sort of price action persisting. More on that when I update followers next time.
Back to the 2024 SP500 targets. From Bank of America to Goldman Sachs, not one firm is projecting the SP500 to be down next year. In fact, they forecast modest growth in neighborhood of 5% to 10%, with some other firms as high as 20% higher from current levels. The above chart is the SPX cash market from inception. You can see with arrows how I am forecasting the future price action. I have written on this subject matter ad nauseum. Nonetheless, I wonder if these latest SP500 targets from Wall Street firms are elevating market participant expectations, only to set up a pending train wreck. Are we willing participants?
Is Dow Theory Dead?
Dow Jones Transportation Index
Do Small Caps no longer lead?
Small Caps Index
I'm reminded of this true story.
In 1849 the Texas county of McClennan thought it was a good idea to approve an event for the (Missouri, Kansas, Texas Railway) known as KATY for short, railway executive George Crush to market two steam engine trains of his deliberately colliding head on into each other. The event was highly marketed and touted as free to attend. However, to get to the area of the event in rural McClennan county, you had to buy a ticket on one of George Crush’s trains for $3.50. In today’s dollars that fare would be $125. On the day of the event, a whopping 40,000 people lined up to witness the spectacle. Ironically, the sheer total human population in attendance on that day, rivaled the total population of Texas’ largest city at the time. The main event got underway with the two trains chugging towards each other at top speed and collided in spectacular form,…right up until the steam engines of both locomotives exploded, and jettisoned debris in such violent form, that scores of people were injured, and 2 people actually died that day. Between the event promoters, staff, county officials, and each and every soul that made a conscience decision to attend such an event on that day, apparently not one thought, this could be the outcome. In hindsight the result seems both obvious in its destructive and harmful potential, while simultaneously being inexplicable why no one thought it was a bad idea.
Are there two metaphorical locomotives running towards each other now in the economic world? Is the CNBC’s of the world, and Wall Street analysts of today with their lofty 2024 SP500 predictions nothing but a bunch of latter-day George Crushs’? Saying its free to attend their publicity stunt, but transport will cost you an arm and a leg.
Then you literally have to pay up. Time will tell.
Best to all,
Chris

General Major Market Indices - An Overview of the MarketGeneral Major Market Indices
These six market indices give a very good snapshot of where we are in this difficult to discern market and why uncertainty still lingers as we continue to climb a wall of worry.
The Chart
▫️ Every index 1 - 6 below has been rejected or is struggling to make new highs on the weekly timeframe.
▫️ At the same time each chart appears to be finding support on the 200 day moving average (40 week moving average). You could argue that ascending triangles are forming, in which scenario we would await a confirmation breakout above the upper resistance line.
▫️ Charts 1 – 3 appear to be leading charts 4 – 6
- You can see that the DJ:DJT , TVC:DJI and TVC:XMI charts
(Charts 1 – 3) have all attempted to break above the
overhead resistance and have been rejected or are
struggling to break through.
- Conversely the CBOE:SPX , NASDAQ:NDX and TVC:RUA charts
(Charts 4 – 6) have made lower highs and have not
yet reached up and even tested the overhead
resistance... For this reason these charts are
showing relative weakness.
▫️ In prior Macro Mondays it was made very clear that Charts 1 – 3 can provide advance warning of recession and or bear market declines ahead of charts such as 4 – 6. Charts 4 - 6 are showing relative weakness and appear to be lagging charts 1 - 3, for this reason revisiting this snapshot would be beneficial to see can we get a lead on the S&P500, Nasdaq and US Small Caps. This in turn could give us a lead on the entire market.
▫️ At present we are above the 200 day moving average on every chart and the 200 day moving average is sloping upwards ✅
- This is positive and would reinforce an ascending
triangle thesis however at this stage, looking at all
the charts a definitive break above the overhead
resistance line would be a preferred entry with
stop losses placed under that resistance line thats
been broken.
- A revisit of the 200 day moving average could also
be another entry consideration, simply because
again you have stop placed under the 200 moving
average, defined entries with defined stops under
them.
In summary, charts 1 – 3 can act as leading indicators of where price will go next in the general market. Charts 4 – 6 are showing relative weakness, potentially making lower highs however this could change in coming weeks as a strong green candle is challenging the recent highs. Ideally we want to see a definitive break above the overhead resistance levels and we would rather not see further overhead rejections or a breach below the 200 day moving average.
The beauty of Trading View is that you can revisit this exact chart on my page, press play and see if we have we broken through the resistance lines or fallen below the 200 day moving average, all at a glance. Be sure to make use of it to save you the time and effort of reviewing every chart. You can get a the jist of these major indices all with a glance. Regardless I will do my best to update you here on X.
If you like these broader analysis covering multiple stocks in particular index's or in particular sectors, please let me know.
What are the components of each index?
- This is for those of you who are unsure what each index is made up of and what they represent.
1. Dow Jones Transportation Index - DJ:DJT
- The Dow Jones Transportation Average (DJT) is a price-weighted average of 20 key transportation stocks traded in the United States.
- The transportation sector acts as a leading indicator as it is further up the value chain ahead of the final products being sold by companies in Dow Jones Industrial Average $DJI. For this reason, in some circumstances we can use the DJT as a helpful leading indicator for the direction of the economy
2. Dow Jones Industrial Index – SDJI
- The Dow Jones Industrial Average, Dow Jones, or simply the Dow, is a stock market index of 30 prominent companies listed on stock exchanges in the United States. The DJIA is one of the oldest and most commonly followed equity indexes
3. Arca Major Markets Index - TVC:XMI
- The XMI is an overlooked chart often utilized by OG traders has been referenced by Sentiment Trader as a leading market index. XMI is a price weighted index consisting of 20 blue chip U.S Industrial Stocks, 17 of which are also in the Dow Jones Industrial Average. Within the index there is surprising blend of stocks that include transport, travel, food, pharma, energy and technology.
4. S&P 500 - CBOE:SPX
- The Standard and Poor's 500, or simply the S&P 500, is a stock market index tracking the stock performance of 500 of the largest companies listed on stock exchanges in the United States. It is one of the most commonly followed equity indices.
5. NASDAQ 100 - NASDAQ:NDX
- The technology index, the Nasdaq-100 is a market index made up of 101 equity securities issued by 100 of the largest non-financial companies listed on the Nasdaq stock exchange. It is a modified capitalization-weighted index and includes the likes of NVIDIA and the MAANG stocks (Meta, Amazon, Apple, Netflix and Google)
6. US SMALL CAP 3000 - TVC:RUA
- Small-cap stocks are defined as having a market capitalization between $300 million and $2 Billion. Examples would be Upstart and Victoria's Secret.
Thanks guys
PUKA

Macro Monday 17~Bear Market Confirmed? Macro Monday 17
The Dow Theory Confirms Bear Market
Today’s post may be thee most important Macro Monday of 2023 as it may be a key moment where we received technical confirmation of a change to a bear trend.
What’s Got Me Rustled?
Manuel Blay, the lead economist and editor from the Dow Theory has recently confirmed an S&P500 bear trend change to his subscribers. Why is this so important? Historically, the Dow Theory has provided some of the best signals for market participants. From 1920 to 1975 the Dow Theory signals captured 68% of the moves in the Industrial & Transportation Averages and 67% of those in the S&P 500 Composite Index.
Over recent years I have been keeping an eye on The Dow Theory’s predictions and they were one of the few who signalled a warning in early 2001 before the Dot.Com Crash in Sept 2001, and they signalled a warning prior to March 2020 COVID-19 Crash. They were also one of the few who turned bullish on the market from November 2022 when bears were out in their droves.
The Dow Theory has a proven track record of outperforming the stock market with significant drawdown reduction (less skin in the game during downturn periods). The Dow Theory is one thee most top ranked investment letters and people will pay very close attention to this recent release by Manuel Blay.
What is Dow Theory and How Does It Work?
There are many elements to the Dow Theory and I am going to try and explain some of the basics with the help of some charts.
In basic terms the Dow Theory is a technical framework that predicts when the market is in an upward trend if one of its averages (Such as Dow Jones Transportation Average) advances above a previous important high, accompanied or followed by a similar advance in another corresponding average (such as Dow Jones Industrial Average).
The theory is predicated on the notion that the market discounts everything, consistent with the Efficient Market Hypothesis. Efficient Market Hypothesis is something I live by, it is the hypothesis that states that share prices reflect all information, price being the aggregation of everything that’s happening. Price over everything, over the news and any other outside factors. Consistent alpha generation is possible focusing only on price. This hypothesis chants “the market knows best” or “trust the intelligence of the market/price”). The Dow Theory uses a combination of markets to help achieve agreement for the overall market trend using price.
In such a paradigm, different market indices must confirm each other in terms of price action and volume patterns until trends reverse. This means that one chart can lead another. It also means that if multiple charts are confirming a particular trend, this adds weight to the probability that that the new price direction is the new trend. This is important to understand as today we will see that out of the four most common charts used by the Dow Theory, three of them are confirming the bear trend and the fourth is leaning bearish (the final confirmation outstanding).
“The Dow Theory for the 21st Century” by Jack Schannep should be your go for a more detailed understanding of the Dow Theory or visit the TheDowTheory.com and become a subscriber.
The Bearish Signals are here
As noted above the Dow Theory mainly focuses on the price movements of four major market indices all of which we will individually cover on today’s Macro Monday:
1. S&P500 – Three Bearish Signals
2. Dow Jones Industrial Average Index – Three Bearish Signals
3. Dow Jones Transportation Average Index – Three Bearish Signals
4. NYSE Arca Major Markets Index – Two Bearish Signals (one pending)
S&P500 - SP:SPX
The price and price structure on the S&P500 chart has provided us with 3 key bearish confirmations (see Chart 1 Above)
Dow Jones Industrial Average Index - TVC:DJI
The DJI is significantly more bearish than the S&P500 as it failed to make a new high since its high in Jan 2022 whilst the S&P500 broke to new highs in July 2023. We could consider this as a negative divergence with the DJI providing us an advance warning due to its failure to establish a new high in July 2023, instead it confirmed a lower high.
The price and price structure on the TVC:DJI Chart has provided us with 3 key bearish confirmations also (see Chart 2 Below).
Dow Jones Transportation Average Index - DJ:DJT
Similar to the Dow Jones Industrial Average (DJI), the DJT also confirmed a lower high in July 2023 compounding the bearish signal already observed in the DJI. These could also be considered double tops with a lower high for the latter two.
The price and price structure on the TVC:DJI Chart has provided us with 3 key bearish confirmations also (see Chart 3 Below).
NYSE Arca Major Markets Index - TVC:XMI
Similar to the S&P500 the XMI chart made a higher high in July 2023 however this was a false break out followed by a throw over with price then falling through the 21 week moving average.
The price and price structure on the TVC:XMI Chart has provided us with 2 key bearish confirmations with the third pending confirmation, however with the 21 week moving average sloping downwards and with the three other charts above already having breached the diagonal resistance line, it is highly probable that the XMI will follow suit and breach its diagonal support line (see Chart 4 Below).
As you can see all charts are strongly suggesting that we have started to turn into bearish trend and all have an heir of a double top pattern. To be clear, this is using the Dow Theory approach which historically has been very effective at getting us on the right side of probability but there are no guarantees, there are times the Dow Theory has been completely wrong. Given that three of the charts are in complete agreement with the fourth looking liking to confirm a similar bearish path, probability strongly in the favour of the bears. For those who appreciate this theory they would now start to make some changes to their portfolios to protect themselves from a drawdown event, as noted in the introduction protection from drawdown events is where The Dow Theory really shines.
The Halloween Effect might fool us all
The Halloween effect on the markets is based on the historical tendency for the stock market to perform better between Halloween Oct and May Day (the "winter" months) than in the other six months of the year ("summer" months). It closely related to the oft-repeated advice to sell in May and go away. In particular the months of Oct – Dec are some of the best return months impacted by the Halloween effect. I will follow up with a chart in the comments that illustrate the % return of the Halloween effect versus the summer months.
In the past the Dow Theory and other market indicators have provided confirmation of a bear trend and the market has made higher highs thereafter only to be thrown over into a longer bear market many months later confirming the original bear trend thesis. The point being is that it is probable we are going to see some impact from the Halloween Effect and this could in fact press prices higher in the short term, and in some cases we can even make higher highs. We need to be extremely cautious if we make reasonable progress during the Halloween Effect period, perhaps this could be seen as an opportunity to take some profits and de-risk some of your portfolio.
I have covered the XMI, DJT, XMI and DJI charts in detail previously on Tradingview and here. Please review them if you would like to get more familiar with their components and historical performance.
As always folks, stay nimble in this market and reduce risk where possible
PUKA

DOW TRANSPORTATION .50 % and 618% The wave structure can be counted as a wave 4 drop this would setup the last wave up from today as the setup for support is been seen today . and put call models are set and oil is setup to break from 93/95.5 back to under 84 /79 this would be supportive for the djt

Dow Jones Industrial Average Key MomentMACRO MONDAY
Dow Transportation Average Index DJ:DJT
The Dow Jones Transportation Average (DJT) is a price-weighted average of 20 key transportation stocks traded in the United States.
The transportation sector acts as a leading indicator as it is further up the value chain ahead of the final products being sold by companies in Dow Jones Industrial Average $DJI. For this reason, in some circumstances we can use the DJT as a helpful leading indicator for the direction of the economy
Currently we are at a critical juncture on the DJT chart as we are testing significant resistance levels
- The DTJ Index is at a critical diagonal and horizontal
resistance level
- A break through or rejection of the resistance will
provide insight into the direction of the economy
- There is a potential Head and Shoulders pattern
that needs to be validated or invalidated which will
be defined by the price reaction to the resistance
zone.
We can observe what happens over the coming weeks and how price reacts to the resistance. Can it break above it and turn it into support?
When the DJI is climbing higher while the DJT is falling, it can be a signal of economic weakness ahead. A divergence of this sort means goods are not being transported at the same rate they are being produced, suggesting a decline in nationwide demand.
This type of divergence occurred prior to the March 2020 crash with the DJT making its ATH in Dec 2020, thereafter the DJI made a new ATH in February 2020 whilst the DJT was closing almost 5% lower making a lower high. Those that study Dow Theory were key observers of the divergence and acted accordingly safeguarding their portfolios.
Thankfully, at present there is no divergence. I will follow up in the comments with a chart showing that the DJI and the DJT are currently very closely aligned. Regardless paying close attention for a divergence could be very beneficial for your portfolio. I will certainly be on the look out and notify you in the event of.
Thanks for reading and welcome to Macro Mondays
PUKA

SPX & Dow divergencesI firmly believe the Dow transports are an important leading metric to identifying the overall strength in the economy.
Since the highs in Feb, transports have not participated in the rally to the upside.
What this tells me under the hood of this economy we are seeing weakness.

DOW TRANSPORTATION JUST STARTING DOWNThe chart posted is that of the DJT . As everyone is focused on the qqq and sp 500 and the flight to safety in tech DO NOT ASK ME WHY BTW . The markets are now in the HOPE stage. This is usually followed by Fear and then Despair . and then the last stage Denial . that is the BOTTOM

SPX 500 - just the technicals please - part 2 Technical review of the stock market after the FOMC rate hike and Jerome Powell speech. All in the video - I'm tired and will update tomorrow.

DJT....Have we seen this before?Similar pattern appearing on the DJT.
Will we see the upside move completed or will it fail like it did in 2018/2019.

DIA trading within CPI Range from June!Dow Jones is still trading withing the range of the past few days which also places it within the range it was in back when we had a major decline following a disappointing CPI report back in the beginning of June. This puts the market in a position that could see a potential breakout in either direction. Can we possibly see economic data that propels the Dow higher out of the top of the range or will the trend of negative data to end the year continue forcing the market out of the lower end.
Manufacturing data released today suggest that the economy is continuing to slow, and we have recently seen forward earnings projections for giants such as Tesla ($TSLA) and Apple ($AAPL) be reduced. This is consistent with a muted rally we are seeing here for the Dow to start off the week and a 1% down day for the Nasdaq. I stand by my previous statement here to start off the week. I would be looking for short positions, with potential long positions to hedge going into 2023. However, we still are trading within this range and have no indication yet as to which way the wind will blow for the Dow Jones Industrial Average. There are some other signs that point to the potential outcome such as a weakening semiconductor industry ($SMH) and transportation index ($DJT) still trading below its 8 day average.

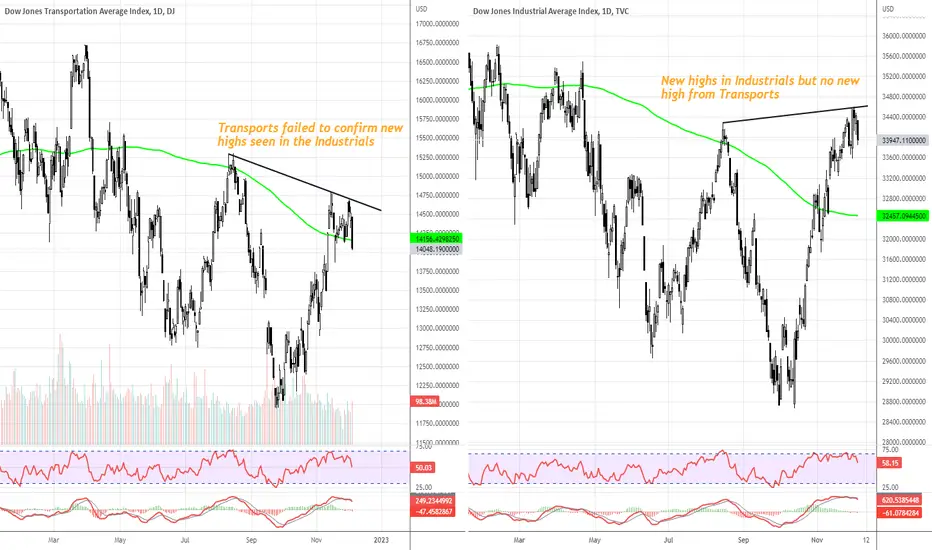
#DOWTHEORY transports failing to confirm new highs in industrialIf you believe in Dow Theory then the fact that transports have not been able to make a new high compared to the August Swing highs, should make you doubt the new highs seen in the industrials. Normally this is a sign of underlying weakness so the expectation would be for further weakness to come in general equities.
DJT Is BullishDJT, a leading economic indicator, is breaking out of a long falling wedge pattern that targets the all-time high daily candle body closes. This is yet another piece of the puzzle suggesting a much better second half for this year. Bollinger bands squeezing so tight and multi-month divergences are also indicating that it won't be a small move.
