Djt


SPY Next Week Expected Moves ($52) + Gravity PointsLast week's call had me nervous for a second there. A very chaotic week, but I had several opportunities to put on a couple positions. Hats off to anyone who waited for that upper expected move. (two opportunities)
Large expansion for the expected move from last week to this week = expect volatility to pick up.
Couple quick notes:
- 10 yr / 3 mo yield inverted. You now are paid more to buy a 3 month bond than a 10 year bond. Fundamentally this makes no sense because you should be compensated for the additional risk of loaning your money for longer periods of time. Ill share some of my excel doc data of different yield curve pair inversions for the 10/3because it's so important:
---> 10 yr / 3 mo yield inversion time prior to next Recession: Average = 13 Months
---> S&P 500 Peak to start of recession percentage gain/loss: Average = -13.3% Median = -13.5% (Most losses happen prior to official recession)
---> S&P 500 percentage gain/loss during Recession: Average = -1.3% Median = 6.7%
---> Number of Months from Peak to Recession: Average = 8.7 months Median = 8.5 months
---> Number of Months in Recession: Average = 13.5 months Median = 10.7 months
---> Recession Start to S&P 500 Trough: Average = 8 months Median = 5.3 months
- Powell signaled to the market that the economy is weak
- Germany slowdown bad Friday morning manufacturing report
- China slowdown
- Brexit delated but nowhere near resolved
Best of luck next week gentlemen
- RH
P.S. Wish me luck on my Series 7 exam on Friday next week!

Next Week Trade Plan: $82 Expected Move + Gravity Points + ExtraFor what it's worth, I don't have any Gravity Points identified under the "Gravity Point Very Hard"
Chart Dump this week. See what I see.
Last Week's Post
Other Relevant Charts:
(One Last Rally)
(Interesting Development)
(Kings Crown)
(Extremely Useful)
(Combo Equal-Weight Indice Chart)
(Extremely Useful)
(Should've made it public)
(Semi-Useful)
(Just for fun)
Sector & Indice Trendline Watch:
I use a fan of different trendlines from different anchor points (candle wick, candle body, Day prior, Day after, ect.) and connected them in a similar way to 2015/2016 Lows to capture a more complete picture of the trendline. That way I'm not second guessing if the trend is broken or not because I have all of the possibly variations already displayed. See Below:
Indice:
(Broke?)
(Very Weak)
(Hanging on)
Sector:
(Strong)
(Very Weak)
(Struggling)
(Broke)
(Still Well Above)

Transports Fall -10% In One Week? ... :oNot a whole lot else to say other than that.
Transports are the brother of Small Caps in my opinion as far as leading the rest of the market.
Just want to point this out because it's a canary in the coal mine and easily missed.
1 Wk % Change:
SPY: -4.55%
NDX: -4.92%
DIA: -4.44%
IWM: -5.52% (Leading)
DJT: -10.14%......?

DJT - Trading the Dead Cat Bounce Pattern (UPDATE).The DJ:DJT chart corresponds to an update of the chart published in the article "Trading the Dead Cat Bounce Pattern."
TheLiveTradeRoom

S&P 500 Trading Plan: $47 Implied Volatility + Gravity PointsLast week's Implied Volatility was $49. This week's Implied Volatility Expected Move is $47. So another volatility contraction right? Wrong. We've got a holiday next week folks and we've got three and a half trading sessions. Given this, I'm inclined to say it's going to be a pretty volatile week.
I zoomed in to the 15 minute time frame here, as opposed to my usual 30 minute chart because I wanted to show just how extremely accurate and important these Gravity Points have been for weeks and weeks now. Use them.
I intend on making another 30 minute time frame just for continuity and bigger picture.
Last Week's Trading Plan:
- Incredible action last week here.
- On the button we came back inside of the Implied Volatility Expected Move.

Trading the Dead Cat Bounce Pattern.The DJT daily chart corresponds to the chart published in the article "Trading the Dead Cat Bounce Pattern."

S&P Expected Move ($65) + Gravity Points -Next Week Trading PlanIt's getting dicey out here.
Huge moves in the market this last week.
Last week $90 expected Move. We moved all of that and then some.
Next week only a $65 expected move. We saw that kind of action in the S&P's on Friday. All of next week, we're supposed to move $65, but we did that on Friday. I anticipate the price action will move OUTSIDE of the expected move.
Here's a more "Busy" chart on the 15 minute for active traders:
Good luck next week gentlemen,
- RH
__________________________________________________________________________________________________________________________________
Some other work I've done recently:
Redid my trendlines for the 100th time.
The two multi-trendlines and one final trendline from the (2009 Low - 2016 Low) & the (2009 Low - 2nd 2016 Low), (2009 Low - 2018 Low);
This is a big deal.
https
Recognize that if this breaks, it will be resistance on the way up.

Daily SPX Spells TroubleShares of the S&P 500 (SPX) are in serious trouble. We've violated a multi-year trend line going back to recession lows of 666 (white line), sliced thru the major moving averages like the government slashes through our money, so I'm officially calling the uptrend over... until proven otherwise, sell in to any strength and hedge yourself!
Happy trading and be careful out there!

One of DJI's Confirmations Not Looking Good - DJTAs is suggested by the heading even though we're seeing a rebound of DJI's rally one of it's confirming indicators is showing weakness. For the most part we use the Dow Jones Index as loose indicator of the overall economy, when it's performing well, on it's face, we discern that the economy is humming along well. As a confirmation for the thought process we use the Dow Transports Index, among others, and discern from if the rally is real or not. The reasoning being, as an index that follows the biggest transporting companies within the economy, it's reasonable to think if transports are performing well then commerce within the economy must be doing well. So, when DJI is rallying and it's confirmed by the DJT, along with other factors, we can discern that the economy is performing well. I'll move onto the analysis, to explain how the index is tracking.
Weekly
1. Noticed that there's been high volume in the last two years of trading relative to long-term trend, 200-moving average.
2. It's been trading in a channel YTD which is confirmed by relatively accurate tracing stochastic indicator.
Daily
1. Within the YTD channel, there's an interior resistance that's quite robust. That's where we find the index, today-July 25, 2018, and as with the other reactions from that interior resistance it's retracing back to the bottom of the channel.
2. The Stochastic indicator is tracing accurately with the index, which is on tracing downwards confirming the hypothesis.
Conclusion: The Dow Jones Index has been on an upwards trend but one of the confirming indicators is showing that that might be a faux-upswing. In terms of the overall economy, we're starting to see that the market starting to be affect by the tariffs and the trade war.

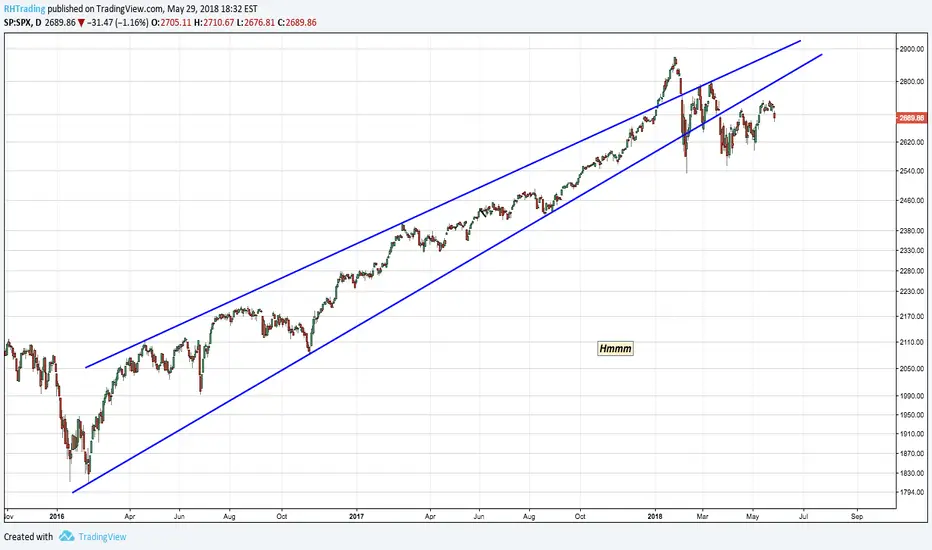
Charts That Make You Go Hmmmm (Pt.3) -"The Monthly Hammer Setup"I don't believe I need to explain candlestick patterns here, but I don't often visit the monthly chart and believe this could be easily missed by many.
I can count on one hand the number of times I see a monthly hammer in the last 15 years. It's 4 for 4 so far.

Charts That Make You Go Hmmmm (Pt. 2)Chart is in Log.
Tried to hold myself accountable to not take any liberties with adjusting trendlines ever so slightly to make it appear 'more' bearish. Trendlines are lows and highs absolutely.
I like the simplicity here. Just two trendlines.
Transportation Average Hello friends. I'm posting this for general reference. In my opinion this important index is right at the Green to Red boundary. Thank you for taking a look.

The trend is still lower!SPX has been a wild ride... even experienced traders like myself have been getting pushed around, stopped out, and left scratching our heads trying to make sense of this market. It's times like these that it's important to remember that the "why" isn't that relevant to us from a trading perspective. Technical analysis provides unbiased, objective, and most importantly, unemotional analysis that can cut through the headlines and tweets to help us position ourselves for the next move. Of course we may end up on the wrong side, but you have to think in terms of probability. For example, if there's an 80% chance of a decline versus a 20% chance of moving higher, which would you pick?
I also want to note that while most are intent on blasting Trump and the shit with China, that's not what started this mess. If we're being fair, the market is still up over 22% since his election even after the recent selloff. In fact, the catalyst that initiated the selling was actually a labor report that indicated wage inflation was picking up, which in turn may make the Federal Reserve tighten faster than the market expects. The headlines about trade wars and whatnot certainly didn't help, but they were absolutely not what started this move down, so don't be a sheep and believe the "Trump tanks markets" and "Trump doesn't care about investors" headlines... those are designed to sell news, not report facts!
Anyways, rant aside, the current trend is lower, therefore rallies should be sold until there's some indication that the trend has changed. I also want to note that the market has respected the Fib levels damn-near perfectly. As such, I see major resistance at 2663 and support at 2533-2554. Given the price action, I think that support fails and we make a new low. I have downside targets at 2459, 2421, and 2366 for the next leg lower. Whether or not that's the bottom will only be known once we get there and have more data to use.
Finally, I want to say that there are opportunities in a declining market, so don't think its time to sell everything and move to Utah in a bunker. However, if you're portfolio consists of only index funds and the like, I urge you to reconsider carrying such concentration risk and to use this time to rebalance your holdings and pick up some undervalued assets, as its the only way to outperform the market!
Happy trading!

Here's when I'll buy UPSI've wanted in UPS for a while but refused to chase the move higher. Now that we're getting some weakness, I'm eyeing this name for a long-term investment. I'll be a buyer on a test of the breakout level/50% retracement at $86.5. Shorter-term, I expect continued weakness, so there's no need to rush in to this one!

The Enduring Importance Of The DJIAHello friends. While critics of the Dow Jones Industrial Average believe its composition results in an outdated view of the world, its ties to the economy, whether real or psychological, are still significant. Here's my modest perception of the chart. Thank you for taking a look.

The sell-off in the stock market.Some say that that Dow Jones Transportation Average index can be used to predict the behaviour of the stock market. If it is true: the index seems to approach a support line. Perhaps this may indicate that the sell-off in the stock market is over soon? Well, we will see ...

$DJT ($IYT) leading $RUT ($IWM)?#Russell seems to have made a top, transports following (small) industrials first? #Dowtheory


$DJT leads $DJIAClassic theory. Had to stretch $DJT (red line). Let's see if $DJIA (blue line) follows it. Suggests ranging for months.

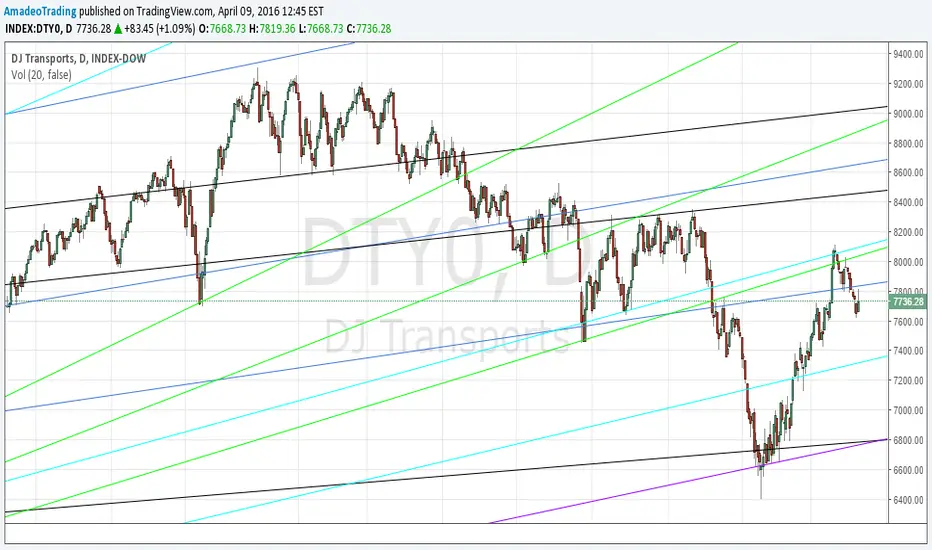
Dow Transports - Monthly TrendPrior to 2014 there have been 3 instances of the monthly RSI closing above 80 going back to 1988, Each of the three instances have lead to a return to the trend line noted below. In November of 2014, the DOW transports recorded the 4th instance of a monthly RSI close above 80 coming in at 86.
Recently the DOWT found support at previous resistance measured from the 1999 and 2008 tops. Should the DOWT go back below this support, I believe there is a high probability of retesting the long term trend line below. Depending on the timing, this would imply a long term target of 5500-6300 on DOWT.
