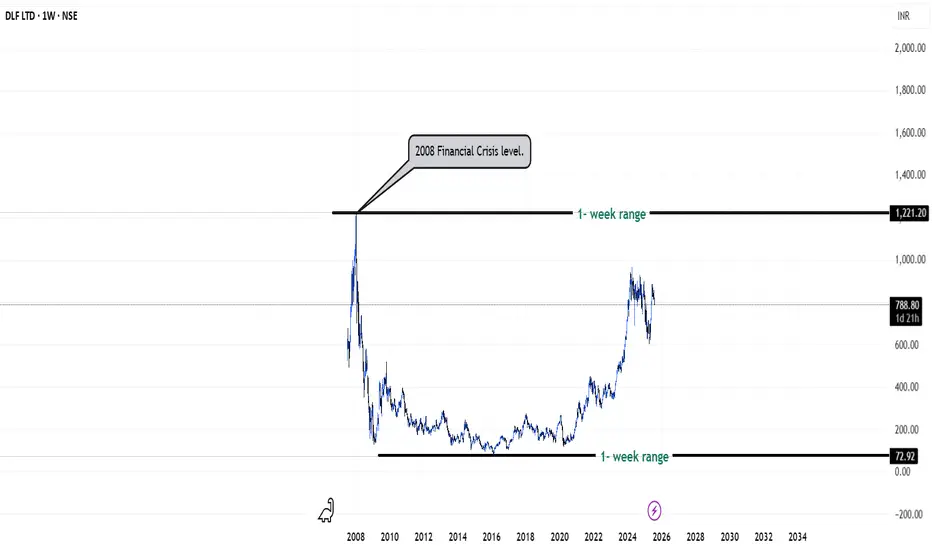
DLF is still struggling till today - {30/07/2025}2008 financial crisis it was so difficult for every corporate person in this living era,
Some companies have not yet recovered from the pre-2008 financial crisis level.
It is so hard to see them struggling,
I wish good luck to DLF company to make ALL TIME HIGH Soon,
Regards,
Happy Trading,
Stocks & Commodities Trade Analysis.
Dlfltd
Elliott Wave Analysis of DLF: A Technical PerspectiveHello friends, let's analyze the DLF chart on a daily time frame. Currently, we're observing a corrective phase, where the stock has completed a flat correction pattern (A-B-C) with a 3-3-5 structure. Following this correction, we've seen a significant drop, accompanied by a strong double divergence in the RSI indicator. Where Fibonacci Retracement of last long Rally on Weekly is near 50% - 55% which is less than 61.8% should consider as a Healthy Retracement
As the price is currently moving upwards, completing wave counts, a breakout above the downward trend line would increase our conviction in the analysis.
This analysis is for educational purposes only and not a tip or advisory. If the price breaks out and stays above the trend line while maintaining the low of 601, we can expect further upside momentum. However, 601 would remain a crucial invalidation level, and a breakdown below it would require us to reassess our wave counts.
Key points:
1. DLF chart analysis on daily time frame
2. Flat correction pattern (A-B-C) with 3-3-5 structure
3. Healthy Retracement
4. Strong double divergence in RSI indicator
5. Breakout above trend line increases conviction (Which is pending yet)
6. 601 as invalidation level
Please note that this is a Educational technical analysis post and not a recommendation to buy or sell.
I am not Sebi registered analyst.
My studies are for educational purpose only.
Please Consult your financial advisor before trading or investing.
I am not responsible for any kinds of your profits and your losses.
Most investors treat trading as a hobby because they have a full-time job doing something else.
However, If you treat trading like a business, it will pay you like a business.
If you treat like a hobby, hobbies don't pay, they cost you...!
Hope this post is helpful to community
Thanks
RK💕
Disclaimer and Risk Warning.
The analysis and discussion provided on in.tradingview.com is intended for educational purposes only and should not be relied upon for trading decisions. RK_Charts is not an investment adviser and the information provided here should not be taken as professional investment advice. Before buying or selling any investments, securities, or precious metals, it is recommended that you conduct your own due diligence. RK_Charts does not share in your profits and will not take responsibility for any losses you may incur. So Please Consult your financial advisor before trading or investing.

NSE:DLF 🏢 On Verge of Multi year breakout ??⁉️NSE:DLF
DLF Ltd., incorporated in the year 1963, is a Large Cap company (having a market cap of Rs 101,735.31 Crore) operating in Real Estate sector.
DLF Ltd. key Products/Revenue Segments include Property Development, Rental Income, Other Operating Revenue and Royalty Income for the year ending 31-Mar-2022.
For the quarter ended 30-06-2022, the company has reported a Consolidated Total Income of Rs 1,516.28 Crore, down 8.22 % from last quarter Total Income of Rs 1,652.13 Crore and up 22.06 % from last year same quarter Total Income of Rs 1,242.27 Crore. Company has reported net profit after tax of Rs 258.15 Crore in latest quarter.

DLF LTD Long term analysis
NSE:DLF read for strong rally as it has taken strong breakout of daily trendline as well as strong bounce of over an year of consolidated support zone.
Add more till 840 only with SL of 825.
Major targets are highlighted in Blue lines.

DLF LTDI am DLF LTD stock in 30 min T.F. and I am using trailing Stoploss after achieving 1:1 risk reward

DLF- WEEKLY TIMEFRAMEThe Structure looks good to us, waiting for this instrument to correct and then give us these opportunities as shown on this instrument (Price Chart).
Note: Its my view only and its for educational purpose only. Only who has got knowledge about this strategy, will understand what to be done on this setup. its purely based on my technical analysis only (strategies). we don't focus on the short term moves, we look for only for Bullish or Bearish Impulsive moves on the setups after a good price action is formed as per the strategy. we never get into corrective moves. because it will test our patience and also it will be a bullish or a bearish trap. and try trade the big moves.
we do not get into bullish or bearish traps. We anticipate and get into only big bullish or bearish moves (Impulsive Moves). Just ride the Bullish or Bearish Impulsive Move. Learn & Know the Complete Market Cycle.
Buy Low and Sell High Concept. Buy at Cheaper Price and Sell at Expensive Price.
Keep it simple, keep it Unique.
please keep your comments useful & respectful.
Thanks for your support....
Tradelikemee Academy

DLF LTD Supply zone breakout Mean (EMA) Diversion*DLF LTD*
Time Frame: Daily
Observation:
* Supply zone breakout
*Mean (EMA) Diversion
Resistance/Target: 422 458 497 521
Support: 361 344


Support and Resistance for DLFUpper line shows strong resistance for DLF whereas lower line shows the strong support.


DLF,DLF, 1H CHART
Target 316, 329
Stoploss 278
Disclaimer
Educational purpose only
Consult your financial advisor before trading or investing


BUY DLF GO LONG WITH DLF ENTRY LEVELS 151 TO 155
TARGET LEVEL 201
TIME SCALE 60 DAYS
STOP LOSS IS 1% OF ENTRY LEV

R-0091 Cash Sell DLF @ 136.30 - 136.50 SL 138.10 TGT 132Intraday Cash Sell DLF @ 136.30 - 136.50 SL 138.10 TGT 132
TK cross over on the downside
MACD cross over
RSI is oversold but still expect momentum to continue

DLF - Taking support at the lower trendline ?NSE:DLF is it taking support near the trendline or gonna break down going forward?

DLF potential long candidateIf NSE:DLF breaksout from the current supply zone, it can head towards 170-180 levels. If it can cross through that zone as well, then it could reach 198-200 levels.

you won't believe this comp is the biggest comp in real est indin terms of long term investment this stock has not done anything. but good news is, this stock is nr to supply zone

DLF shortDLF is in crucial level of resistence if it work according to it, that it can be go down till target

DLF BEARISH FOR THE WEEKSYMMETRICAL TRIANGLE PATTERN FORMING AND A VERY STRONG RESISTANCE IS THERE, WHICH STOPS SHARE TO GO UP.
