DOCU - Going up but how much ? Going for 220 first, followed by 240 and 250.
If price goes above 220 followed by a wave ii correction down to 206-210, that would give the best opportunity to buy in and hold till 245 at first.
DOCU

If DOCU breaks 220 it can go to 230.Support for NASDAQ:DOCU is around $189, resistance at 220, with the next horizontal resistance being near 229-230. Currently NOT long.

DOCU Testing July LevelsAfter a break in trend and a push down NASDAQ:DOCU has shown a depletion in seller power after bouncing off July resistance level. Ended the day showing a Bull Hammer candle and a shift in momentum. Resistance and support based loosely on Fibonacci levels from start of trend, mostly on retests however. Gap fill is price target on upside.


Nasdaq:DOCU DOCUSIng Inc -Big bang moveOut of consolidation of typical Flag pattern
Invested
Disc: sharing only for educational purposes

DOCU broadensmegaphone-ish broadening, but will consolidate and regather around S2: 174
E: 190 (fib .786 retracement holds)
T1: 216
T2: 225
S: 177.81

$DOCU Strong Conviction Long -Target $257I have rode this stock at least 5 times with call spreads but oddly have not posted about it for some reason. Here’s my thesis;
1. I use it to get paperwork signed religiously since COVID-19 hit, and I work for a very large investment firm.
2. Realtors rely heavily on it as well
3. Read 1 and 2 again
4. On Thursday, 9/3 DOCU is expected to report its first profits, as a publicly traded company.
5. My target is $257ish.

Docusign (DOCU)This thing has gone straight up and has been a beneficiary of the COVID pandemic. DOCU has currently been consolidating after its huge run from about $65.
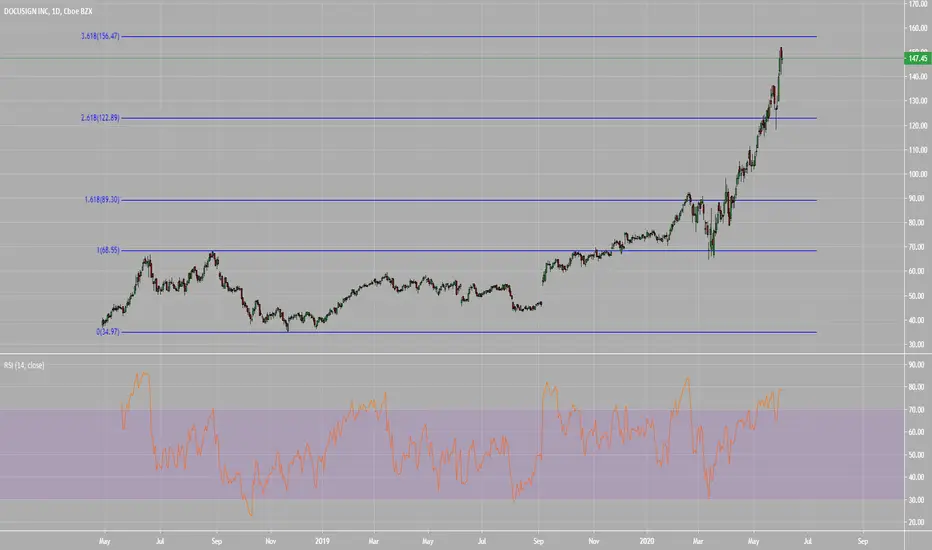
DOCU PT $262 or $182Docu has been on an absolute parabolic move lately. Will it continue? it is currently forming a bull pennant that if the top breaks, should send this to $262. If the pennant fails, this should drop to the bottom of the pennant and could begin the formation of a bull flag. If that fails, Docu could be heading back to $152 which would be very normal after this excessive run. Fib levels state the could be a retest back to the 1.618 level or roughly $152.

$OSPN OneSpan Bullish Technical / Fundamental Trade SignalOneSpan saw options trading volume of 5,818 contracts, representing approximately 581,800 underlying shares or approximately 147.6% of OSPN's average daily trading volume over the past month, of 394,105 shares. Especially high volume was seen for the $22.50 strike call option expiring August 21, 2020, with 612 contracts trading so far today, representing approximately 61,200 underlying shares of OSPN. Every time we have closed weekly above the 50W MA we have seen a major bounce.
$OSPN
Buy
Entry 18.98
Targets
21.01
23.00
Stop 17.80
Fundamental Research
- Announced minor accounting mistake ($2M of $500M Profit), reassured all beat/miss EPS still valid. Corrected Q2
- Did not file 10Q however filed next day from earnings
- 3 Day Rule After Crash
- Every time Closed Above 50W Big Move Up
- NASDAQ
- Software
- Multi-Vertical With Pharmaceuticals, Financials, Government, International, Healthcare, Small Business
- Recent Government Contract
- International
- Debt Free
- 20+ Years
- Educated Team
- Google Search Trends Up
- Website Traffic Up
- Subscription Transition Successfully with 30% Increase Q2
- Docusign Competitor (Recent HOT NASDAQ)
- 40% Crash After Over Reaction To Earnings
- Primarily Institutional Holdings
- Big Even $20 Completly Gapped On
$NASDAQ
$DOCU
$OSPN

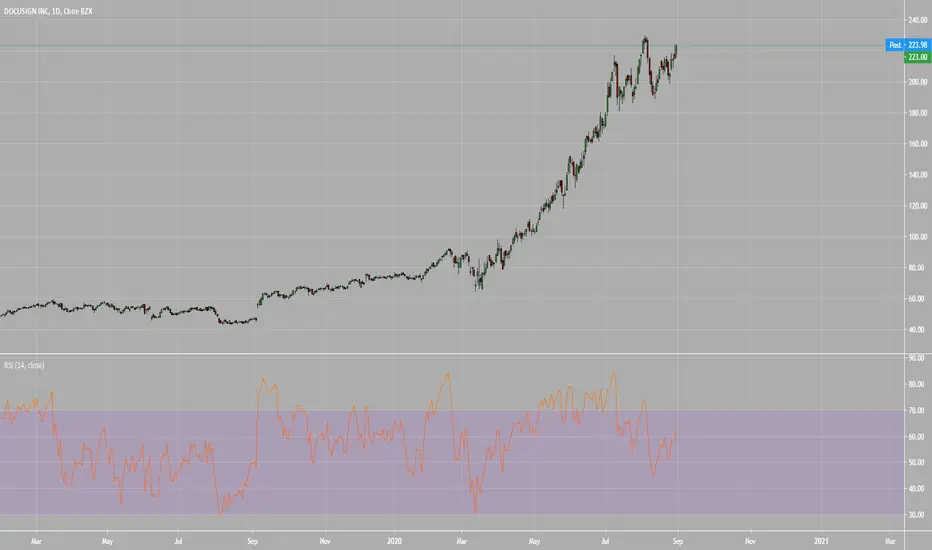
Docusign 20ema Since we crossed the 20 exponential moving average, we have tested it many times, to retreat and continue higher.
RSI has stayed above 50, showing no sign of strong selling.

DOCU - 8.68% Potential Profit - Ascending TriangleApproach this with care. Medium confidence on the Resistance Line due to a lack of touch-points.
Strong level of support, confirmed multiple times over the past 5 months in an uptrend corridor. Ascending Triangle formed within, just broken out.
Place a Limit Entry to ensure triangle support confirmation and decrease risk.
- Historical Uptrend and All-time High
- Pandemic-friendly Stock
- RSI + Stoch well above 50
- MACD above Signal.
Suggested Entry $220.43
Suggested Stop Loss $214.69
Target price $239.17


$DOCU NEW 52 HIGH IdeaDOCU $205 call buyer for 8/28/20 gives this chart a little more spice. Buyer placed a $1M bet on the $205, furthermore a $3.7m bet came in @ $195 to form a higher low. Worth watching

DOCUSIGN Parabolic SurgeDoucsign has gone completely parabolic since the pandemic started with professionals working more from home. We're looking for the first sign of a top to take a short position on this one. The trend is your friend, so we're waiting for a reversal confirmation as it may still have room to run.
First Target:
$165-$170 range
Disclaimer:
I do not provide personal investment advice and I am not a qualified licensed investment advisor. I am an amateur investor.
All information found here, including any ideas, opinions, views, predictions, forecasts, commentaries, suggestions, or stock picks, expressed or implied herein, are for informational, entertainment or educational purposes only and should not be construed as personal investment advice. While the information provided is believed to be accurate, it may include errors or inaccuracies. I will not and cannot be held liable for any actions you take as a result of anything you read here.
Conduct your own due diligence, or consult a licensed financial advisor or broker before making any and all investment decisions. Any investments, trades, speculations, or decisions made on the basis of any information found on here, expressed or implied herein, are committed at your own risk, financial or otherwise.
Feel free to give us a follow and shoot us a like for more analysis updates.

Double Up On $DOCU | Buying Shares Docu Up $147% Since March Earnings Report
Back in April, we tried to play Docu with $105 calls but sadly didn't pay for the time. If we would've thrown 3 months of time, each contract would be $8,000 each at the least ($80 in the money).
Our Play (Rating 9/10)
-Doubling up on our portfolio, adding 10 shares
- Options Play: $18 7/10 Call @ $390 per contract
Do not trade this, not financial advice
DotcomJack

Going Short on DOCU - Overbought, Showing Sell - (Opinion Only)My opinion is we see some rebalancing and profit taking soon. Not trading advice.
Open gap down at $151
Goodluck.
DOCU

Triangle Pattern Bullish, $145 Target for DOCUFirst off, please don't take anything I say seriously or as financial advice. As always, this is on an opinion based basis. That being said, today I was recently bullish on Docusign and am also seeing it ranked highly by many analyst. Many people are expecting a 65 to 73%+ revenue increase by the end of the year. All the signs show strong buy signals and an expectancy to surge quite soon.

[$DOCU] ATH Docusign PriceFR/ EN
Bonjour à tous,
J'espère que vous allez bien et que vous profitez du déconfinement progressif :)
Le secteur de la crypto est dans une neutralité extrême avec des possibilités de forte hausse ou baisse ... Du coup, j'ai décidé de prendre un peu de recul et après une première analyse du secteur Cannabis Medical () j'ai décidé de porter mon attention sur Docusign !
C'est simple, forte hausse aujourd'hui qui propulse la valorisation de Docusign à plus de 22 milliards de $
Le COVID-19 a fortement favorisé la nécessité plus que vitale d'adopter la signature électronique pour faire avancer l'économie.
La barre des 130$ vient d'etre touché , et nous sommes en bonne voie pour continuer à toucher les sommets !
Depuis le plus bas du 12 mars , le cours a doublé et n'a pas l'intention de descendre! très belle perf !
PS: Ceci n'est évidemment pas un conseil en investissement :)
Stay Safe
PEACE!
---
Good morning, everyone,
I hope you are well and that you are benefiting from the progressive deconfinement :)
The crypto sector is in an extreme neutrality with possibilities of strong rise or fall ... So I decided to take a step back and after a first analysis of the Cannabis Medical sector () I decided to focus my attention on Docusign !
It's simple, a strong increase today that propels the valuation of Docusign to more than $22 billion.
VIDOC-19 strongly supported the vital need to adopt electronic signatures to move the economy forward.
The $130 mark has just been reached, and we are well on our way to continuing to hit the heights!
Since the low of March 12, the course has doubled and does not intend to go down! very nice perf!
This is not a financial advise
Stay Safe
PEACE!

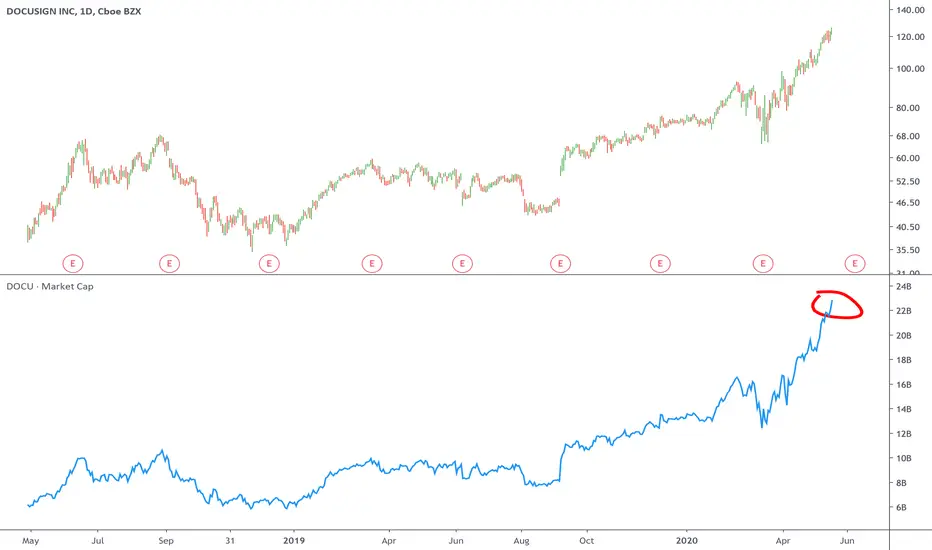
Signing Documents is a $22 billion businessDon't get me wrong, Docusign is a genius product. Today, it's valued at over $20 billion. This chart shows its market to all-time highs and its market cap.
A few questions to consider: is this market really that big? What is next for the company or what other areas can they expand into?
The other thought is that maybe, just maybe, the market is starting to overvalue the potential of certain companies. While Docusign is clearly a smart product innovation and product, it's also possible that markets are setting some lofty expectations for it.
Not short or long, just a post to make you think.