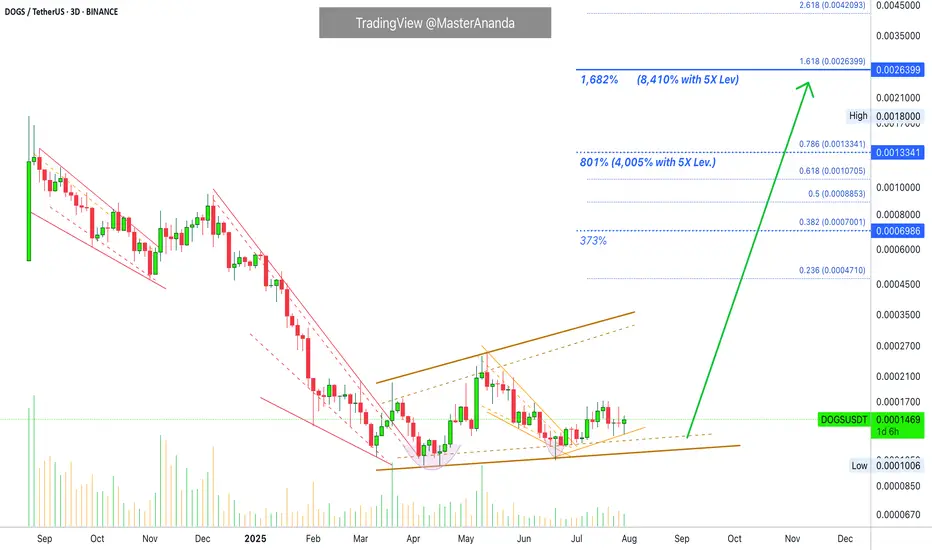
Dogs 5X Leveraged Trade-Setup (8,410% Profits Potential)Dogs continues to consolidation at bottom prices producing higher lows. With each passing day/session and candle, DOGSUSDT gets closer and closer to a strong bullish breakout. If you remember recently this pair produced for us more than 800% profits with 7X, the entire move was about 150% strong, between April and May. The move that will develop now will be many times stronger. With a leveraged position we can easily aim for 300-500% profits. So 5X lev. can easily do 1,500 to 2,500%. But this is only the start, the move that is developing now is a major advance, bull market type of situation, and this can result in more than 1,000% growth for Dogs and many other altcoins. This can mean really high profits with leverage.
Leverage increases the risk of default and makes the game that much more complex, so you should avoid it if you want peace of mind. If you don't mind the extra risk and stress, you can go for the higher profits. Timing right now is great.
Once or twice per year only we get this major positive entry, high probability entry. It doesn't happen often. Only once in a while the market forms a clear bottom, a support zone, and from this bottom a new bullish impulse is launched. Only once every several years, the time is now.
This is a strong chart setup. Dogs has been sideways now for a full six months. Six months sideways is the perfect time duration for a 1,000% bullish jump. Give or take 5X, we are looking at 5,000% potential for growth.
Patience is key. The market will bless us with endless opportunities like this. I will show you another one right away.
Thank you for reading.
Namaste.
DOG
DOG Main Trend. Reversal Zones 05/29/2025Logarithm. Time frame 3 days. The chart shows key reversal zones in the horizontal channel, and when exiting it. For clarity, percentages are shown from the skin reversal zone. This is convenient for understanding the risk and potential profit in long and short work. You can also work in spot from long, from key zones (more relevant, as margin trading on assets of such liquidity, is extremely destructive, due to price slippage under the market, but already on such assets by a huge percentage, for your liquidation (accumulation of liquidity-benefit of gambling addicts in general).
Now the price has hit the resistance of the internal channel, that is, the zone of the “main liquid” price movement. From the reversal, local profit is significant, therefore, when working, observe risk management and wait for a breakthrough of this resistance level (you can place a trigger order), or wait for a rollback (if there is one), for example, to the median of the channel.
The horizontal channel itself is reformatted into a potential “microphone” (what was half a year ago on bitcoin, with resistance to the 72 thousand zone, and liquidity collection 53-58).

DOG Rectangle + Structure AnalysisBITGET:DOGUSDT has been trading in a rectangle since June 2024, with well-defined boundaries.
After a downside deviation in March, it managed to reclaim the range and it's now attempting to break above $0.0040, a key S/R throughout its price history.
Key Levels to Watch
• $0.0018-$0.0020: Main demand zone
• $0.0040: Key S/R in place since May 2024
• $0.0058-$0.0060: Rectangle midline and previous S/R
• $0.0095-$0.0099: Main supply zone
• $0.0170: Measured rectangle target in case of a breakout
A successful daily close above $0.0040 should set the next target around ~$0.0060. Above that, there isn't much separating DOG from another retest of the main demand zone and ATH.


CZ'S DOG Broccoli meme token can be the next big thing in cryptoIf you haven't heard about CZ coin yet, here's the thing:
CZ announced the name of his dog Broccoli a week ago and posted a picture of him with his dog and followed it with a short video
He said that he didn't create an official meme coin for his dog and the strongest community is the one who will determine the official meme coin
Many created a meme coin for his dog Broccoli and wars broke out between investors to choose the right meme for his dog
Then Binance Alpha listed 3 coins named Broccoli in preparation for listing the one with the strongest community on the official Binance platform
So after analyzing the three coins, from my point of view, the choice fell on this coin whose smart contract ends with number 714, has the strongest community, the highest market cap, the most additions on centralized platforms, the highest daily trading volume and the first to be created on BNBChain
This may be an opportunity that will not be repeated soon for increases that may reach 10 to 20 times when listed on the Binance platform
Good Luck.

Datadog: S&P 500 Candidate?! Key Levels to Watch Now!Hi there,
When we talk about the most respected stocks in the market, getting added to the S&P 500 index is a big milestone for any company. It’s not just a status symbol—it’s an event that can push the stock price higher as funds and investors rush to buy it.
Datadog (DDOG) is one of the potential candidates , so let’s analyze what the price action is telling us.
Technical Breakdown:
Right now, Datadog stock is testing a key support level of around $130. This price level has acted as both resistance and support in the past, and in November last year, the stock broke above it. Now, it has come back to retest this level, possibly looking for a base before making its next move.
If $130 holds as support, and the company’s fundamentals remain strong, this could be a solid entry point for buyers.
A secondary support zone to watch is near $100, about 25% lower than the current price. This level has seen big price movements before, meaning there could be strong interest from traders and investors if the stock drops there.
As legendary investor Peter Lynch once said:
"If you sell instead of buying when a stock drops 25%, you won’t achieve long-term profits in stocks."
This idea is also the foundation of my approach – what to do when the price drops? Am I ready to buy more at lower prices? If the answer is something like “probably not,” “not sure,” etc., then it’s worth considering whether it’s even worth buying in the first place!
Plans for different types of investors:
Short-Term Investors: If you’re looking for a quick trade, you might want to wait for a dip to $100, where a stronger bounce could happen. Buying from current prices can be a bit risky considering short-term horizons.
Long-Term Investors: If you believe in Datadog’s continued growth, the $130 level might already be a good spot to start buying. But be ready to buy more if the price drops further.
Final Thoughts:
Datadog is a fast-growing company with strong fundamentals, but the stock also has a high valuation and faces competition. As always, do your own research and make sure your investment strategy fits your risk level and goals.
Cheers,
Vaido
🚀 Stay Ahead of the Markets!
Get high-quality technical analysis, real investment ideas, and key price levels—without the noise.
📩 Subscribe to my Substack for expert insights that help you trade smarter!
📱 On mobile: Just scroll down and select your preferred language.
💻 On desktop: Find the links in my BIO—copy & paste or click the Website icon to go directly to Substack ENG.

DOG. Is backed, you know?The previous entry point in January 2023, at its peak was x23 gains. If we consider the entry now - it is a point that is only 60% higher than the previous one. I am here again and I believe that the potential has remained the same. The local rebound can be up to 80%. After that, the moon cycle will begin.

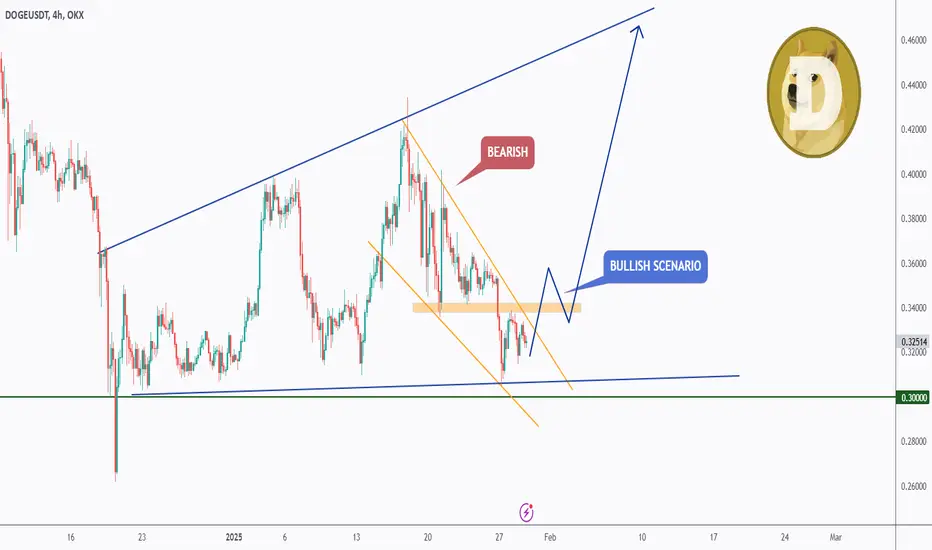
DOGE - DOGS vs BEARSHello TradingView Family / Fellow Traders. This is Richard, also known as theSignalyst.
📈 DOGE has been in a correction phase trading within the falling wedge pattern marked in orange.
🏹For the DOGS (bulls) to take over, and start the next impulse movement towards the upper bound of the blue wedge, a break above the last high marked in orange is needed.
For now, we wait! ⏱️
📚 Always follow your trading plan regarding entry, risk management, and trade management.
Good luck!
All Strategies Are Good; If Managed Properly!
~Rich
$DOG in a bullish channelAMEX:DOG is looking strong. The community is strong. This bullish channel has 2 major resistance lines: The previous ATH resistance line and the channel resistance lines. Once it breaks out of these two resistances, the sky is the limit. With almost 101,000 holders and ZERO tier1 CEX listings yet, this coin will fly once tier 1 listings start happening. And did I mention the fact that is the the No. 1 memecoin (rune) on the MARKETSCOM:BITCOIN blockchain? If CRYPTOCAP:DOGE the No.1 memecoin on Ethereum pulled almost $90 billion market cap last cycle, think of what the No.1 memecoin on MARKETSCOM:BITCOIN can pull. Also, the total supply is 100bn, and it's all been distributed, everything in circulation, no reserves, no team coins, nothing kept for anyone. Need I say more???

DOGUSDT 1DDOG ~ 1D
#DOGS If a big drop happens to this AMEX:MEME ,. This support block would be an excellent purchase for now. with a minimum target of 20%+

DogWiFHat: A smart hat for your wallet!Memesession season continues! Dog in the hat, target on the schedule. Technically you will see the final 5 wave, which will end in the area at the 2 fibonacci level. Believe in something!
Horban Brothers.

WIF daily 100% gains buy/hold V-shape recovery setup for bulls🔸Hello guys, today let's review daily price chart for WIF . Noteworthy V-shape recovery in progress, with a decent sequence of higher lows, so overall chart looks good for further gains. limited downside currently.
🔸Strong gains previously in September/Octber, right now re-accumulation
in progress so expecting more gains in this market in November 2024.
🔸Recommended strategy bulls: bullish structure and compression in progress. Accumulate near market price in the highlighted zone. Price target for the bulls is 4.50 USD, so it's a 100% BUY/HOLD trade setup. good luck traders.
🎁Please hit the like button and
🎁Leave a comment to support our team!
RISK DISCLAIMER:
Trading Futures , Forex, CFDs and Stocks involves a risk of loss.
Please consider carefully if such trading is appropriate for you.
Past performance is not indicative of future results.
Always limit your leverage and use tight stop loss.

Ascending triangle on SHIB last week can give 21% next daysSHIB if forming a ascending triangle since start of October;
From breakout at least 11% gains according to Fibonacci levels, but according to triangle target, can reach 21% (purple arrow shows triangle target)!

PEPE BULL to ...0198It appears that if Bitcoin does not enter a bearish phase, we will experience an altcoin season, presenting optimal long entry opportunities with minimal stop-loss requirements.
Therefore I see PEPE doing a 120% move up

DOG/USDT NEW INCREASE VOLUMEDOG/USDT shows the low time frame possibility for new volume which can affect the price for an uptrend. ( depend all on high chance) There are no guarantees in the markets.
The new increase volume updates always start with interest if there is a confirmation to follow and if there is a building with a hold for a time.
90% of coins this time are not building coins. Some % also show a start fake trend and return to where it started. time frame confirmation + high levels building is important for a healthy coin.

Meme coin DOG in a buy zone - Falling WedgeThe meme coin DOG on the Bitcoin network has already dropped around 65% from its all-time high and is forming a Falling Wedge pattern, which gives us a good buying opportunity in this region.
A breakout for an upward continuation could yield a profit of up to 150%.
Personally, I am accumulating some DOG in this region.

SHIBA INU (SHIB)Shiba Inu is a mystery investment strategy web3 layer2 conspiracy to make cryptocurrency on Ethereum better and be more than Dogecoin was going for as a layer1. Shiba Inu is in a gully price range right now. A lot of crypto that falls into a gulch has a hard time climbing out and continues to lose. Due to Shiba Inu being one of the highest in volume on the daily charts and highest in mcap value there is always a potential for the fear of a gully to be surrealistic to an end that leads the imagination to require therapy by eating m&ms mixed with pumpkin seeds; sweet and salty.

Bullish rise?DOG/USD is currently at a support level which is a pullback support and could potentially rise from this level to our take profit.
Entry: 0.1198
Why we like it:
There is a pullback support level>
Stop loss: 0.1058
Why we like it:
There is a pullback support level.
Take profit: 0.1356
Why we like it:
There is a pullback resistance level which lines up with the 61.8% Fibonacci retracement.
Please be advised that the information presented on TradingView is provided to Vantage (‘Vantage Global Limited’, ‘we’) by a third-party provider (‘Everest Fortune Group’). Please be reminded that you are solely responsible for the trading decisions on your account. There is a very high degree of risk involved in trading. Any information and/or content is intended entirely for research, educational and informational purposes only and does not constitute investment or consultation advice or investment strategy. The information is not tailored to the investment needs of any specific person and therefore does not involve a consideration of any of the investment objectives, financial situation or needs of any viewer that may receive it. Kindly also note that past performance is not a reliable indicator of future results. Actual results may differ materially from those anticipated in forward-looking or past performance statements. We assume no liability as to the accuracy or completeness of any of the information and/or content provided herein and the Company cannot be held responsible for any omission, mistake nor for any loss or damage including without limitation to any loss of profit which may arise from reliance on any information supplied by Everest Fortune Group.

Dogecoin has a strong bearish momentum, could it fall further?Price is currently on a resistance level which is a pullback resistance and could reverse from this level to our take profit.
Entry: 0.1364
Why we like it:
There is a pullback resistance level.
Stop loss: 0.1407
Why we like it:
There is a pullback resistance level which lines up with the 50% Fibonacci retracement.
Take profit: 0.1288
Why we like it:
There is a pullback support level which aligns with the 127.2% Fibonacci extension.
Please be advised that the information presented on TradingView is provided to Vantage (‘Vantage Global Limited’, ‘we’) by a third-party provider (‘Everest Fortune Group’). Please be reminded that you are solely responsible for the trading decisions on your account. There is a very high degree of risk involved in trading. Any information and/or content is intended entirely for research, educational and informational purposes only and does not constitute investment or consultation advice or investment strategy. The information is not tailored to the investment needs of any specific person and therefore does not involve a consideration of any of the investment objectives, financial situation or needs of any viewer that may receive it. Kindly also note that past performance is not a reliable indicator of future results. Actual results may differ materially from those anticipated in forward-looking or past performance statements. We assume no liability as to the accuracy or completeness of any of the information and/or content provided herein and the Company cannot be held responsible for any omission, mistake nor for any loss or damage including without limitation to any loss of profit which may arise from reliance on any information supplied by Everest Fortune Group.

Could Dogecoin bounce from here?Price is falling towards a pullback support level and could potentially bounce from this level to our take profit.
Entry: 0.1364
Why we like it:
There is a pullback support level.
Stop loss: 0.1270
Why we like it:
There is a pullback support level that lines up with the 138.2% Fibonacci extension.
Take profit: 0.1483
Why we like it:
There is an overlap resistance level.
Please be advised that the information presented on TradingView is provided to Vantage (‘Vantage Global Limited’, ‘we’) by a third-party provider (‘Everest Fortune Group’). Please be reminded that you are solely responsible for the trading decisions on your account. There is a very high degree of risk involved in trading. Any information and/or content is intended entirely for research, educational and informational purposes only and does not constitute investment or consultation advice or investment strategy. The information is not tailored to the investment needs of any specific person and therefore does not involve a consideration of any of the investment objectives, financial situation or needs of any viewer that may receive it. Kindly also note that past performance is not a reliable indicator of future results. Actual results may differ materially from those anticipated in forward-looking or past performance statements. We assume no liability as to the accuracy or completeness of any of the information and/or content provided herein and the Company cannot be held responsible for any omission, mistake nor for any loss or damage including without limitation to any loss of profit which may arise from reliance on any information supplied by Everest Fortune Group.

Bearish drop?DOG/USD has just reacted off the resistance level which is an overlap resistance that aligns with the 50% Fibonacci retracement and could drop to our take profit.
Entry: 0.1482
Why we like it:
There is an overlap resistance level which lines up with the 50% Fibonacci retracement.
Stop loss: 0.1565
Why we like it:
There is an overlap resistance level that is slightly below the 78.6% Fibonacci retracement.
Take profit: 0.1362
Why we like it:
There is a pullback support level.
Please be advised that the information presented on TradingView is provided to Vantage (‘Vantage Global Limited’, ‘we’) by a third-party provider (‘Everest Fortune Group’). Please be reminded that you are solely responsible for the trading decisions on your account. There is a very high degree of risk involved in trading. Any information and/or content is intended entirely for research, educational and informational purposes only and does not constitute investment or consultation advice or investment strategy. The information is not tailored to the investment needs of any specific person and therefore does not involve a consideration of any of the investment objectives, financial situation or needs of any viewer that may receive it. Kindly also note that past performance is not a reliable indicator of future results. Actual results may differ materially from those anticipated in forward-looking or past performance statements. We assume no liability as to the accuracy or completeness of any of the information and/or content provided herein and the Company cannot be held responsible for any omission, mistake nor for any loss or damage including without limitation to any loss of profit which may arise from reliance on any information supplied by Everest Fortune Group.

Bearish drop?DOG/USD is falling towards a support level which is a pullback support and a bounce from this level could indicate a double bottom pattern which could lead to a potential price rise.
Entry: 0.1364
Why we like it:
There is a pullback support level.
Stop loss: 0.1308
Why we like it:
There is a pullback support level which lines up with the 78.6% Fibonacci retracement.
Take profit: 0.1483
Why we like it:
There is an overlap resistance level.
Please be advised that the information presented on TradingView is provided to Vantage (‘Vantage Global Limited’, ‘we’) by a third-party provider (‘Everest Fortune Group’). Please be reminded that you are solely responsible for the trading decisions on your account. There is a very high degree of risk involved in trading. Any information and/or content is intended entirely for research, educational and informational purposes only and does not constitute investment or consultation advice or investment strategy. The information is not tailored to the investment needs of any specific person and therefore does not involve a consideration of any of the investment objectives, financial situation or needs of any viewer that may receive it. Kindly also note that past performance is not a reliable indicator of future results. Actual results may differ materially from those anticipated in forward-looking or past performance statements. We assume no liability as to the accuracy or completeness of any of the information and/or content provided herein and the Company cannot be held responsible for any omission, mistake nor for any loss or damage including without limitation to any loss of profit which may arise from reliance on any information supplied by Everest Fortune Group.

Bullish rise off 50% Fibonacci support?DOG/USD has reacted off the support level which is an overlap support that lines up with the 50% Fibonacci retracement and could potentially rise to our take profit.
Entry: 0.1564
Why we like it:
There is an overlap support level which aligns with the 50% Fibonacci retracement.
Stop loss: 0.1482
Why we like it:
There is a pullback support level.
Take profit: 0.1718
Why we like it:
There is a pullback resistance level.
Please be advised that the information presented on TradingView is provided to Vantage (‘Vantage Global Limited’, ‘we’) by a third-party provider (‘Everest Fortune Group’). Please be reminded that you are solely responsible for the trading decisions on your account. There is a very high degree of risk involved in trading. Any information and/or content is intended entirely for research, educational and informational purposes only and does not constitute investment or consultation advice or investment strategy. The information is not tailored to the investment needs of any specific person and therefore does not involve a consideration of any of the investment objectives, financial situation or needs of any viewer that may receive it. Kindly also note that past performance is not a reliable indicator of future results. Actual results may differ materially from those anticipated in forward-looking or past performance statements. We assume no liability as to the accuracy or completeness of any of the information and/or content provided herein and the Company cannot be held responsible for any omission, mistake nor for any loss or damage including without limitation to any loss of profit which may arise from reliance on any information supplied by Everest Fortune Group.
