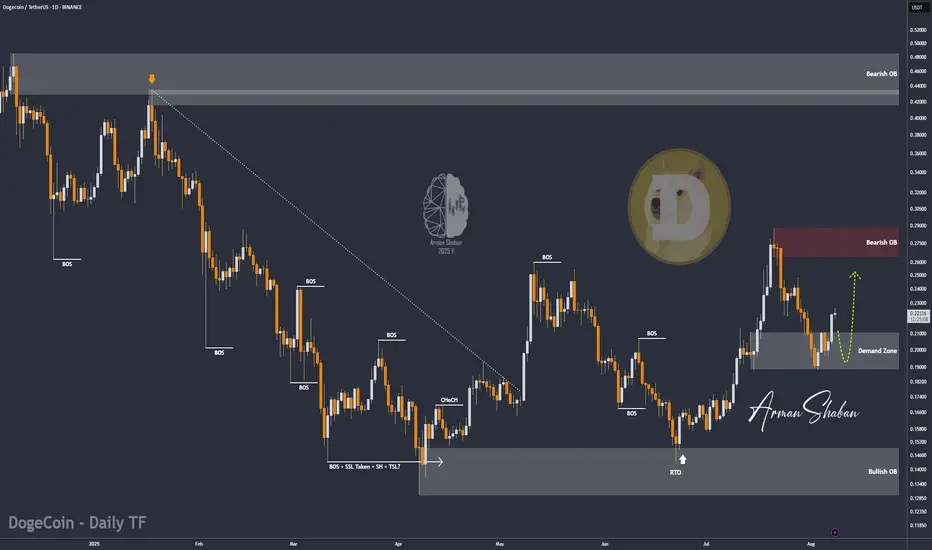
DOGE/USDT | DOGE Up 20% – Next Targets: $0.24, $0.287 & Beyond!By analyzing the Dogecoin chart on the daily timeframe, we can see that, as expected, the bullish reaction has continued, and DOGE is now trading around $0.226. This analysis has delivered over 20% returns so far. The next targets are $0.24, $0.287, $0.32, $0.41, and $0.70. Hope you’ve made the most of this move, and stay tuned for the upcoming updates!
Please support me with your likes and comments to motivate me to share more analysis with you and share your opinion about the possible trend of this chart with me !
Best Regards , Arman Shaban
Doge
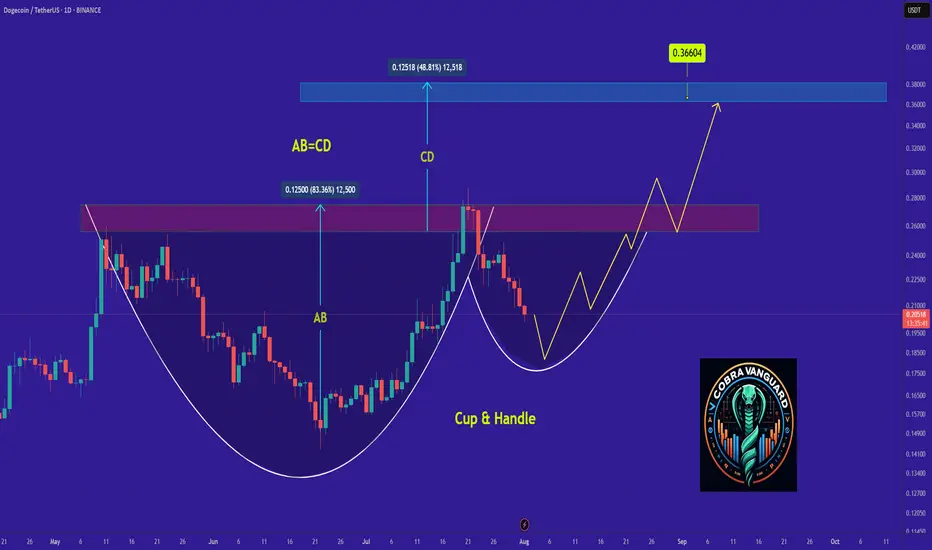
Do you think I'm joking ???It appears that the price is forming a cup and handle pattern, and if this occurs, it could push the price above $0.30.
Best regards CobraVanguard.💚

DOGE: Golden Cross Incoming After 33% Pullback
This is DOGE on the Daily
This chart is screaming upside potential.
The move began with two higher lows off the 0.786 Fib level at \$0.15924. From there, price blasted through both the 50MA and 200MA straight into the 0.618 Fib at \$0.28336 — an 80% rally.
What followed was a healthy 33% correction, briefly pausing at the 0.5 Fib level (\$0.22135), which sits midway between the long-term 0.786 and 0.618 levels.
The dip stopped right at the 50MA, which once again acted as a springboard — sending price back above the 200MA, the BB center, and reclaiming the 0.5 Fib, which today is holding as support.
A golden cross is now imminent. The last time DOGE saw this setup was in early November 2024, which led to a 200% move.
In my opinion, today could offer a strong long opportunity — with a stop loss below the 0.5 Fib or even the 200MA, depending on your risk profile.
Always take profits and manage risk.
Interaction is welcome.

DOGE Breakout?After a 13 day rally and a 12 day pullback, could DOGE be breaking out and confirming a new 4H trading range?
After a bounce off the bullish orderblock DOGE has broken out of the diagonal downtrend, then pulled back to retest the previous diagonal resistance level as new support. This is a textbook breakout play & retest but this doesn't 100% guarantee the breakout will be successful. Should it be a successful breakout Local Resistance is the first clear level of interest for the bears to fight back.
This type of setup does give a clear invalidation should price fall back into the downtrend with acceptance. A fakeout could also lead to a loss of the Major Support level, that would introduce a potential revisit of $0.166.

#DOGE/USDT | Eyes Bounce from Key Support !#DOGE
The price is moving within an ascending channel on the 1-hour frame, adhering well to it, and is on its way to breaking strongly upwards and retesting it.
We have support from the lower boundary of the ascending channel, at 0.1930.
We have a downtrend on the RSI indicator that is about to be broken and retested, supporting the upside.
There is a major support area in green at 0.1895, which represents a strong basis for the upside.
Don't forget a simple thing: ease and capital.
When you reach the first target, save some money and then change your stop-loss order to an entry order.
For inquiries, please leave a comment.
We have a trend to hold above the 100 Moving Average.
Entry price: 0.2060.
First target: 0.2111.
Second target: 0.2183.
Third target: 0.2264.
Don't forget a simple thing: ease and capital.
When you reach the first target, save some money and then change your stop-loss order to an entry order.
For inquiries, please leave a comment.
Thank you.

Dogecoin Turns Bullish · Leveraged Trade · 3320% Potential @8XThe support zone is the 0.618 - 0.786 Fib. retracement levels marked blue and purple on the chart. We can clearly see two hammers (candlestick patterns), last week and this week. We can see the higher lows but also the broader rising channel structure. We can also see the even bigger structure coming from the low in 2024. In short, a long-term bullish cycle unfolding right in front of our eyes... Dogecoin is going up.
I am approaching this pair for my people with high leverage. High leverage means high risk. At the same time, we also have a very high potential for reward. The last target goes beyond 3,000%.
You don't have to go for all the targets nor all the lev. You can use lower leverage for less risk, more stability and peace of mind. You can do 2-3X and this would be a safe trade setup. You can do 4-5X for mild risk but still a strong potential for reward. And finally, you can do 6-8X as an expert knowing that you can get liquidated in a flash. All money can be gone. But, if my timing is right, you can end up with a position so strong that regardless of what happens after the breakout, sell early or late, you will be happy with the results.
It is always tricky, but we continue to learn and improve. Here we can see what is possible. Knowing what is possible, planning, preparing and taking action in the right way, we can achieve our goals and quit our day-job.
Trading is no different to any other profession/work, it takes time, practice, patience and dedication. The only difference is that here when you get it right you are rewarded for the long haul. Once you learn how to trade, that is, learn to play the market at its own rhythm, you can collect as much money as you want. It is true, but it takes years of hard work.
Here we have Dogecoin again. Will it grow? Will it crash?
Time will tell, but my money is on prices going up.
My money, my rep, my trust.
Let's see... Let's wait and see.
Not all trades are meant to be won.
If you follow capital allocation and a good strategy, you are able to take in the losses that are inevitable and still win big at the end of the game.
Remember, it is not about winning the all; it is about winning big, it is about winning over and over; it is about creating the habit of winning and this habit will make all the time and effort we invest in this venture worth it. It is not about being right, it is about getting paid.
With the right mindset and a little bit of patience... We can do this!
Namaste.

DOGE/USDT | Eyes Bounce from Key Support – Next Targets Ahead!By analyzing the Dogecoin chart on the daily timeframe, we can see that after reaching the $0.29 area, the price entered a correction and is now trading around $0.22. If DOGE dips into the key support zone between $0.19–$0.21, we could expect a strong bullish reaction. The next potential targets are $0.287, $0.32, $0.41, and $0.70.
Please support me with your likes and comments to motivate me to share more analysis with you and share your opinion about the possible trend of this chart with me !
Best Regards , Arman Shaban

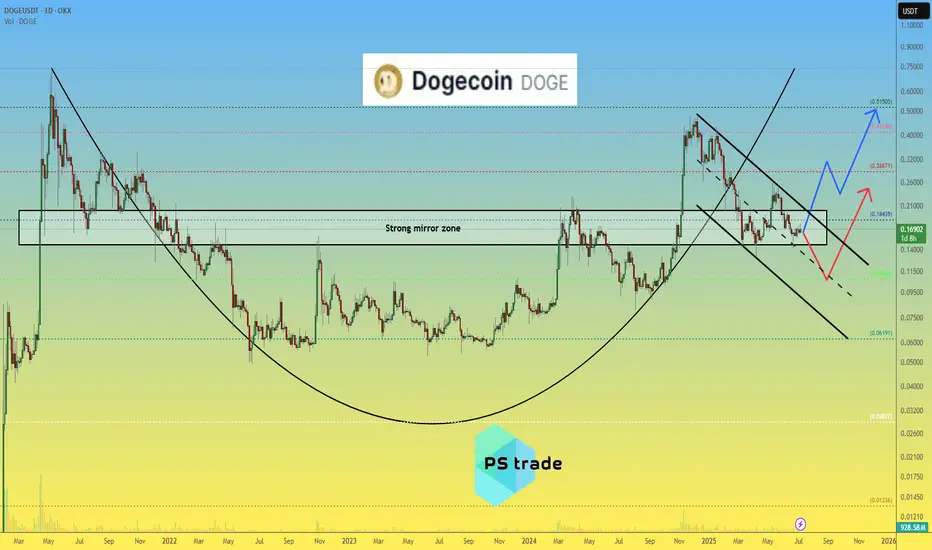
Dogecoin DOGE price analysisCRYPTOCAP:DOGE price is now in the middle of a strong mirror zone of $0.15-0.20
📈 It looks like the position is now accumulating, forming a "double bottom" and then, only a way for growth, to the highs in the region of $0.45-0.50
🐻 On the other hand, the scenario of another "leg" down fits perfectly into the TA canons. That is, it is very likely that if the price of OKX:DOGEUSDT drops below $0.15, then it is already fall to $0.10)
P.S.:
#Doge is an interesting asset, it is worth watching with one eye, and with the other eye, watch how the "battle" between Trump and Musk (who is the main influencer and "pumper" of #Dogecoin) will end.
💡 And then put the two pieces of information together and make a trading decision - "easy money" !)
_____________________
Did you like our analysis? Leave a comment, like, and follow to get more
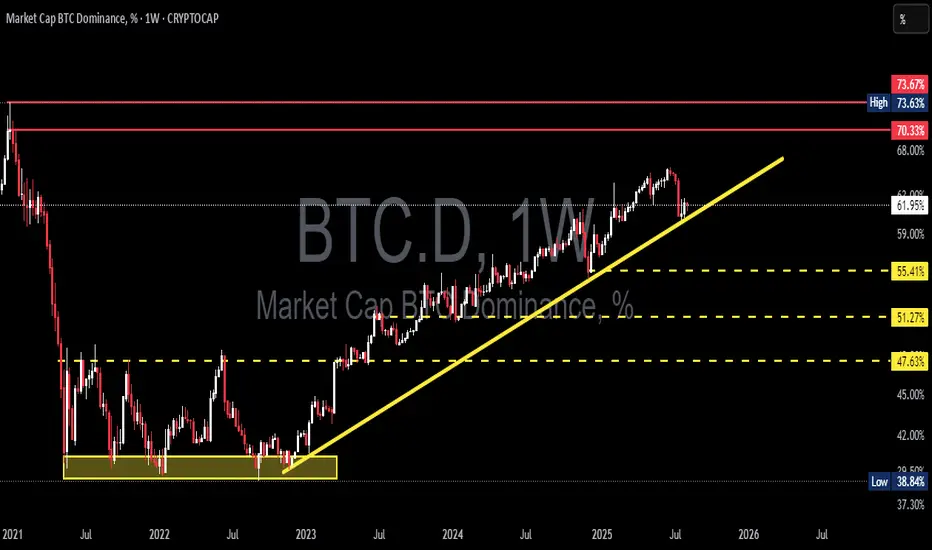
BTC Dominance at a Critical Point – Is Altseason About to Begin?🔍 Technical Breakdown (BTC.D Weekly Chart)
The weekly BTC Dominance chart shows Bitcoin's dominance is now testing a critical ascending trendline, which has supported its bullish momentum since early 2023.
After hitting a major resistance zone between 70.33% – 73.67%, BTC.D faced a sharp rejection — signaling a potential capital rotation from BTC into altcoins, which is often the first clue of an incoming Altseason.
---
🧩 Structure & Pattern Highlights:
✅ Rising Trendline Support:
A strong uptrend structure has been in place since the 2022 bottom (~39%), marked by consistent higher highs and higher lows.
⚠️ Minor Double Top near 70.33% – 73.67%:
This classic reversal pattern at a macro resistance zone hints at possible exhaustion in BTC dominance.
🟡 Historical Accumulation Zones:
Key horizontal levels at 55.41%, 51.27%, and 47.63% have acted as major decision zones in the past and will serve as critical support if the trend breaks.
---
🟢 Bullish Scenario (BTC Dominance Rises):
If BTC.D can:
Successfully hold above the ascending trendline
Print a strong weekly bullish reversal
➡ Then a move back up to retest 70.33% is likely.
A confirmed breakout above 73.67% would suggest BTC dominance could surge further.
📌 What it means? Altcoins would likely underperform, as BTC reclaims market control — usually a risk-off signal for crypto.
---
🔴 Bearish Scenario (BTC Dominance Falls):
If BTC.D:
Breaks below the ascending trendline
Fails to hold the 61.91% support zone
➡ This could signal a significant capital outflow from BTC to altcoins — an early indicator of Altseason.
Bearish targets below:
55.41% – First support area.
51.27% – Key psychological and technical level.
47.63% – A drop to this level would be a strong confirmation that Altseason is in full effect.
📌 In this case, we’d expect strong moves across sectors like AI tokens, DeFi, L1s, and mid/low cap altcoins.
---
📊 Key Confirmations to Watch:
1. Weekly candle reaction to the trendline
2. Volume – strong selling on breakdown confirms trend shift
3. ETH.D and TOTAL2 (Altcoin Market Cap) – if rising while BTC.D falls, it's strong evidence for Altseason
---
🚨 Final Takeaway:
BTC Dominance is now at a make-or-break level that could define the direction of the broader crypto market for the next several months.
A breakdown = risk-on environment, favoring altcoins.
A bounce = BTC continues to dominate while altcoins stall.
Either way, the next big move is coming — this is the moment serious traders and investors have been waiting for.
#BTCdominance #AltseasonAlert #BitcoinVsAltcoins #CryptoRotation #CryptoBreakout #AltcoinSeason #CryptoMarketAnalysis #BTC.D #CryptoTrend #SmartMoneyMoves #CryptoTA #TradingViewAnalysis
Dogecoin - It is all totally expected!🐶Dogecoin ( CRYPTO:DOGEUSD ) will break out soon:
🔎Analysis summary:
Just this month, Dogecoin perfectly retested a significant confluence of support and is starting the expected rejection. With bullish momentum picking up, there is a very high chance that Dogecoin will break the all time high in the near future.
📝Levels to watch:
$0.5
🙏🏻#LONGTERMVISION
SwingTraderPhil

DOGEUSDT heading towards 0.24 zone#DOGE #DOGEUSD #DOGEUSDT CRYPTOCAP:DOGE
This is where DOGEUSDT will bounce.
The price has tapped into the daily support DS1.
We see the reaction that there. However, the price may go deep into this support but not necessarily.
This condition presents a long opportunity on DOGEUSDT.
The price will bounce from DS1 and try another attempt at weekly resistance WR1.
The price may also struggle between 0.23 and 0.24 zone.
This may be an opportunity to load long term spot position since the price action is looking bullish for some upcoming months.
What do you think? Where do you see DOGEUSDT bounce and in upcoming month? Let me know in the comments.

Dogecoin Bullish · $0.70 & 240% Profits PotentialThis is a great chart setup and I can even say it looks better than Cardano, but why? Because prices are lower, therefore there is more room available for growth. So it really depends on how you look at it.
Seeing Dogecoin producing a rising channel is good, but knowing that prices are still really low compared to the last high (December 2024) and also compared to the all-time high tells us that there is still plenty of room available for growth and it is early. The rising channel after the correction ended reveals that the market—traders, holders, investors, etc.—are buying and accumulating for what comes next. Can be anything, but everybody is already buying...
The current higher low support was found right in-between 0.618 and 0.786 Fib. retracement levels. Here marked with blue dotted and purple dotted lines.
We could say that it is possible to see two to three days green followed by another low, a lower low, and this is definitely possible but there is no bearish momentum, no sell side force. And thus we can conclude on an early end for this retrace. Another reason is the fact that the rise is more steep now compared to April, so the retrace should also be more steep and have a shorter lifespan. Agree, agree, agreed.
Dogecoin produced a perfect channel with higher highs and higher lows, the next move is a major jump with resistance at $0.70 and total growth potential reaching 240%. We can continue with this pattern and track the market long-term. It is what I do; it is what we have been doing for countless years now... And we are only getting started.
The best is yet to come.
Thank you for reading.
Namaste.

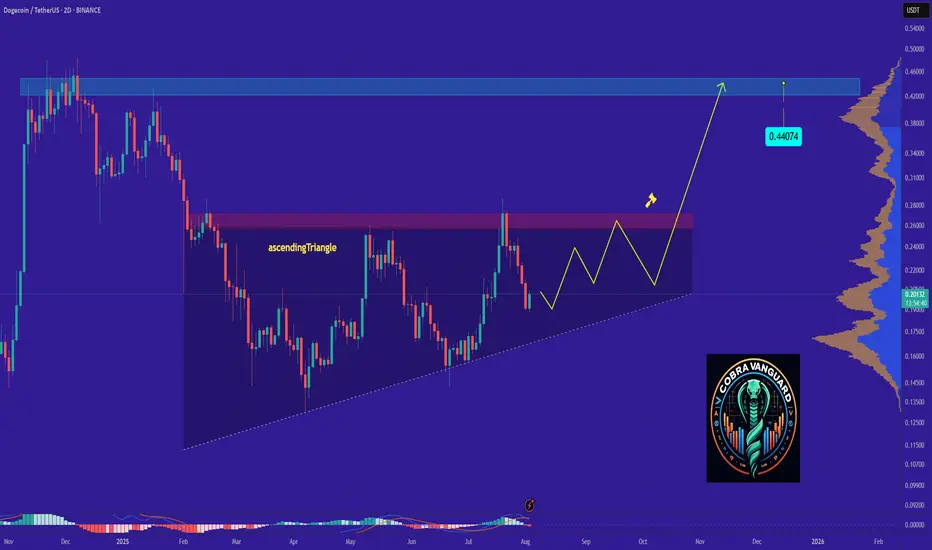
DOGE's Situation, A Comprehensive Analysis !!!The price on the 2d timeframe is within an ascending triangle, which can be promising. If the price breaks this pattern with bullish candles, it could easily rise by the distance of AB=CD .
Best regards CobraVanguard.💚
An Example of Trading a Coin (Token) You're Hesitant to Trade
Hello, fellow traders!
By "Following," you'll always get the latest information quickly. Have a great day today.
-------------------------------------
There are coins (tokens) that are showing positive trends, but are reluctant to trade.
BNB and TRX are two such coins.
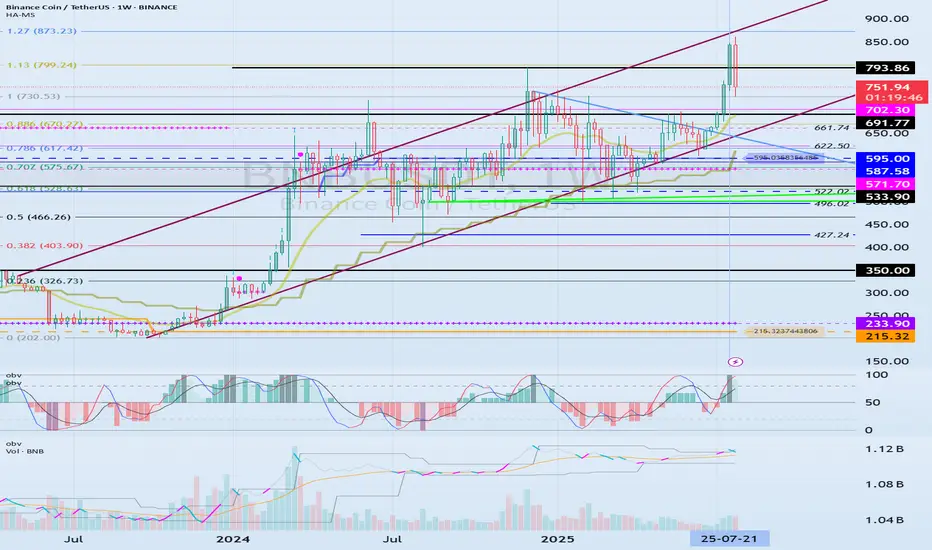
(BNBUSDT 1W chart)
(TRXUSDT 1W chart)
What these two coins have in common is that their representatives are Chinese.
These two coins are consistently making efforts to expand globally.
BNB is ranked first among exchange-traded coins, while TRX is steadily making efforts to expand into the US market to expand globally.
Despite this, some are reluctant to trade due to concerns about being an exchange-traded coin and being a Chinese coin.
To mitigate this risk, it's best to increase the number of coins (tokens) that ultimately generate profits.
In other words, by selling the amount of the original purchase price, you retain the number of coins (tokens) that represent profit.
This way, even if the price plummets, you'll always be in profit, allowing you to seize new opportunities.
For coins (tokens) that demonstrate long-term growth potential, increasing the number of coins (tokens) that represent profit is recommended. While these coins (tokens) appear to have potential for long-term growth, they currently carry some risk.
This also applies to coins that are considered worth holding for the long term, such as BTC and ETH.
Therefore, coins (tokens) that have a large user base and are considered to have future value, such as XRP, ADA, SOL, and DOGE, still carry some risk.
-
Thank you for reading to the end.
I wish you a successful trading experience.
--------------------------------------------------
Bitcoin Dominance & The Fall of AltcoinsBitcoin has sold off sharply in recent session.
Allowing alt coins to capture small percentages of bitcoins liquidity which resulted in epic bullish moves.
Now that Bitcoin is retesting a major moving average (50 MA) we might see BTC recapture some of that crypto dominance.
Other alt coins are well off of their 50 day moving average making them a riskier buy.
When BTC dominance starts to take leadership we often see alt coins and the total market cap sell off.
Bitcoin dominance is hitting a multi year trendline and looks poised to capture some of the alt liquidity.
We still think BTC can sell off and go lower, but on a relative basis it should hold up better than other alt coins & Ethereum.
There are some key nuances that are building and shaping up for a very similar topping formation that occurred in 2021.

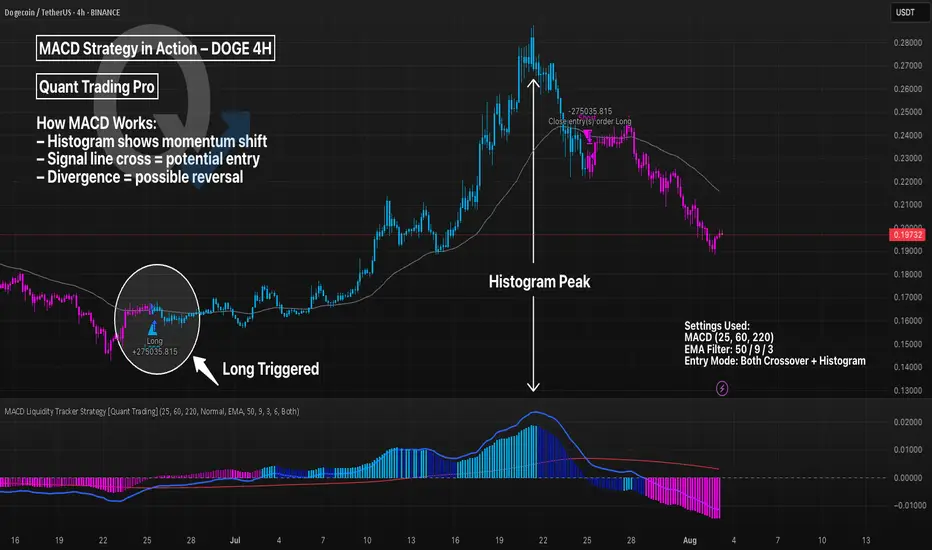
MACD Liquidity Strategy in Action – DOGE 4HThe MACD (Moving Average Convergence Divergence) is a trend-following momentum indicator. It uses two EMAs to generate signals via crossovers and histogram shifts.
This chart shows DOGE 4H with a long-only MACD Liquidity Tracker Strategy, using:
Fast EMA: 25
Slow EMA: 60
Signal Line: 220
These longer settings reduce noise and provide higher-conviction swing entries, though at the cost of late signals.
💡 Tweak Tip:
Lower values (e.g. 12/26/9) = more signals, better for scalping
Higher values (e.g. 25/60/220) = fewer signals, better trend filtering
Adjust the EMA filter (50/9/3 here) to match asset volatility
📊 Use MACD for:
Trend continuation confirmation
Exit timing via histogram fading
Divergence spotting (momentum vs price)
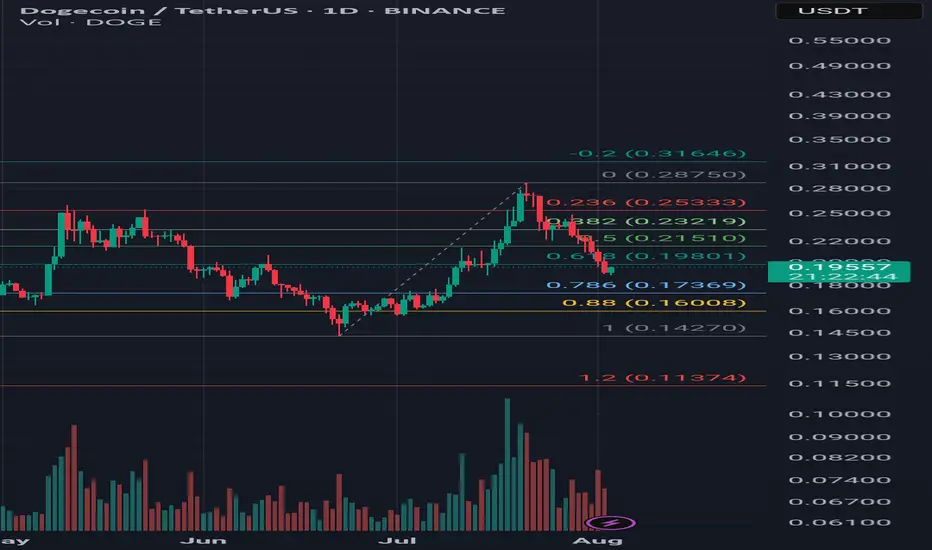
DOGE/USDT Trade Idea – Potential Cup & Handle Pattern Timeframe: Technical Analysis:
Price rallied from 0.142 to 0.287 and is currently forming the handle of a potential cup & handle pattern.
Price is sitting at the key 0.618 Fibonacci retracement level (0.198 USDT).
If this support holds and price breaks above resistance levels with strong volume, the cup & handle pattern may activate.
---
🎯 Targets:
1. First resistance: 0.215 USDT (50% Fib)
2. Second resistance: 0.232 USDT (38% Fib)
3. Key breakout level: 0.287 USDT
4. Classic pattern target: 0.432 USDT
---
🛡 Stop Loss:
Below 0.170 USDT (slightly under the 0.786 Fib & handle bottom)
---
✅ Entry Confirmation Criteria:
1. Hold above 0.198 support
2. Break and close above 0.215
3. Breakout above 0.287 with strong volume
---
💡 This analysis is for educational purposes only and is not financial advice. Always use proper risk management.
Why DOGE Remains Bullish and Its Next Potential Move !It appears that the price is forming a cup and handle pattern, and if this occurs, it could push the price above $0.30.
Best regards CobraVanguard.💚
Bears Target $0.14 DOGE — Is the Trend Your Friend?DOGEUSDT has been in a clear downtrend since late July, printing consistent lower highs and lower lows. The current market structure shows sellers firmly in control, with every bullish bounce quickly fading. The recent rejection near $0.2244 and the inability to sustain above the $0.21 zone highlight persistent selling pressure.
At the moment, DOGE is hovering around $0.2043, just under a short-term resistance band between $0.2067 and $0.2090. This area has acted as a rejection point in the last few sessions, suggesting that unless bulls can break above it with strong volume, the path of least resistance remains downward. Below, the first major support sits at $0.1855. If that breaks, the selling could accelerate toward $0.1680, a level that aligns with a previous consolidation base from June. In an extended decline, $0.1427 comes into view as a long-term support level that previously acted as a strong demand zone.
The chart also shows an active short trade setup in play:
• Entry: $0.2043
• Stop-Loss: $0.2244
• Targets: TP1 at $0.1855, TP2 at $0.1680, and TP3 at $0.1427
From a risk-reward perspective, this setup remains attractive, especially if the price breaks below $0.1855. However, traders should watch for any bullish invalidation signs — a close above $0.2136 could challenge the short bias, while a sustained break above $0.2244 would signal a possible trend shift. Until then, the broader technical picture still favors the bears.

DOGE (Y25.P3.E1). More lows to come before a longHi traders,
My thoughts on taking a short trade on Doge
why?
confluence on … 200 D ema, Avwap , previous support, etc
All the best,
S.SAri.

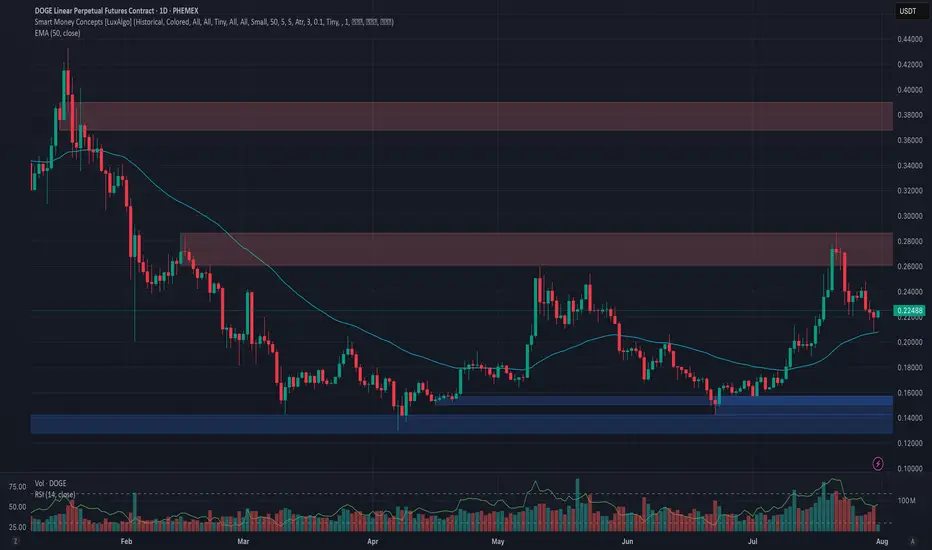
Phemex Analysis #101: Is Dogecoin (DOGE) Ready to Moon Again?Dogecoin ( PHEMEX:DOGEUSDT.P ), the original meme cryptocurrency, is once again capturing investor attention, fueled by impressive bullish movements. Currently trading around $0.2245, DOGE surged approximately 70% in July, decisively breaking the key resistance at $0.22 and challenging the next resistance level near $0.28.
With whale accumulation intensifying, renewed retail investor enthusiasm, and heightened speculation surrounding possible ETF approvals, Dogecoin appears poised to potentially sustain or even amplify its recent gains. But the key question remains: is DOGE truly ready to moon again, or is caution necessary following such rapid price movement?
Let’s carefully explore a few potential scenarios to inform your trading strategies:
Possible Scenarios
1. Bullish Continuation—Targeting Higher Levels
After successfully breaking above the crucial $0.22 resistance, Dogecoin could maintain its upward momentum if buying pressure remains strong. In this bullish scenario, DOGE might swiftly retest the immediate resistance at $0.25, then target higher levels near $0.28, and potentially surge toward the significant resistance at $0.39.
Pro Tips:
Entry Signals: Watch for a confirmed breakout above $0.25, especially if accompanied by rising trading volume, as a potential bullish entry point.
Profit-Taking: Strategically secure partial profits at resistance zones around $0.28 and $0.39.
Risk Management: Implement tight stop-loss orders just below the key support at $0.20 to guard against unexpected reversals.
2. Retest and Accumulation—Neutral Scenario
Given DOGE’s rapid price rise, a short-term pullback towards previous resistance-turned-support at $0.22 or even $0.20 is plausible. Such retracements, particularly on decreasing volume, might signal healthy consolidation, setting the stage for future bullish momentum.
Pro Tips:
Buying Opportunities: Look to accumulate DOGE if a low-volume pullback occurs toward support zones around $0.22 or $0.20.
Monitor Volume: Observe closely for decreasing trading volume during retracements, which typically indicates positive consolidation rather than a bearish reversal.
3. Bearish Scenario—Deeper Correction Possible
Should overall market sentiment shift negatively or DOGE fail to hold crucial support at $0.22, bearish pressure could escalate, potentially pushing Dogecoin down to deeper support levels around $0.198, and possibly as low as $0.15 or $0.13.
Pro Tips:
Risk Management: Consider reducing or exiting positions if DOGE decisively breaks below $0.22 on increased selling volume.
Long-Term Accumulation: Long-term holders may strategically accumulate DOGE at historically strong support levels ($0.15 or $0.13) once price stabilization occurs.
Conclusion
Dogecoin (DOGE) stands at a pivotal point, balancing bullish enthusiasm against the possibility of a correction. Traders should carefully monitor resistance at $0.25, the critical support at $0.22, and closely observe volume dynamics. By strategically aligning their trades with these outlined scenarios and employing disciplined risk management, traders can confidently navigate DOGE’s volatility and potentially capitalize on its next significant move.
🔥 Tips:
Armed Your Trading Arsenal with advanced tools like multiple watchlists, basket orders, and real-time strategy adjustments at Phemex. Our USDT-based scaled orders give you precise control over your risk, while iceberg orders provide stealthy execution.
Disclaimer: This is NOT financial or investment advice. Please conduct your own research (DYOR). Phemex is not responsible, directly or indirectly, for any damage or loss incurred or claimed to be caused by or in association with the use of or reliance on any content, goods, or services mentioned in this article.
DOGE 4H – Strong Support Test Before Alt-Season??DOGE is approaching a pivotal support zone on the 4H chart — the same area that acted as the breakout base in mid-July before price surged nearly 40% higher. This horizontal level is now being tested again, offering a potential opportunity for trend continuation if bulls can defend it.
The support zone also aligns with an ascending trendline that has been respected for nearly a month, creating a key confluence point. Combined with an oversold Stochastic RSI reading, the setup is beginning to show early signs of a potential reversal — but confirmation is still needed.
Price structure remains technically bullish unless this area breaks. A clean bounce here could trigger a new wave toward the prior high at $0.29. On the flip side, a breakdown of this confluence zone would invalidate the current trend structure and likely target the $0.19–0.20 region.
📊 What I’m Watching For:
– Bullish price action (e.g., hammer candle, engulfing) off this zone
– Higher low confirmation with volume
– Trendline retest and hold
– Momentum alignment with RSI/Stoch flip
DOGE remains one of the more technically clean charts among majors — but holding here is key. Watching closely.

TradeCityPro | DOGE Faces Resistance with Altseason Tailwinds👋 Welcome to TradeCity Pro!
In this analysis, I want to review the DOGE coin for you. One of the first and most popular shitcoins in crypto, which managed to attract a very strong market cap during the previous bull run due to the hype around Elon Musk.
🔍 Currently, this coin has a market cap of $34.06 billion and ranks 8th on CoinMarketCap.
📅 Daily Timeframe
In the daily timeframe, this coin has created a very strong support level at 0.15190, and now after a bullish leg, it has formed a top at 0.27359.
📊 The buying volume increased nicely during this bullish leg, and the price moved up to the 0.27359 resistance.
✔️ Now, after the first touch, the price has started a slight correction and is moving downward. If further touches occur, we can open a long position after breaking the top.
📈 Breaking 0.27359 could be one of those positions that stays open all the way up to 0.46496, and we can buy this coin in spot using the profit from that trade. I will try to have a position open after breaking 0.27359, aiming for 0.46496.
💥 The next trigger we have is the break of 0.31222, but the price should first form some structure after reaching that area, and only after confirmation should we open a position. Just entering based on that break doesn’t seem logical to me.
🔽 If a correction and drop happen, as long as the price stays above 0.15190, there’s no problem for the trend to continue. But if the price stabilizes below that level, a trend reversal might occur.
📝 Final Thoughts
This analysis reflects our opinions and is not financial advice.
Share your thoughts in the comments, and don’t forget to share this analysis with your friends! ❤️
