Dogeusdt
#DOGEUSDT
The entire crypto market is currently experiencing a downturn. It's crucial to wait for confirmation before making any major decisions. Once the trend stabilizes, we can look for potential opportunities to ride the wave with DOGE.
🔹 Key Levels to Watch:
Monitor support and resistance zones for possible reversals.
Look for volume spikes and market sentiment shifts before entering new trades.
🚨 Reminder: Do NOT close any positions yet. Stay patient, manage risk, and wait for a clear breakout signal. The market can shift quickly, so be ready! 🚀🐶
DOGE-1

Blueprint for Becoming a Successful Trader in 2025 Using AlgoBot **Blueprint for Becoming a Successful Trader in 2025 Using Algo Trading and Trading Bots**
Algorithmic trading (algo trading) and trading bots are becoming increasingly dominant in financial markets, including stocks, crypto, and forex. To succeed as an algo trader in 2025, you need a well-structured plan covering **strategy development, risk management, automation, backtesting, and market adaptation**. Here’s a step-by-step blueprint:
## **1. Understand the Basics of Algo Trading**
Before diving into automated trading, ensure you understand key concepts:
✅ **Market Microstructure** – Learn how markets function, order types, liquidity, slippage, and execution speeds.
✅ **Trading Strategies** – Get familiar with high-frequency trading (HFT), mean reversion, momentum, arbitrage, and market-making.
✅ **Programming & APIs** – Master Python, JavaScript, or C++ for coding bots and integrating them with exchanges.
✅ **Backtesting & Optimization** – Learn how to test and refine strategies using historical data.
### **Key Tools & Resources:**
- **Languages:** Python (Pandas, NumPy, Scikit-learn), C++, JavaScript
- **Libraries:** Backtrader, Zipline, QuantConnect, TensorFlow (for AI-based models)
- **Market APIs:** Binance API (crypto), Alpaca API (stocks), MetaTrader (forex)
## **2. Choose a Trading Market & Strategy**
Your strategy will depend on the asset class and market structure.
### **Popular Markets for Algo Trading in 2025:**
📈 **Cryptocurrency (Solana, Ethereum, Bitcoin, meme coins)** – High volatility, DeFi opportunities, 24/7 trading.
📊 **Stocks (Nasdaq, NYSE, Penny Stocks)** – Institutional competition, algo arbitrage, trend following.
💱 **Forex (EUR/USD, GBP/JPY, AUD/CAD)** – Global liquidity, macroeconomic-driven trends, HFT-friendly.
### **Types of Algo Trading Strategies:**
1. **Market Making** – Providing liquidity by placing buy/sell orders.
2. **Trend Following** – Using moving averages, RSI, and MACD to follow price momentum.
3. **Mean Reversion** – Buying oversold assets and selling overbought assets.
4. **Statistical Arbitrage** – Exploiting price inefficiencies using mathematical models.
5. **AI-Driven Bots** – Machine learning models predicting price action based on data patterns.
6. **High-Frequency Trading (HFT)** – Ultra-fast trading strategies requiring low-latency execution.
### **Key Trading Platforms & Tools:**
🔹 **Crypto:** 3Commas, Pionex, HaasOnline, KuCoin bots
🔹 **Stocks & Forex:** MetaTrader, NinjaTrader, TradingView Pine Script
🔹 **AI & Data Analysis:** QuantConnect, Zipline, TensorFlow, GPT-based bots
## **3. Build & Automate Your Trading Bot**
### **Steps to Create an Algorithmic Trading Bot:**
1. **Define the Strategy** – Choose a trading approach (trend following, arbitrage, etc.).
2. **Code the Bot** – Write scripts in Python, JavaScript, or C++ to execute trades via exchange APIs.
3. **Backtest on Historical Data** – Use past market data to see if your bot would have been profitable.
4. **Simulate in a Paper Trading Environment** – Run the bot in a risk-free simulated market.
5. **Deploy on Live Market** – Use a small amount of capital to test real-world performance.
### **Key Factors for a Good Algo Trading Bot:**
✅ **Latency Optimization** – Reduce execution delays for better entry/exit timing.
✅ **Error Handling** – Implement stop-loss, failsafe mechanisms to prevent large losses.
✅ **AI & Machine Learning** – Use AI to analyze market sentiment, detect patterns, and adapt to new conditions.
✅ **Auto-Tuning Parameters** – Use reinforcement learning or Bayesian optimization for continuous improvement.
## **4. Risk Management & Capital Preservation**
Even the best trading bot can fail if risk management isn’t in place.
### **Risk Control Techniques:**
🚨 **Position Sizing** – Never risk more than 1-2% of your capital per trade.
🔻 **Stop-Loss & Take-Profit** – Set predefined exit points to limit losses and lock in profits.
📊 **Diversification** – Run multiple bots with different strategies across various markets.
⚖️ **Leverage Management** – Avoid excessive leverage that can wipe out your account in high volatility.
## **5. Optimize, Scale & Stay Ahead of the Market**
The best algo traders **adapt** to market conditions and continuously improve their strategies.
### **Scaling Your Trading Operations:**
✅ **Optimize Execution** – Use low-latency execution via co-location services.
✅ **AI-Enhanced Strategies** – Incorporate machine learning for adaptive decision-making.
✅ **Multi-Bot Portfolio** – Run multiple bots across different strategies & timeframes.
✅ **Real-Time Monitoring** – Use dashboards for tracking performance and debugging.
### **Emerging Trends for 2025:**
🚀 **AI-Powered Trading** – GPT-based trading models analyzing market sentiment.
📡 **Decentralized Trading Bots** – Running bots on blockchain-based smart contracts.
🌍 **Multi-Asset Trading** – Crypto, stocks, forex, and commodities in one unified algo framework.
🔗 **DeFi Trading & Arbitrage** – Bots leveraging DEX liquidity pools & yield farming.
## **Final Blueprint for Success in 2025**
📌 **Master Algo Trading Basics** – Learn coding, market mechanics, and execution methods.
📌 **Choose a Profitable Market & Strategy** – Focus on AI-driven bots, arbitrage, or market making.
📌 **Develop & Automate Bots** – Use Python, API integrations, and machine learning models.
📌 **Implement Risk Management** – Use stop-loss, proper position sizing, and capital allocation.
📌 **Optimize & Adapt** – Constantly improve execution speed, data analysis, and bot strategies.
📌 **Stay Ahead with AI & DeFi** – Leverage blockchain innovations and AI-powered trade predictions.
By following this blueprint and continuously refining your strategies, you can **maximize profits, reduce risks, and stay competitive in 2025’s algo trading landscape**. 🚀📈

#DOGE/USDT#DOGE
The price is moving in a descending channel on the 1-hour frame and is expected to continue upwards
We have a trend to stabilize above the moving average 100 again
We have a descending trend on the RSI indicator that supports the rise by breaking it upwards
We have a support area at the lower limit of the channel at a price of 0.3200
Entry price 0.3360
First target 0.3445
Second target 0.3565
Third target 0.3700

DOGE/USDT 1H: Bears in Control – Targeting $0.31500 Next! DOGE/USDT 1H Chart Analysis
🚀 Follow me on TradingView if you respect our charts 📈Daily new charts!
Current Market Condition:
Bearish consolidation at $0.33146 with strong resistance at $0.34000 (Premium Zone).
RSI: Bearish divergence at 49.69, indicating continued downside pressure.
Key Levels:
Resistance Zone: $0.34000 - $0.34500.
Support Levels:
T1: $0.32500 (Equilibrium Zone).
T2: $0.31500 (Discount Zone).
Stop Loss: Above $0.34500 for short positions.
Trade Setup (Confidence 8/10):
Entry: Short at current price ($0.33146).
Targets:
T1: $0.32500.
T2: $0.31500.
Stop Loss: $0.34500 (above key resistance).
Risk Score: 7/10 (moderate risk, but strong setup).
Market Maker Intent:
Distribution Phase: Visible at premium zone ($0.34000-$0.34500).
Bearish Confirmation: Watch for breakdown below $0.32500 to confirm further downside.
Recommendation:
Short positions favorable at current price ($0.33146).
Wait for breakdown confirmation below $0.32500 before adding shorts.
Maintain tight stops above $0.34500.
Confidence Level: 8/10 for bearish continuation.
🚀 Follow me on TradingView if you respect our charts 📈Daily new charts!

DOGE Pump is comingDon't be surprised if you will see Dogecoin in Hot pairs in some hours/days. The chart is showing us a nice chart with a strong accumulation zone around $0.30. Actually is breaking up from resistance zone, i expect a quick pump till $0.37

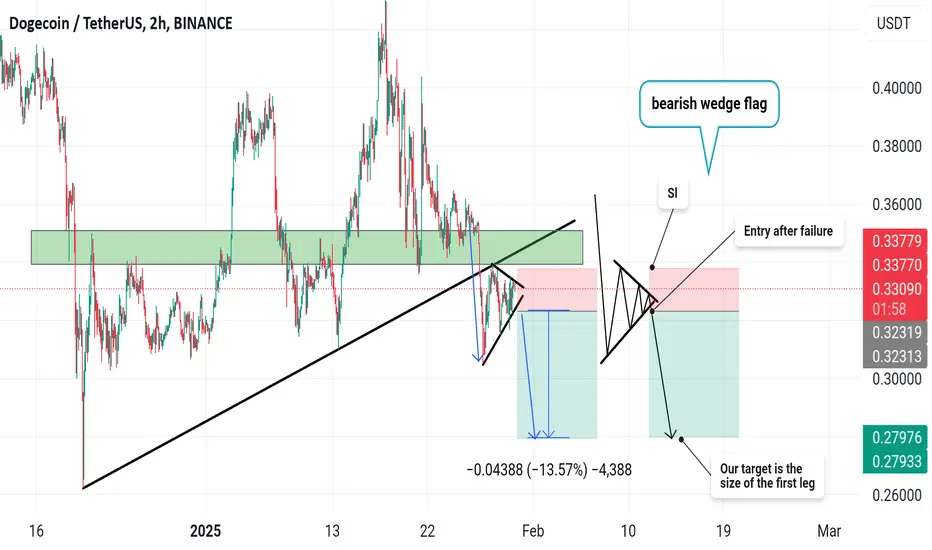
Doge is time to short again Dogecoin made a downward price action pattern in the time frame of two hours and one hour. If it is confirmed, you can enter this transaction after the failure.
For this transaction, Lorge (5/7) is not recommended.
Like and subscribe
DOGE - DOGS vs BEARSHello TradingView Family / Fellow Traders. This is Richard, also known as theSignalyst.
📈 DOGE has been in a correction phase trading within the falling wedge pattern marked in orange.
🏹For the DOGS (bulls) to take over, and start the next impulse movement towards the upper bound of the blue wedge, a break above the last high marked in orange is needed.
For now, we wait! ⏱️
📚 Always follow your trading plan regarding entry, risk management, and trade management.
Good luck!
All Strategies Are Good; If Managed Properly!
~Rich
Dogecoin at Key Support: Trend Analysis & Next Moves for DOGE👀 👉 In this video, we dive deep into Dogecoin (DOGE) paired with USDT, examining its trend, market structure, price action, key support and resistance levels, and the impact of liquidity on the markets. At the moment, DOGE is trading near a critical support level. With the bearish break in market structure, we explore potential ways to engage if the downtrend persists. Everything is covered in detail here. Please note, this is not financial advice.

DOGE is ready to shortDoge | 2H
Dogecoin has also broken the upward trend line and is pulling back against it
On the other hand, it has broken a static support and now that it is below it, it will probably fall again

bitcoin market oulook still stuck in range buy low sell high🔸Hello traders, today let's review 4hour price chart for BTCUSD . we are still
stuck in range since december, range highs at/near 108k, range lows at 90k.
🔸4 hour sell side liquidity defined by OB at 108k, currently trading at 102k,
limited upside going forward expecting pullback to re-test range lows and trigger
fresh buying / fresh OB liquidity near 90k.
🔸Recommended strategy: BUY LOW near liquidity OBs 90k usd, TP bulls is fresh overhead liquidity at/near 108/110K. expecting decent bounce in this market after pullback.
🎁Please hit the like button and
🎁Leave a comment to support our team!
RISK DISCLAIMER:
Trading Futures , Forex, CFDs and Stocks involves a risk of loss.
Please consider carefully if such trading is appropriate for you.
Past performance is not indicative of future results.
Always limit your leverage and use tight stop loss.

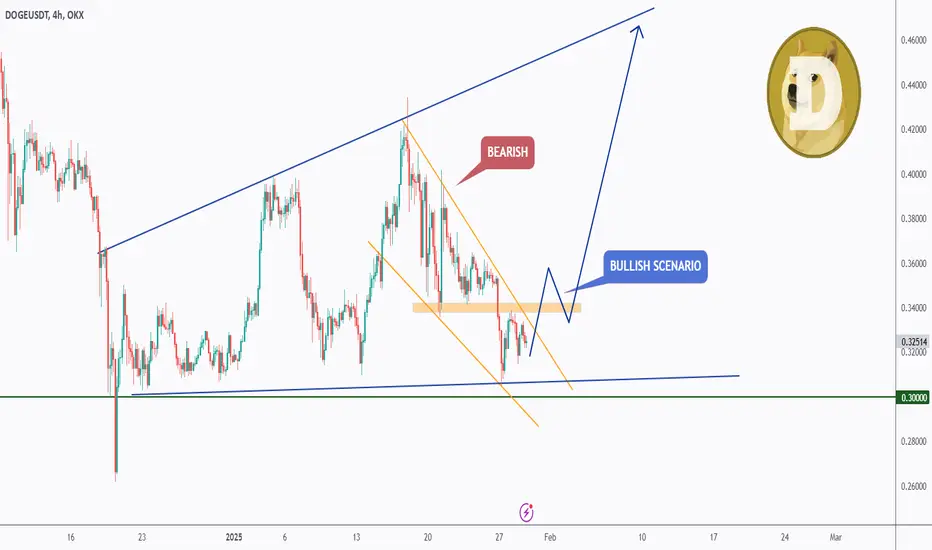
Be careful with dogecoin !!!You might wonder why altcoins haven't experienced significant growth compared to Bitcoin. The answer lies in meme coins, as they have caused substantial harm to the market. How many cryptocurrencies do we really need? So, focus on the primary cryptocurrencies in this market. In my opinion, everything is beautiful for the first time, so only pay attention to Dogecoin among the meme coins.
Can we be optimistic that this will come true? If it follows the triangle pattern, the price will rise by $0.50 .
Give me some energy !!
✨We spend hours finding potential opportunities and writing useful ideas, we would be happy if you support us.
Best regards CobraVanguard.💚
_ _ _ _ __ _ _ _ _ _ _ _ _ _ _ _ _ _ _ _ _ _ _ _ _ _ _ _ _ _ _ _
✅Thank you, and for more ideas, hit ❤️Like❤️ and 🌟Follow🌟!
⚠️Things can change...
The markets are always changing and even with all these signals, the market changes tend to be strong and fast!!

Important Support and Resistance Zone: 0.31600-0.33591
Hello, traders.
If you "Follow", you can always get new information quickly.
Please click "Boost".
Have a nice day today.
-------------------------------------
In order to reduce the auxiliary indicators to one, StochRSI indicator has been added to BW v3.0 indicator.
--------------------------
The 0.31600-0.33591 zone is an important support and resistance zone.
It is becoming more important because the M-Signal indicator on the 1W chart is rising nearby.
In order to turn into a short-term uptrend, the MS-Signal (M-Signal on the 1D chart) indicator must rise above and maintain the price.
Therefore, support around 0.37778 is important.
-
Since the StochRSI indicator is showing a change in slope in the oversold zone, if it shows support around 0.31600-0.33591, it is a time to buy.
If it rises,
1st: 0.37778-0.39641
2nd: 0.42847
You should consider whether to respond depending on whether there is support around the 1st and 2nd above.
If it is supported around 0.42847 and rises, it is expected to start rising to the Fibonacci ratio point of 2.618 (0.61238).
-
For this movement to actually occur, USDT and USDC must maintain a gap uptrend.
In addition, BTC dominance or USDT dominance must show a downtrend.
-----------------------------
The most important element in creating a trading strategy is the support and resistance points drawn on the 1M, 1W, and 1D charts.
To do this, you need to understand the arrangement of candles.
When studying charts, it is important to read them repeatedly.
Since we are not studying to become chart analysts, we do not need to memorize various names or patterns.
It is more important to understand what kind of flow is being talked about.
-
The next important thing is the price moving average line.
When studying charts, you will realize that the most important thing in a chart is the average value.
Therefore, you will realize that all indicators express how to return to the average value.
Therefore, it is more important to understand how to interpret the price moving average line than to study complex indicators.
Goodbye, complex indicators!!!
-
If you look at the chart in that sense, you will understand why.
1. M-Signal indicator (MS-Signal indicator) on 1M, 1W, 1D charts indicating trends
2. HA-Low, HA-High indicators for creating trading strategies
3. BW(0), BW(100) indicators for detailed responses
I drew horizontal lines on 1M, 1W, 1D charts to indicate support and resistance points.
The remaining indicators are created for chart analysis, so they are not actually necessary when conducting trading.
You can draw Fibonacci ratios and use them as support and resistance points, but you should not forget that Fibonacci ratios are drawn for chart analysis.
Do not use Fibonacci ratios for the purpose of conducting trading.
-
Thank you for reading to the end.
I wish you successful trading.
--------------------------------------------------
- Big picture
I used TradingView's INDEX chart to check the entire range of BTC.
(BTCUSD 12M chart)
Looking at the big picture, it seems to have been following a pattern since 2015.
In other words, it is a pattern that maintains a 3-year bull market and faces a 1-year bear market.
Accordingly, the bull market is expected to continue until 2025.
-
(LOG chart)
Looking at the LOG chart, we can see that the increase is decreasing.
Accordingly, the 46K-48K range is expected to be a very important support and resistance range from a long-term perspective.
Therefore, we do not expect to see prices below 44K-48K in the future.
-
The Fibonacci ratio on the left is the Fibonacci ratio of the uptrend that started in 2015.
That is, the Fibonacci ratio of the first wave of the uptrend.
The Fibonacci ratio on the right is the Fibonacci ratio of the uptrend that started in 2019.
Therefore, this Fibonacci ratio is expected to be used until 2026.
-
No matter what anyone says, the chart has already been created and is already moving.
It is up to you how to view and respond to it.
Since there is no support or resistance point when the ATH is updated, the Fibonacci ratio can be appropriately utilized.
However, although the Fibonacci ratio is useful for chart analysis, it is ambiguous to use it as a support and resistance role.
The reason is that the user must directly select the important selection points required to create the Fibonacci.
Therefore, it can be useful for chart analysis because it is expressed differently depending on how the user specifies the selection point, but it can be seen as ambiguous for use in trading strategies.
1st: 44234.54
2nd: 61383.23
3rd: 89126.41
101875.70-106275.10 (when overshooting)
4th: 134018.28
151166.97-157451.83 (when overshooting)
5th: 178910.15
-----------------

DogecoinDoge usdt Daily analysis
Time frame 4hours
Risk rewards ratio >2
Dogecoin always has a good volume in the market
Investors know that Musk is interested in Dogecoin, and this is a positive point for this currency. The currency was created as a joke but found its place and now Doge has drawn a clear path for itself and for enthusiasts.
The price is now fluctuating in an ascending triangle. It's very dangerous if market crashed down but I think sentiment of market is positive after Trump.
Of course we must be careful
So my target is not dreamy
I am watching the market and waiting for suitable time to enter again for higher target on 0.73 $

Vine/USDT PRICE PREDICTION 2025 $3.50 2025Vine/USDT PRICE PREDICTION 2025
Means for long-term follow, and where the possibility is for this coin 2025
The best way to enter volume is in steps.
Depending on the 2025 protection for this coin, we expect this is a good chance this coin can gain over $3.50
It can take time, and the price can even breakdown more before it can increase
This update will stay a prediction, do always your study and manage the risk.
Expect nothing from the market, but more see the possibilities.

Dogeusdt BullishDogecoin bullish outloock, we can identify strong bullish entry at 0.3180 level. If price breaks this zone than bears target will be 0.24 zone but hope this doesn't happen.

DOGE potential for 19% short term gain based on Neural Network
Hi all, I developed an simplified AI indicator and I applied it to the DOGE 4 hour time frame chart and got positive results. On average, the backtest is showing roughly a 19% gain per LONG trade. According to the script, we just exited a short trade, and entered a long trade, and the average long trade yields 19%.
Looking at DOGE’s recent price action and leveraging my custom neural network backtest, there's a strong possibility that the coin could see a short-term gain. The model has been extremely accurate in predicting these types of moves, taking into account factors such as market momentum and volume patterns. With the technicals aligning, it appears that DOGE is positioned for a bounce, especially with the broader crypto market showing positive signals.
Keep an eye on DOGE, as the bullish momentum might just surprise us with something bigger.

Ethereum review analysis: buying points and price targets...hello friends
The analysis of Ethereum that we had given you, now we have specified for you step-by-step purchase limits, and the goals have also been specified, and you can enter with capital management...
*Trade safely with us*


DogeCoin (DOGE) To Mars - The Elon Ride (Part 2)COINBASE:DOGEUSD has been loyal to me previously.
I managed to get some good Buys on #DOGE.
I aped continuously on the 7 Cents Levels.
Then cashed all my COINBASE:DOGEUSD earnings at the 42 Cents #Resistance.
* all well documented in the related idea.
What Happened To BINANCE:DOGEUSDT ?
It provided to #Correction I was predicting.
From a #Fibonacci perspective, it's enough to be considered as an #ElliottWave 2.
What's Next For BINANCE:DOGEUSDC ?
$DogeCoin follows MARKETSCOM:BITCOIN and the #Altseason.
With BITSTAMP:BTCUSD about to burst again, so will #DOGECOIN.
It might go #Bull now, or Dip and then... so please DYOR.
The #Bullish move would also be provided by CRYPTOCAP:TOTAL3 & CRYPTOCAP:OTHERS , as a new #ATH is in play.
* see related ideas for more details.
COINBASE:DOGEUSD #TechnicalAnalysis
- #ElliottWave A-B-C Sequence
- #Impulse / #MotiveWave in Primary ⓒ (white)
- #Fibonacci Retracements & Extensions Confluence
My #HODL #Long Levels For BINANCE:DOGEUSDT
I will only go #HODL for this #Crypto #Token.
Trading #Futures ( BINANCE:DOGEUSDT.P ) is not something I want to pursue with $DOGE.
Moderate Entry @ 35 Cents
Conservative Entry @ 24 Cents
TP @ 68 Cents

DOGE Analysis: Unpacking Liquidity & the Battle at Support👀 👉 In this video, we take an in-depth look at Dogecoin (DOGE) paired with USDT. We analyze the trend, market structure, price action, key support and resistance levels, and the role liquidity plays in the markets. Currently, DOGE is trading at a significant support level. On the daily timeframe, there's a case for higher highs and higher lows, while the weekly chart shows bearish pressure over the past week. The big question is: where does it go next? We unpack it all in this video. This is not financial advice.

best tips and strategies to avoid losing money while trading solTrading Solana meme coins (or any speculative assets) can be risky, but there are strategies you can implement to reduce the likelihood of losing money. Here are some tips and strategies:
🔸### **1. Perform Thorough Due Diligence**
- **Project Research**: Investigate the team, roadmap, and purpose of the meme coin. Look for transparency and active community engagement.
- **Smart Contract Audit**: Verify if the project’s code has been audited by reputable firms to rule out vulnerabilities or malicious intent.
- **Tokenomics**: Understand the coin's supply, distribution, and vesting schedules to assess inflation risks.
- **Liquidity**: Check the total locked liquidity and if it's controlled by trusted third parties (like in a locked contract).
🔸### **2. Be Cautious with New Listings**
- **Avoid FOMO**: Don't jump into a token right after its launch due to hype. Often, prices spike initially and then crash.
- **Verify Listings**: Ensure the coin is listed on reputable platforms like CoinGecko or CoinMarketCap and recognized by reliable exchanges.
🔸### **3. Use Risk Management**
- **Position Sizing**: Only invest a small portion of your portfolio in highly speculative meme coins, such as 1-5%.
- **Stop-Loss Orders**: Set stop-loss orders to automatically sell your coins if the price drops to a certain level.
- **Profit-Taking**: Use a systematic approach to secure profits, such as selling a portion after the coin gains a specific percentage.
🔸### **4. Avoid Projects with Red Flags**
- **Anonymous Teams**: Be cautious of projects with unknown or unverified developers.
- **Low Liquidity**: Avoid coins with low trading volumes or liquidity, as you may not be able to sell without affecting the price.
- **Over-Promises**: Be wary of projects that make outrageous claims, such as guaranteed returns or revolutionary technology without proof.
- **Excessive Marketing**: Projects focusing more on memes and hype than utility are often short-lived.
🔸### **5. Check for Rug Pull Indicators**
- **Owner Privileges**: Analyze the smart contract for owner permissions that allow for token minting or draining liquidity.
- **Liquidity Lock**: Ensure the liquidity pool is locked for a significant period (e.g., 6 months or more).
- **Token Distribution**: Avoid coins where a single wallet holds a large percentage of the supply, as this indicates a risk of dumping.
🔸### **6. Use On-Chain Analysis Tools**
- **Explorer Tools**: Platforms like Solscan and Solana Explorer can help analyze token distribution, liquidity, and transactions.
- **Rug-Detection Tools**: Use services like RugDoc or Token Sniffer to evaluate the safety of the project.
- **Social Analytics**: Monitor community activity on Discord, Telegram, or Twitter to gauge organic growth and sentiment.
🔸### **7. Diversify Your Investments**
- Don't put all your money into one meme coin. Spread your risk across multiple assets, including more established cryptocurrencies.
🔸### **8. Stay Updated on Market Trends**
- **News Awareness**: Follow Solana-related news and updates, as ecosystem changes could impact meme coin performance.
- **Whale Activity**: Track large transactions in meme coins to anticipate potential dumps.
🔸### **9. Protect Against Scams**
- **Phishing Attacks**: Be cautious of fake websites, wallets, or social media impersonators.
- **DYOR (Do Your Own Research)**: Verify all information independently before taking action.
- **Secure Wallets**: Use reputable, non-custodial wallets like Phantom or Solflare to store your meme coins securely.
🔸### **10. Control Emotions**
- **Avoid Emotional Trading**: Stay rational and stick to your strategy, even during extreme volatility.
- **Know When to Quit**: If you’re consistently losing or the market becomes unpredictable, step back and reassess.
🔸### **11. Use Decentralized Exchange (DEX) Safely**
- **Verify DEXs**: Use established platforms like Raydium or Orca for trading.
- **Slippage Settings**: Adjust slippage tolerance to avoid unintended price impacts during trades.
🔸### **12. Learn from Past Mistakes**
- Keep a trading journal to track your decisions, evaluate outcomes, and refine your strategies.
🔸### **13. Avoid Leveraged Trading**
- Avoid trading meme coins with leverage, as their inherent volatility can amplify losses.
🔸By implementing these strategies, you can reduce your risk and make more informed decisions while trading Solana meme coins. Always prioritize risk management and long-term sustainability over short-term gains.

dogegov is donethe hype is over.. this is another memecoin that wont see ath again. the false hope was elon promoting this coin but it never happened.. now that dogegov is here what the cause for this price to go higher?

DOGE/USDT 1H: Bears Eye $0.348 After Rejection at $0.37 DOGE/USDT 1H Chart Analysis (SMC Principles)
🚀 Follow me on Tradingview if you respect our charts 📈
Current Price: $0.35948
Market Structure:
Bearish momentum with rejection from $0.37 resistance.
Lower highs forming as price tests the equilibrium zone.
Key Levels:
Resistance: $0.37 (premium zone).
Support: $0.348 (discount zone).
Technical Indicators:
RSI: 54.87, showing hidden bearish divergence.
Trade Setup (Confidence Level: 7/10):
Entry Zone: $0.35948 (current price).
Targets:
T1: $0.355
T2: $0.348
Stop Loss: Above $0.362 (recent swing high).
Risk Score: 7/10 (favorable R:R).
Smart Money Analysis:
Institutional selling pressure visible at $0.37, suggesting distribution.
Accumulation phase likely at $0.348, with market makers targeting liquidity below.
Recommendation:
Short position recommended with clear invalidation above $0.362.
For optimal entry, wait for a retest of $0.36 and monitor volume for confirmation.
Confidence Level: 7/10 for downside continuation.
🚀 Follow me on Tradingview if you respect our charts 📈
