btcusd h3 best level to buy/hold tp 75 000 usd🔸Hello traders, today let's review 3 hour price chart for BTCUSD . Currently
strong sequence of higher lows in progress so expecting more gains in this
market into US elections in November. I recommend to focus on accumulating on dips, bulls maintain control next few weeks.
🔸Previously recommended buying low at/near 60 000 usd. trade made money.
🔸Sequence of higher lows defined by 53 000 / 54 500 / 60 000 / next
higher low expecting near 62 000 / 63 000 usd.
🔸Recommended strategy bulls: accumulate on dips / wait for shallow
pullback and buy low near 62 000 / 63 000 usd. target is 74 / 75 000 usd
into early November. get out before US Elections. good luck.
🎁Please hit the like button and
🎁Leave a comment to support our team!
RISK DISCLAIMER:
Trading Futures , Forex, CFDs and Stocks involves a risk of loss.
Please consider carefully if such trading is appropriate for you.
Past performance is not indicative of future results.
Always limit your leverage and use tight stop loss.
DOGE-1

Dogecoin Revival: The Meme Coin Market is Heating Up Again!CRYPTOCAP:DOGE looks really good here. For the first time since the March highs, it seems like there’s life in the market.
Many of the new meme coins have been surging extensively, like $ANDY, MYX:TURBO , $POPCAT, and whatever cat or frog coins you can think of.
It seems like the time for doggy coins is approaching once again. I’m betting on some of the Solana ecosystem as they tend to go much higher, but it’s always good to have CRYPTOCAP:DOGE as a barometer for anticipating trends.
SEED_DONKEYDAN_MARKET_CAP:BONK and CRYPTOCAP:SHIB are also showing similar patterns.

Dogecoin 15-Minute Time Frame – Triangle Pattern AnalysisOn the 15-minute chart, we have a triangle pattern forming for Dogecoin, but we haven't broken out yet. If we can break the blue trendline and the pink resistance, my target will be the next resistance level in the pink zone.
Strategy: I’ll be monitoring the price action closely for a breakout. If it occurs, I will look to position myself towards that next resistance.

DOGEUSD The new Bullish Wave is taking off.Dogecoin just turned bullish today on its 1D technical outlook (RSI = 58.168, MACD = 0.002, ADX = 16.620) after its 1D RSI spent the first 2 weeks of October sideways, forming the bottom. This is a bottom similar with late Aug-Sep and during that time the 1D MA50 held six different 1D candles. The pattern is a Channel Up the past 10 weeks and today's candle has confirmed the start of the new Bullish Wave. We expect at least another +43.58% rise from the bottom (TP = 0.14450).
## If you like our free content follow our profile to get more daily ideas. ##
## Comments and likes are greatly appreciated. ##

DOGE - Dictated by Market SentimentNormal price setup is approaching a key level.
The yearly level needs to hold, or things could quickly turn bearish. I remain cautiously optimistic because this level presents a pivotal opportunity and is the lowest-risk entry available.
I'm not entering the trade right now as I’m risk-averse at the moment. It could be an optimal play, but #Bitcoin is still weaker than I’d like it to be.
This chart represents about 90% of what the Altcoin market looks like. If you’re overexposed, be prepared to act quickly or have hedges in place in case the situation flips.
Let's wait for the weekly close before making any moves on this and the rest of the Altcoins.

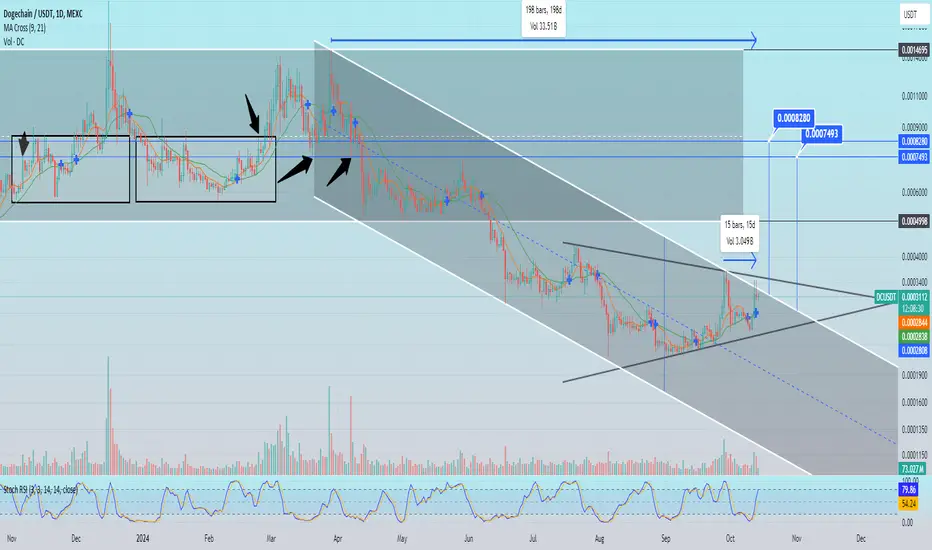
DC. Everything new is a well-forgotten old.The global descending channel formed in April is currently under pressure. The price has been testing the resistance line for two weeks. The potential breakout looks interesting for two reasons:
1. The price target of the channel breakout with a probable time lag, which is due to the formation of an equilateral triangle, curiously coincides with reference points from more than six months ago.
2. The price target of the channel breakout with a probable time lag, which is due to the formation of an equilateral triangle, curiously coincides with the trading area from more than six months ago.
Dogecoin ($DOGE) Primed for a Rally as Key Metrics Turn BullishDogecoin ( CRYPTOCAP:DOGE ) has been showing promising signs that it could be on the verge of a significant rally, with on-chain data pointing to bullish developments. Increased short-term trading activity, whale accumulation, and a surge in active addresses suggest that CRYPTOCAP:DOGE could soon see a strong upward price movement.
Whale Accumulation
One of the most telling indicators of Dogecoin’s potential rise is the behavior of large holders, or "whales." According to recent data from Santiment, whales holding between 1 and 10 million CRYPTOCAP:DOGE have accumulated over 2.07 billion CRYPTOCAP:DOGE in just one week. This level of whale activity marks the largest accumulation of Dogecoin since January and signals growing confidence among larger holders. Historically, whale accumulation precedes significant price rallies, as these large investors often have insider knowledge or access to market trends.
Active Addresses Surge
In the last few weeks, the number of active Dogecoin addresses surged to over 133,880, the highest level in eight months. This sharp increase in participation demonstrates renewed interest in CRYPTOCAP:DOGE from both new users and long-term holders. A rise in active addresses typically reflects increased trading activity, which could lead to higher demand and, in turn, upward price momentum.
Increased Short-Term Trading Activity
Another key metric supporting a potential rally is the surge in short-term trading activity. Over 110,000 short-term traders have been actively trading CRYPTOCAP:DOGE in the past week, far surpassing other meme coins like Shiba Inu and Pepe. This heightened trading volume highlights that CRYPTOCAP:DOGE remains a favorite for speculative traders looking to capitalize on quick price movements. As trading volume grows, it often precedes larger, sustained rallies, especially in the memecoin sector.
Historical Patterns
Dogecoin’s recent price movement aligns with its historical behavior following breakouts from a multi-year descending triangle pattern. This particular technical setup has been a precursor to major price rallies for CRYPTOCAP:DOGE in the past, with the coin experiencing surges of up to 200% after similar breakouts. For example, CRYPTOCAP:DOGE saw a 200% price increase after breaking out of this pattern in 2015, and another massive rally followed similar breakouts in 2017 and 2021.
Currently, Dogecoin ( CRYPTOCAP:DOGE ) is showing signs of breaking out from another descending triangle, which could lead to a midterm rally pushing the price up to $0.2236. At the time of writing, CRYPTOCAP:DOGE is trading at $0.1111, reflecting a 2.92% increase in the last 24 hours. If the historical trend holds, this breakout could set the stage for another significant bull run.
Rising Trend Channel and RSI
Technically, CRYPTOCAP:DOGE is trading within a rising trend channel, showing upward momentum. The Relative Strength Index (RSI) currently sits at 61.90, indicating that the asset is neither overbought nor oversold. An RSI in this range suggests that there is still plenty of room for upward price movement without the risk of an imminent correction. Moreover, the appearance of a bullish engulfing pattern on the daily price chart signals that Dogecoin could be gearing up for further gains, especially after a period of consolidation.
Key Levels to Watch
The $0.12 pivot is a critical level for Dogecoin ( CRYPTOCAP:DOGE ). If the price can break and hold above this point, it could signal the start of a new rally, potentially pushing the price toward $0.2236 in the midterm. Additionally, with Bitcoin ( CRYPTOCAP:BTC ) trading at $65,000, the broader crypto market sentiment could positively influence Dogecoin’s price, as altcoins often mirror Bitcoin's movements during bull runs.
Broader Market Conditions
In addition to on-chain data and technical analysis, broader macroeconomic factors could play a role in Dogecoin’s price trajectory. The overall crypto market sentiment has been improving, driven by positive investor sentiment and rising interest in digital assets as inflation concerns persist. Dogecoin ( CRYPTOCAP:DOGE ) has historically benefited from such bullish market conditions, especially when key figures like Elon Musk or other high-profile endorsers mention the coin.
Conclusion: Is CRYPTOCAP:DOGE Ready for a 200% Surge?
Dogecoin’s recent price action and on-chain metrics suggest that the memecoin could be primed for a substantial rally. Whale accumulation, a surge in active addresses, and increased short-term trading activity all point to growing confidence in CRYPTOCAP:DOGE ’s future. Technically, Dogecoin’s breakout from a descending triangle pattern and its rising trend channel further support the possibility of a 200% surge, with a target price of $0.2236 in the coming weeks.
While the cryptocurrency market remains volatile, and CRYPTOCAP:DOGE ’s memecoin status leaves it vulnerable to speculative trading, the signs are positive for those looking for the next major rally. As always, investors should proceed with caution, but the stars seem to be aligning for another impressive Dogecoin ( CRYPTOCAP:DOGE ) bull run.

Dogecoin BreakoutDogecoin has just broken out of a similar down sloping trendline as the previous two cycles. In the last two cycles this had marked the start of a period of large upside for Doge. High degree of confidence that we see similar follow through this cycle.

DC. Reversed Head and Shoulders.The potential formation of the "Inverted Head and Shoulders" pattern indicates a local trend change is coming. Considering all my previous ideas and considering what the chart says - a change in the global trend is coming. Structures are being built, structures in the plural, which together can create a bullish trend. And in my subjective view, the trend can be impressive.

DOGECOIN MAJOR BUY ZONE INCOMING AND POTENTIALLY LOWER?Here's the important numbers for doge at the moment.
You can adjust them a bit for your needs.
There is some really short term indicators that, when reset, put everything in alignment to see a lot of bullish movement coming into DOGE.
Again, because the market is the market it can easily break through this strong trend it's about to hit.
Good news is it falls to support at .0888
Even better news, should it fall more, there is support at an even lower level, likely.
I'd be looking to see if I can get my position set soon.
I think there is a bullish future for this good dog.
Watch SHIB for a bigger move to the upside, with a drop that would be to basically zero.
Doge has the support to take it up to .29 and maybe even .45, and as quick as dogecoin can confirm a jump like that, you'll see it at probably $10.
I've been consistently super bullish on this coin, and currently, I'm liking the look of the chart.

DC. Potential Cup and Handle with 775% gain.Here it is important to initially pay attention to moving averages and fact that the price has taken hold above the long-term moving average for the first time more than half a year. The price is potentially forming a Cup and Handle pattern on a two-year downtrend. Moon soon.

DC. Bottomed out.DC through the prism of the Fibonacci grid has a minimum 389% growth potential. If CRYPTOCAP:DOGE shake out the market again then all dogs-meme assets will spike hard. RSI is oversold on the monthly and weekly charts. Bottomed out.

DOGEUSD Are you people ready??We have recently viewed Dogecoin's (DOGEUSD) Cycles and mentioned why we expect it to start rising parabolically soon. What we haven't done but it's what we bring you today is those Cycles compared to the Cycles of the flagship of the crypto world, Bitcoin (BTCUSD).
We will keep it simple, because that's what the chart is, no need to complicate what's obvious with added terms and info.
As you can see, every time Bitcoin broke above its All Time High (ATH), Dogecoin was on a medium-term correction (though well within its Bull Cycle) under Lower Highs and marginally above the 0.236 Fibonacci retracement level. Once Bitcoin broke out, Doge did also only though much more aggressively and within a few weeks it reached its previous ATH.
Needless to say, it didn't stop there but went on to peak much higher. Once more, the market finds itself in the exact same position as before in history. Are you ready??
-------------------------------------------------------------------------------
** Please LIKE 👍, FOLLOW ✅, SHARE 🙌 and COMMENT ✍ if you enjoy this idea! Also share your ideas and charts in the comments section below! This is best way to keep it relevant, support us, keep the content here free and allow the idea to reach as many people as possible. **
-------------------------------------------------------------------------------
💸💸💸💸💸💸
👇 👇 👇 👇 👇 👇

KOKO - Daily Pump AgainMEXC:KOKOUSDT is currently sitting on its key support zone, signaling a potential pump soon. The price of Koala AI (KOKO) has seen some volatility recently, dropping by more than 10% over the last week. However, it remains a popular token in the meme coin and AI space, with expectations of recovery as it finds support. Market indicators suggest that once KOKO bounces from this support, it could rally again, especially considering its potential to capitalize on AI-driven trends in the coming months

$DOGE range strategy for 3000% runthe best place to buy doge has always been in the lower half of the breakout range (s/r flip) targeting the diag channel upper sell zone.
each low has been marked by sweeping the previous low within the diag buy zone.
in other words lower half range + buy zone = good buy
and breaking above previous range into sell zone = good sell
its a very easy strategy for opportunistic buying and selling.

ETH Best level to BUY/HOLD TP 50% gains🔸Hello traders, today let's review 8hour price chart for ETHUSD . strong gains recently off the range lows ,however currently price still stuck in the well-defined distribution range established in August 2024.
🔸We are stuck in mixed range / distribution, since previously price
dumped in the summer time therefore expecting more losses in this
market before an eventual recovery / bounce off the strong S/R below.
Range is defined by 2300 usd lows and 2750 usd highs. so far we are
still stuck in this range and I can't recommend any trades right now.
🔸Recommended strategy bulls: wait for a fake breakdown of the
recent range expecting one final swipe higher towards 2750 before
the eventual dump / breakdown. I got two important levels marked
down on my chart - 2 000 USD and 3 000 USD. Expecting price reversal
at/near 2 000 usd as the bulls will defend this level. Logical price target
for the swing trade setups for the bulls is 3 000 USD, this trade got
50% unleveraged/clean upside. Keep in mind that this is a swing trade
so naturally will take more time to hit TP. good luck, traders!
🎁Please hit the like button and
🎁Leave a comment to support our team!
RISK DISCLAIMER:
Trading Futures , Forex, CFDs and Stocks involves a risk of loss.
Please consider carefully if such trading is appropriate for you.
Past performance is not indicative of future results.
Always limit your leverage and use tight stop loss.

DOGE at a Critical Juncture: Breakout Signals Potential RallyMarket Overview:
Dogecoin (DOGE/USD) has broken above a key diagonal trendline, suggesting a potential shift in its long-term trajectory.
The recent price action also includes a higher-high, and if a higher-low forms during the current pullback, it would solidify a short-term bullish trend.
Price Targets:
If the breakout holds, Dogecoin could target previous swing highs in the $0.13-$0.14 range.
Monitoring the volume profile is key, as strong buying volume will confirm the momentum of this breakout.
#Dogecoin #DOGE #CryptoAnalysis #BullishTrend #Breakout

Doge's long-term goals0.1 and 0.09 supports are suitable for buying.
The 0.09 support is also on the trend curve, so it is more important.
The last target for Doge seems to be $6 as it starts a long-term uptrend.
Share your opinion with me.
Don't forget to boost and follow.

Dogecoin Potential Rejection at ResistanceI'm monitoring Dogecoin, and if the price reaches this key resistance level, it could face rejection. This setup presents a potential short opportunity if the price gets rejected from this resistance zone.

BabyDoge - WeeklyThis super consolidation of OKX:BABYDOGEUSDT can break and go up to the moon in the next alt season. 🚀
I expect more correction for now. 📉

Wif Bullish to $6.20It appears that if Bitcoin does not enter a bearish phase, we will experience an altcoin season, presenting optimal long entry opportunities with minimal stop-loss requirements.
Therefore I see WIF going to $6.2

PEPE forecast price🐸 1000PEPEUSDT.P Technical Analysis:
We’re currently at a critical support level around 0.0088004 📉. If price stabilizes below this area, expect further drops to the 0.0076411 zone, marking a potential 13.04% decline 📉.
However, there's a descending trendline ⤵️ pressing the price down. A break above this line would be a sign of reversal 🔄, targeting the first resistance at 0.0095467 💥. If the price holds above this point, it could trigger a bullish move towards higher resistances at 0.010237 (a 10.74% increase) and then to 0.0118714 (a 19.64% increase) 📈.
Key strategy: Watch for volume spikes 📊 and wait for a clean breakout above the descending trendline for a potential buying opportunity 🚀. If support breaks, prepare for deeper pullbacks ⬇️.
Stay sharp and manage your risks properly! 🛡️"

[DOGE/USD] Channel BreakoutCRYPTO:DOGEUSD is retesting the support after breaking out its downtrend channel on daily timeframe.
Cherio...
