Crypto update for 2025.05.22Bitcoin hits a new all-time high, but others are lagging. What's the deal?
Let's dig in...
CRYPTO:BTCUSD
CRYPTO:BCHUSD
CRYPTO:ETHUSD
CRYPTO:XRPUSD
CRYPTO:LTCUSD
CRYPTO:DOGEUSD
CRYPTO:DOTUSD
CRYPTO:TRXUSD
Let us know what you think in the comments below.
Thank you.
77.3% of retail investor accounts lose money when trading CFDs with this provider. You should consider whether you understand how CFDs work and whether you can afford to take the high risk of losing your money. Past performance is not necessarily indicative of future results. The value of investments may fall as well as rise and the investor may not get back the amount initially invested. This content is not intended for nor applicable to residents of the UK. Cryptocurrency CFDs and spread bets are restricted in the UK for all retail clients.
DOGE-1

DOGE Ready for PUMP or what ?I might be wrong , but it might come true From a technical perspective!!!
Give me some energy !!
✨We spend hours finding potential opportunities and writing useful ideas, we would be happy if you support us.
Best regards CobraVanguard.💚
_ _ _ _ __ _ _ _ _ _ _ _ _ _ _ _ _ _ _ _ _ _ _ _ _ _ _ _ _ _ _ _
✅Thank you, and for more ideas, hit ❤️Like❤️ and 🌟Follow🌟!
⚠️Things can change...
The markets are always changing and even with all these signals, the market changes tend to be strong and fast!!

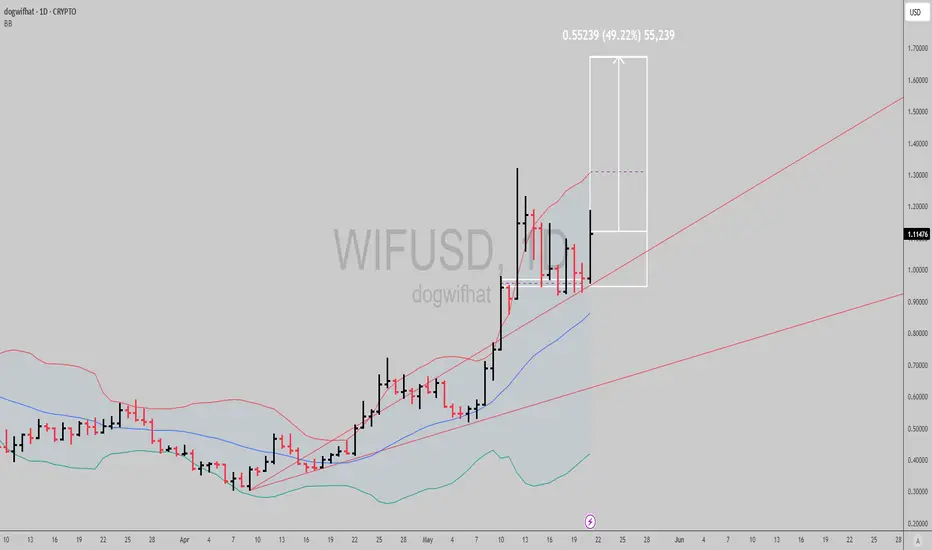
$WIF: Uptrend signal activeNice signal in SEED_WANDERIN_JIMZIP900:WIF here, the trend in the daily timeframe has been bullish since April 18th, and has been giving us multiple continuation signals to trade in and out, or scale in with low risk as we move the stop higher if playing it longer term.
If prices hold above recent lows, we can see a close to 50% run from here within a week give or take.
Best of luck!
Cheers,
Ivan Labrie.
DOGE Awakens: Breakout from Descending Channel!!BINANCE:DOGEUSDT has finally broken free from its long-term descending channel, signaling a potential trend reversal after months of consolidation. What makes this move significant is the current retest of the previous local breakout level. A classic bullish setup that often leads to strong upward continuation if the retest holds.
The price action is also showing early signs of strength, forming a series of higher highs, which further confirms the bullish structure. This technical development, combined with CRYPTOCAP:DOGE ’s passionate fanbase and historical tendency to pump hard when momentum kicks in, could make this a high-potential setup.
As always, proper risk management is key. While the chart looks promising, it’s crucial to place a stop loss to protect against invalidation. If the support holds, CRYPTOCAP:DOGE could be preparing for a big move — possibly one of those signature rallies that only CRYPTOCAP:DOGE knows how to deliver.
BINANCE:DOGEUSDT Currently trading at $0.181
Buy level : Above $0.17
Stop loss : Below $0.141
Target : $0.435
Max leverage 3x
Always keep stop loss
Follow Our Tradingview Account for More Technical Analysis Updates, | Like, Share and Comment Your thoughts

"DOGE - Time to buy again!" (Update)So if you pay attention to the doge chart you can see that the price has formed a Ascending FLAG or wedge which means it is expected to price move as equal as the measured price movement.( AB=CD )
NOTE: wait for break of the FLAG .
Give me some energy !!
✨We spend hours finding potential opportunities and writing useful ideas, we would be happy if you support us.
Best regards CobraVanguard.💚
_ _ _ _ __ _ _ _ _ _ _ _ _ _ _ _ _ _ _ _ _ _ _ _ _ _ _ _ _ _ _ _
✅Thank you, and for more ideas, hit ❤️Like❤️ and 🌟Follow🌟!
⚠️Things can change...
The markets are always changing and even with all these signals, the market changes tend to be strong and fast!!

doge buy midterm"🌟 Welcome to Golden Candle! 🌟
We're a team of 📈 passionate traders 📉 who love sharing our 🔍 technical analysis insights 🔎 with the TradingView community. 🌎
Our goal is to provide 💡 valuable perspectives 💡 on market trends and patterns, but 🚫 please note that our analyses are not intended as buy or sell recommendations. 🚫
Instead, they reflect our own 💭 personal attitudes and thoughts. 💭
Follow along and 📚 learn 📚 from our analyses! 📊💡"

DOGE monthly grows is hereIf we check Dogecoin on monthly timeframe and compare that to the previous cycle:
1) 20 & 50 MA on monthly held the price
2) The RSI level is too low and has a lot of room to growth to about 80 level
3) The support held
4) Six months growth gives October 2025
5) June & July most be pretty bullish

DOGEUSDT 1D Analysis DOGE ~ 1D Analysis
#DOGE Buy after successfully breaking this resistance line with a short term target of at least 10%+ from here.

Dogecoin: 10 Years Long Uptrend?Dogecoin bottomed June 2022 but bullish action, the uptrend, actually started in October 2023. Notice the chart with the clear rising channel. Who is to say that such a channel will not continue for ten years or more?
Market dynamics were very difference just two years ago, let alone 5 years ago or 10 years ago when only Bitcoin was around.
The Cryptocurrency market is growing and changing, evolving, and this evolution will definitely be reflected on the chart. The chart is the price. Price dynamics will forever change for the better.
Popular wisdom. As a market becomes older, it becomes more stable but it continues with its general long-term trend; growth.
We are a growing market and growth cannot be stopped. You either have growth or decay. We are growing and will continue to grow long-term. 100% certain because Cryptocurrency is not just a new form of finance, a new money, Cryptocurrency is the technology of the new generation, the future. Instead of paper, digital, your screen.
Since Cryptocurrency is a reflection of us human beings and we are now on an accelerated path toward growth, the market will follow; We are going up!
Bet LONG, buy spot and hold or do anything that is necessary to get your hands on some Crypto. The stock market is old and for this reason it now only pays around 7% (after fees and taxes). Crypto is young and for this reason it pays 300% (in the cloud, the Internet, global —better for taxes).
The future is freedom of expression, freedom of finance and freedom of choice. With Cryptocurrency, you can choose the type of money you can use and own.
Namaste.

DOGE About to Explode? Key Levels to Watch!Yello, Paradisers! Are you watching #DOGE closely? Because a breakout is forming right in front of our eyes, and most traders won’t be ready for it.
💎After completing a clean ABC correction, DOGE formed an inverse head and shoulders pattern which is a classic bottom structure that has already initiated its breakout with a strong first push from the bulls. This was a major shift in sentiment, and momentum is clearly shifting in favor of buyers.
💎#DOGEUSDT is currently forming a bullish flag patten, a consolidation pattern that signals continuation rather than exhaustion. This ongoing flag has held firm over the past few days, and price is now coiling tighter, indicating that a fresh breakout is nearing. If the bulls maintain control, the next leg higher is about to be triggered.
💎The critical level to watch is $0.2325. A clean break above this resistance would activate the next impulse move, opening the door toward $0.250 as the first target, followed by $0.2620. That is where some profit-taking is likely to occur, but as long as bulls hold momentum, the rally is unlikely to stop there.
💎The full target of the bull flag formation extends into the $0.300–$0.3200 region. This area is not just a technical objective rather it’s also a strong horizontal resistance zone and aligns with the 61.8% Fibonacci retracement level from the previous move down. This convergence makes it a high-risk, high-reward area and a critical decision point for the market.
💎DOGE remains technically supported at the $0.2100 level, which has proven resilient during short-term pullbacks. Below that, both the EMA-200 and EMA-50 are providing additional support. These two moving averages are on the verge of forming a golden cross — one of the strongest signals in trend continuation analysis, reinforcing the medium-term bullish outlook.
Paradisers, strive for consistency, not quick profits. Treat the market as a businessman, not as a gambler.
MyCryptoParadise
iFeel the success🌴

doge buylimit midterm"🌟 Welcome to Golden Candle! 🌟
We're a team of 📈 passionate traders 📉 who love sharing our 🔍 technical analysis insights 🔎 with the TradingView community. 🌎
Our goal is to provide 💡 valuable perspectives 💡 on market trends and patterns, but 🚫 please note that our analyses are not intended as buy or sell recommendations. 🚫
Instead, they reflect our own 💭 personal attitudes and thoughts. 💭
Follow along and 📚 learn 📚 from our analyses! 📊💡"

DOGEUSDT - Worth to Take Some RisksBINANCE:DOGEUSDT — Buyer Stepping in After the Sweep?
BINANCE:DOGEUSDT just pulled a textbook move I’ve seen play out hundreds of times — swept a key low, triggered stops, then snapped back up. That’s never accidental.
I’ve been watching this carefully, and I believe we just entered an area with a real buyer behind it.
🔵 Blue Box: Hidden Demand Zone
Price made a new local low, then quickly reversed, printing a bullish engulfing candle on high volume — but here’s what matters more:
On the drop, CDV didn’t follow. That’s a subtle but powerful divergence that shows aggressive selling wasn't truly present — just a liquidity sweep.
Now price is hovering above that zone. This blue box is where I believe the real position was built. If we come back down and test it with weak selling and small-bodied candles, I’m looking for an entry.
🔁 Game Plan
If price pulls back into the blue box and shows buyer defense on the 1m/5m, I’ll enter long. Simple.
If we break lower again but reclaim the box with force and retest it cleanly, I’ll also long that reclaim.
No long if the zone breaks cleanly and volume confirms the breakdown — I’ll reassess for shorts only if it retests from below.
I will not insist on my long idea.
If this level gives way and doesn’t reclaim with conviction, I’ll step aside.
But if it reclaims and gives me confirmation, I’ll take it.
📊 Order Flow & Volume
This entire sweep was followed by a volume spike into the low and a delta absorption pattern — price moved down, but aggressive buyers were filling in. That’s never retail.
Now we’re seeing low effort in pushes downward. That’s when traps get set. Don’t be surprised if we see a sharp move upward in the next sessions.
🧠 Final Word
Most traders will only see a “double bottom” if this plays out. They won’t realize the liquidity grab has already happened.
If you ignore this level, you might regret it.
This is how the big moves start — quietly, after the sweep, before the crowd even notices.
And these are the setups that have built my high win rate.
📌I keep my charts clean and simple because I believe clarity leads to better decisions.
📌My approach is built on years of experience and a solid track record. I don’t claim to know it all but I’m confident in my ability to spot high-probability setups.
📌If you would like to learn how to use the heatmap, cumulative volume delta and volume footprint techniques that I use below to determine very accurate demand regions, you can send me a private message. I help anyone who wants it completely free of charge.
🔑I have a long list of my proven technique below:
🎯 ZENUSDT.P: Patience & Profitability | %230 Reaction from the Sniper Entry
🐶 DOGEUSDT.P: Next Move
🎨 RENDERUSDT.P: Opportunity of the Month
💎 ETHUSDT.P: Where to Retrace
🟢 BNBUSDT.P: Potential Surge
📊 BTC Dominance: Reaction Zone
🌊 WAVESUSDT.P: Demand Zone Potential
🟣 UNIUSDT.P: Long-Term Trade
🔵 XRPUSDT.P: Entry Zones
🔗 LINKUSDT.P: Follow The River
📈 BTCUSDT.P: Two Key Demand Zones
🟩 POLUSDT: Bullish Momentum
🌟 PENDLEUSDT.P: Where Opportunity Meets Precision
🔥 BTCUSDT.P: Liquidation of Highly Leveraged Longs
🌊 SOLUSDT.P: SOL's Dip - Your Opportunity
🐸 1000PEPEUSDT.P: Prime Bounce Zone Unlocked
🚀 ETHUSDT.P: Set to Explode - Don't Miss This Game Changer
🤖 IQUSDT: Smart Plan
⚡️ PONDUSDT: A Trade Not Taken Is Better Than a Losing One
💼 STMXUSDT: 2 Buying Areas
🐢 TURBOUSDT: Buy Zones and Buyer Presence
🌍 ICPUSDT.P: Massive Upside Potential | Check the Trade Update For Seeing Results
🟠 IDEXUSDT: Spot Buy Area | %26 Profit if You Trade with MSB
📌 USUALUSDT: Buyers Are Active + %70 Profit in Total
🌟 FORTHUSDT: Sniper Entry +%26 Reaction
🐳 QKCUSDT: Sniper Entry +%57 Reaction
📊 BTC.D: Retest of Key Area Highly Likely
📊 XNOUSDT %80 Reaction with a Simple Blue Box!
📊 BELUSDT Amazing %120 Reaction!
📊 Simple Red Box, Extraordinary Results
I stopped adding to the list because it's kinda tiring to add 5-10 charts in every move but you can check my profile and see that it goes on..

DOGE/USDT: BULLISH FLAG FORMATION!!🚀 DOGE Bull Flag Formation – 60% Potential Incoming?! 👀🔥
Hey Traders! If you're all about high-conviction plays and real alpha, smash that 👍 and tap Follow for more setups that actually deliver! 💹💯
Dogecoin is setting up beautifully inside a falling channel – a classic bull flag pattern after a strong 52% rally last week. 📉📈
Price is now consolidating near the lower support of the flag structure, with a bounce zone clearly visible. If this support holds, we could see a strong impulsive breakout in the coming sessions.
🔹 Potential Play:
Entry Zone: Current levels to slight dips ($0.213–$0.218)
Targets: $0.26 / $0.29 / $0.31+
Invalidation: Daily close below $0.205
💥 Breakout confirmation with volume could trigger a fresh leg up. Keep this on your radar — it’s gearing up for a move!
📊 Let me know your thoughts in the comments — bullish or bearish?

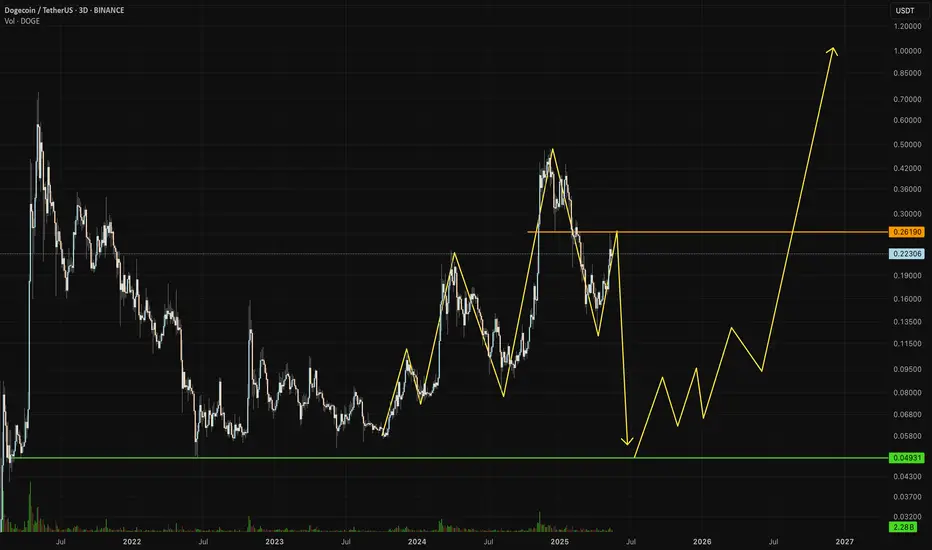
DOGE going homeDOGE to revisit 0.049 - 0.050 zone in the coming flush crash then riding the bullrun wave
"DOGE - Time to buy again!" (Update)So if you pay attention to the doge chart you can see that the price has formed a Ascending FLAG or wedge which means it is expected to price move as equal as the measured price movement.( AB=CD )
NOTE: wait for break of the FLAG .
Give me some energy !!
✨We spend hours finding potential opportunities and writing useful ideas, we would be happy if you support us.
Best regards CobraVanguard.💚
_ _ _ _ __ _ _ _ _ _ _ _ _ _ _ _ _ _ _ _ _ _ _ _ _ _ _ _ _ _ _ _
✅Thank you, and for more ideas, hit ❤️Like❤️ and 🌟Follow🌟!
⚠️Things can change...
The markets are always changing and even with all these signals, the market changes tend to be strong and fast!!

DOGE Ready for PUMP or what ?What I see now is that the price could correct to the PRZ and then pump again, and currently, there is no specific bullish pattern in the chart. which could cause the price to drop below 20 cents.

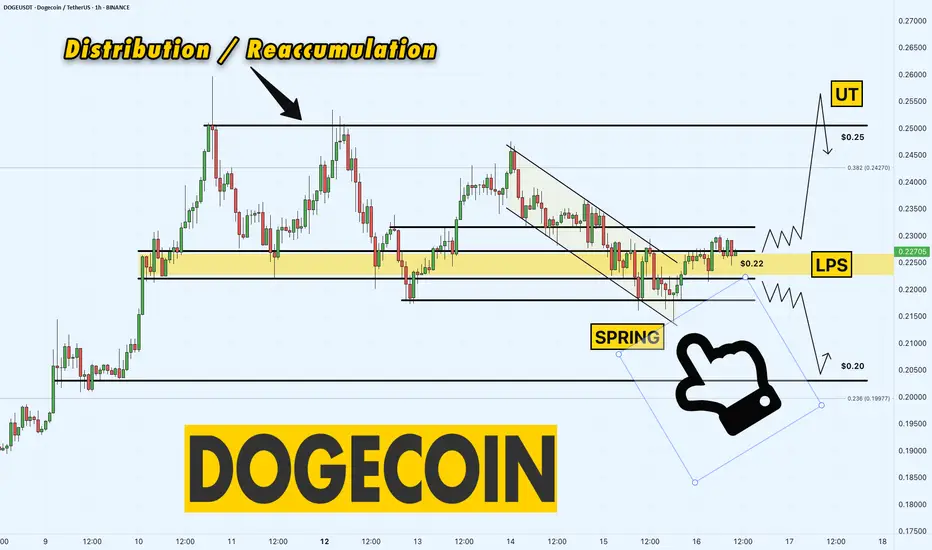
DOGE/USDT 1-Hour Chart – Distribution or Reaccumulation?Dogecoin is at a critical juncture on the 1-hour chart!
We’re seeing signs of a Distribution/Reaccumulation phase, with the price action teasing a potential move. After a possible Spring shakeout at $0.215, DOGE has climbed into the Last Point of Support (LPS) range between $0.22 and $0.23. This could be a launching pad for a bullish move!
I’m watching for a push toward $0.25, where we might see a UT (Upthrust) structure form — a solid target for this setup. However, if the price fails to hold, a breakdown below $0.22 could send us toward the $0.20 level, a key support to watch. The $0.22-$0.23 zone is critical right now — will bulls take control, or will bears strike back? Let’s find out!
Key Levels to Watch:
Support: $0.22 (LPS range), $0.20 (breakdown target)
Resistance: $0.23 (upper LPS range)
Target: $0.25 (potential UT structure)
What’s your call, traders? Are we heading for $0.25, or will $0.20 come into play ? Drop your thoughts below!
First step towards ATH BULIISH FLAG on DOGE
In several time frames DOGE has formed a Bullish Flag from around $0.16 going to $0.32.
This is the first dog step to the ATH!

Be careful with DOGE !!!So if you pay attention to the DOGE chart you can see that the price has formed a Ascending FLAG or DOGE which means it is expected to price move as equal as the measured price movement.( AB=CD )
NOTE: wait for break of the FLAG .
Give me some energy !!
✨We spend hours finding potential opportunities and writing useful ideas, we would be happy if you support us.
Best regards CobraVanguard.💚
_ _ _ _ __ _ _ _ _ _ _ _ _ _ _ _ _ _ _ _ _ _ _ _ _ _ _ _ _ _ _ _
✅Thank you, and for more ideas, hit ❤️Like❤️ and 🌟Follow🌟!
⚠️Things can change...
The markets are always changing and even with all these signals, the market changes tend to be strong and fast!!

Dogecoin (DOGE) OverboughtI have been trading for a long time using the DCA strategy indicator that I have developed and I have recently published the indicator on my Tradingview page.
According to this indicator, I have been buying DOGEs at support levels with more money than I would have thrown away so far. This support level is generally seen at $0.056. In addition, I dumped some of my DOGE at $0.2285, but then bought again at $0.107. I have already shared this analysis.
I think that DOGE, which has broken through two resistances, will advance at least up to $0.75 (potential 89% return). But for this progress, I think that it must first find support at the $0.2285 level, which was broken again. This is because the indicator also gives an overbought signal. Therefore, I will tailor my portfolio accordingly. But I wouldn't be surprised if it continues relentlessly.
As long as Elon Musk remains in government, I think this cryptocurrency will be on a continuous upward trend.

Dogecoin Long-Term, Weekly TimeframeRepeating patterns are great because you can easily predict the future by studying them.
Good...
Dogecoin produced a peak in March 2024 and starts a decent. This descent creates a sequence of lows marked 1,2,3 on the chart. This ends up as a rounded bottom. As soon as the action recovers above the baseline of the rounded bottom, there is some consolidation and then massive growth. The highest prices in several years. The situation is very similar today.
Dogecoin produced a peak in December 2024 and then starts a descent. This descent creates the bottom pattern shown on the chart. The market is already bullish as all the bearish action since February has been removed. DOGEUSDT moves now as if it were February 2025. March and April where the months that produced the final market shakeout (flush) before the 2025 bull market cycle and wave.
Right now we can see some consolidation based on the weekly timeframe, very short, followed by additional growth. The biggest wave since 2021. Something awesome.
Are you ready?
I hope you are...
Namaste.

Dogecoin is ready to blast off!A lot of people have no idea just how big the Dogecoin pump could be. We’ve seen a massive, multi-year accumulation pattern—very similar to what happened before explosive moves in assets like Tesla and Bitcoin. I believe this quiet phase is about to end, and Dogecoin could soon break out in a huge way.
This could send DOGE soaring to a new all-time high and ignite a powerful bull market.
As always, stay profitable.
– Dalin Anderson

DOGE (Dogecoin)–Pullback Opportunity Amid Market-Wide ResistanceWith the total crypto market cap stalling at a major resistance zone, many altcoins — including DOGE — are due for a healthy retracement after recent strong moves. This sets up a potential buy-the-dip opportunity as DOGE returns to key support near $0.20.
🔹 Entry Zone:
$0.20 (next major support zone after recent rally)
🎯 Take Profit Targets:
🥇 $0.23 – $0.24
🥈 $0.30 – $0.31
🛑 Stop Loss:
Just below $0.18 (invalidates the support-based long idea)
