The Meme Coin Race Has Begun, DOGE fighting for top spot!📈 The Meme Coin Race Has Begun
🔥 The battle for the throne is heating up...
🐶 DOGE, the original meme coin, isn’t giving up its crown without a fight.
Fractals from the past seem to echo in today's chart – history doesn’t repeat, but it rhymes.
⚔️ With new challengers lining up in the meme arena, one question remains:
Can DOGE reach $2.45 and reclaim the top spot?
🚀 Volume is rising. Patterns are aligning.
The king is awake.
👑 The OG vs the New School. Who will win the meme war?
Comment your prediction 👇
#DOGE #MemeSeason #CryptoFractals #Altseason #DOGEUSDT #CryptoTrading #TradingView #FractalAnalysis #CryptoWar #MemeCoins
Doge

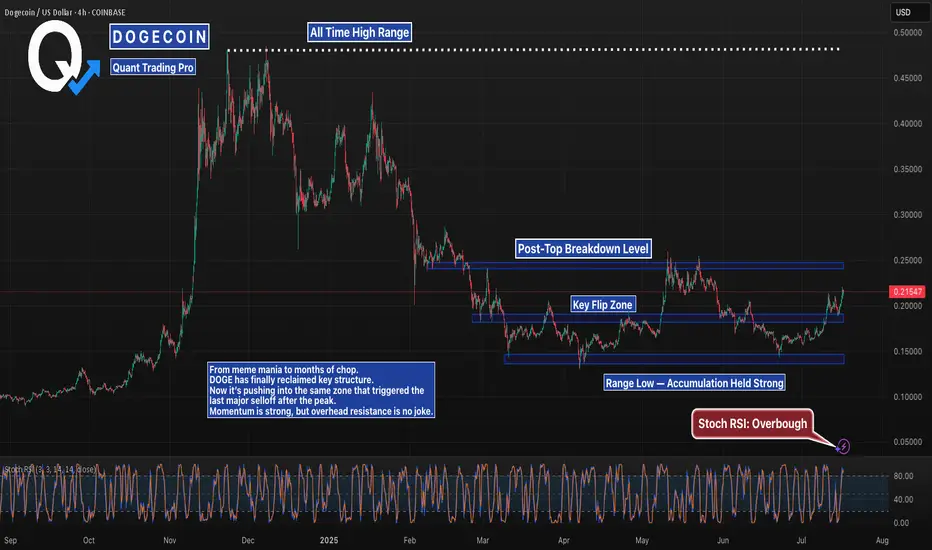
DOGE Is Climbing Back Toward Its Post-Hype BreakdownDOGE peaked near $0.50 during peak hype and crashed hard.
After grinding sideways for months, it’s now reclaiming lost ground.
The $0.245–0.25 zone is where the real test begins — it’s the same area that triggered the major breakdown after the blowoff top.
If bulls hold above $0.20, this push might have real legs.
#Dogecoin #DOGEUSD #CryptoCharts #ChartBreakdown #ResistanceTest #QuantTradingPro #CryptoAnalysis #BacktestEverything #TradingView
DOGESH DOGE again!DOGESH looks an Indian name I like it hahahhahaa, but yes have power to fly up without farts help
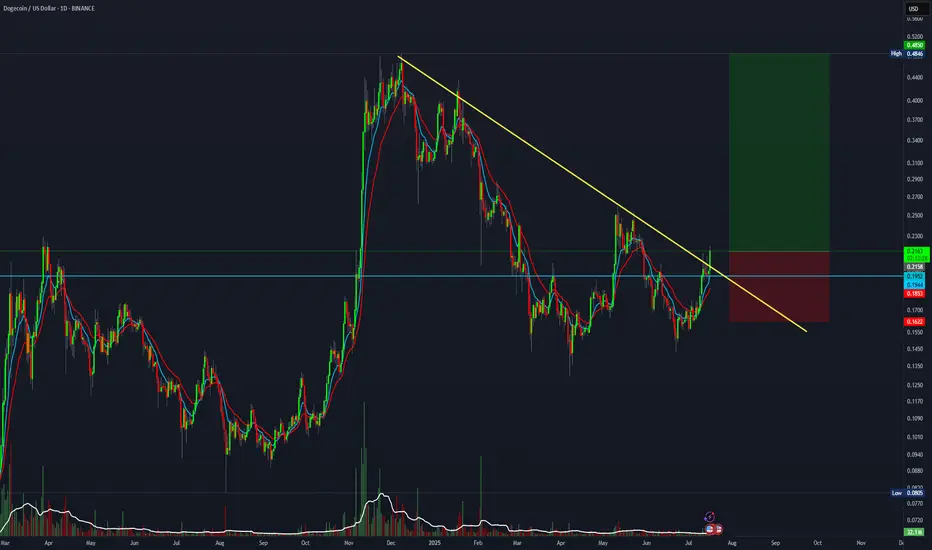
5:1 R:R for Dogecoin.DOGE is breaking out from the trendline. This setup offers a 5:1 R:R
Entry: 0.216
Stop Loss: 0.162
Target: 0.48
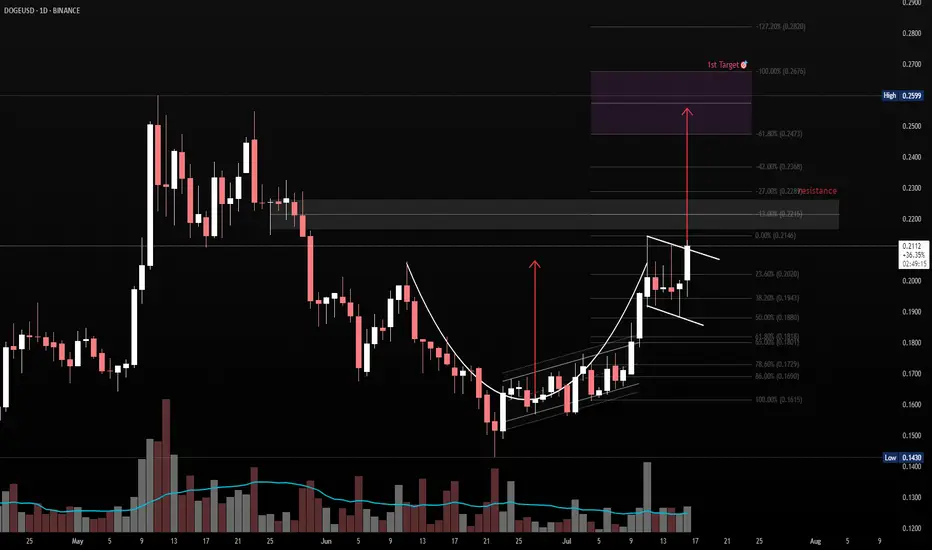
Cup & Handle Breakout Watch – DOGE/USDTPattern: Cup & Handle
Timeframe: 1D
Cup Range: $0.168 → $0.212
Handle: Forming as a descending bull flag
Breakout Level: ~$0.2125
Measured Target: ~$0.256
Confluence:
Clean rounded base (cup)
Tight flag pullback (handle)
Volume decrease during handle = healthy
Prior resistance aligns with projected target zone
Bias: Bullish (on breakout with volume confirmation)
📌 Watching for breakout above handle resistance with rising volume to confirm entry. Measured move aligns with historical supply zone.
After break out from 0.216~0.226
Target Zone: 0.24~0.26
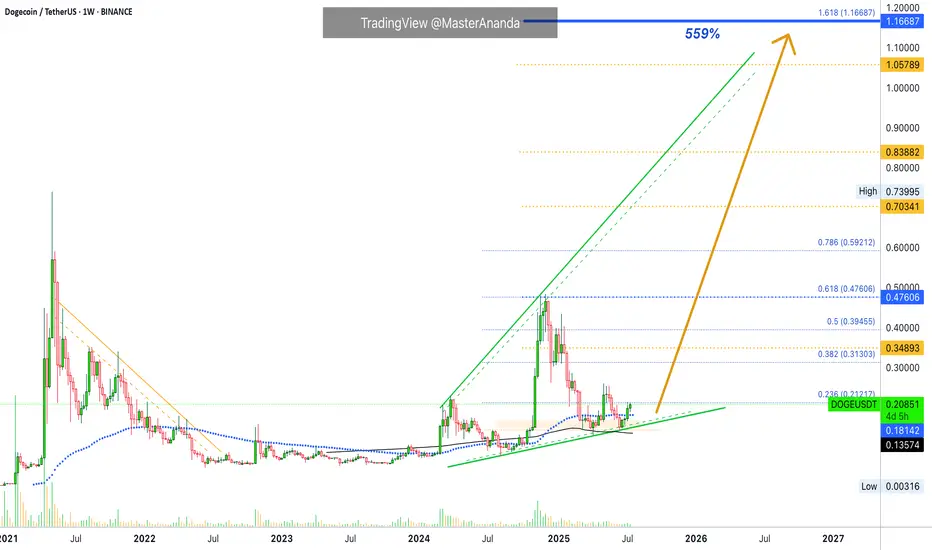
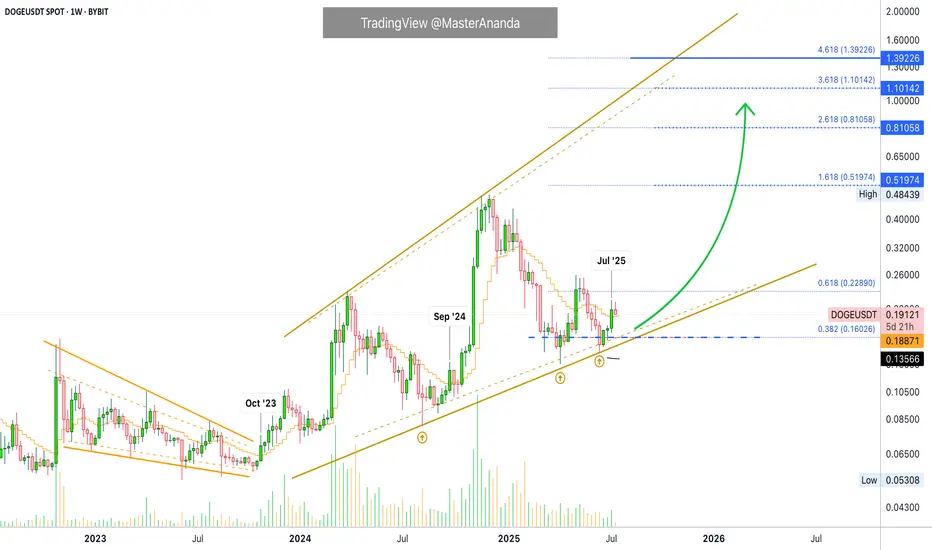
Dogecoin Mid-Term & Long-Term Targets · Advanced Trading TipsNotice here the same price dynamics we just saw with Cardano, the exact same:
» Dogecoin is now on the fourth consecutive green week.
» Dogecoin closed last week above EMA89 on a full green candle.
» Dogecoin is in a rising trend since August 2023 but the market bottom happened in June 2022 rather than 2023. A small variation compared to Cardano but these projects are in the same group, big capitalization, and they tend to move together. What one does, the rest follows.
The situation right now is really really good for this pair. Notice that Dogecoin is not only trading above EMA89 but also above MA200. This confirms that we will experience growth long-term.
The yellow targets are the intermediary targets while the blue ones are long-term. The minimum price Dogecoin will reach in this rise is $1.16. This is based on the long-term, the last all-time high, the previous bull market and the broader cycle. Now, it can definitely move much higher but we start with a strong target that has a high probability of success. Depending on how this level is handled, we can aim higher.
For example: I will always be here sharing charts. If at one point the market goes nuts and you need an update, just leave a comment or send me a message and I will look at the chart and share information based on the present day. Market conditions can always change.
Right now we have to make some wild speculations, still educated guesses but as the bull market is more advanced, we will know with a high level of certainty how far up each pair will go. That is because certain pairs tend to move ahead of the pack, look at FUNUSDT as a good example. It has been moving straight up.
An interesting bit of data. 5-May DOGEUSDT produced its last peak. Some altcoins are already trading above their May's high. This simply means that related pairs, those that move in a similar way, will do the same. This signal works as bullish confirmation, it means Dogecoin will continue to grow, with a high level of certainty, we know this based on price action, the chart and marketwide action.
You can use leverage on this setup even now as long as your liquidation is below MA200 to be safe. Very low leverage because it is already moving. If you do higher you are gambling. If you want to gamble that is also ok but we prefer trading: Low risk vs a high potential for reward and high probability chart setups.
The next leg up is already confirmed. We are moving up within days. The bullish action is already happening, it is already live; four consecutive weeks going up/green. Knowing this, we know the 5th, the 6th weeks and so on are composed of major bullish momentum.
Adapt now. Do whatever it takes, whatever you have to do to maximize profits. Opportunities are endless of course.
While it still early for this and many other pairs, there are some that have even less risk, trading at true bottom and the market will continue to have variations for all types of traders.
You can do great in this cycle.
Never take action on an impulse.
If an idea cannot wait a few hours to be implemented or a few days, then just let it go.
A true, valid and valuable idea will be valid even after the initial rush. They tend to come when everything is calm. If you get impulses when excitement is building up, hype and all that, sit, watch and relax, a shakeout can develop. If you feel like going in now hard, then go ahead, right now nobody is excited and nobody is hyped-up, this means that the market is rising and the bullish bias is confirmed. Only when we are approaching a crash everybody will start talking about forever more. When the market is good and low, nobody cares... If you do, you are already an expert.
Namaste.
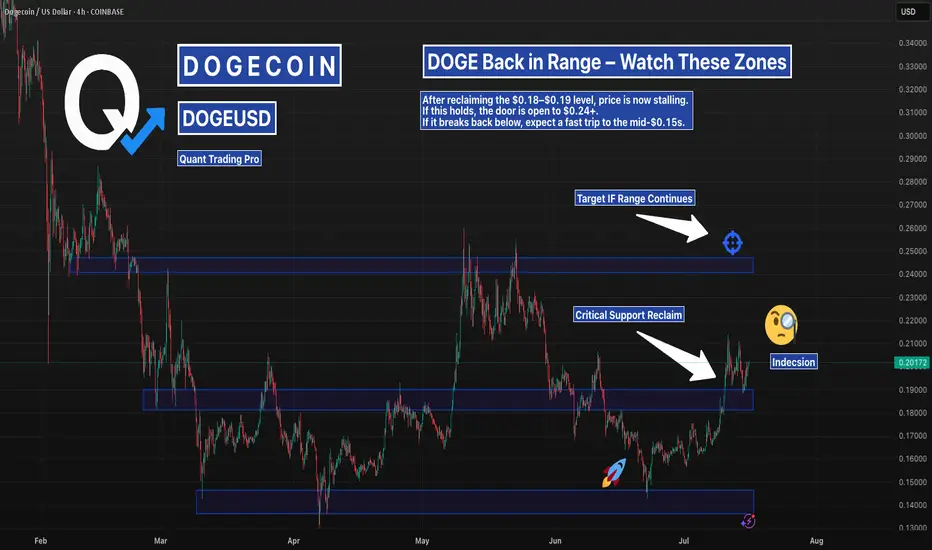
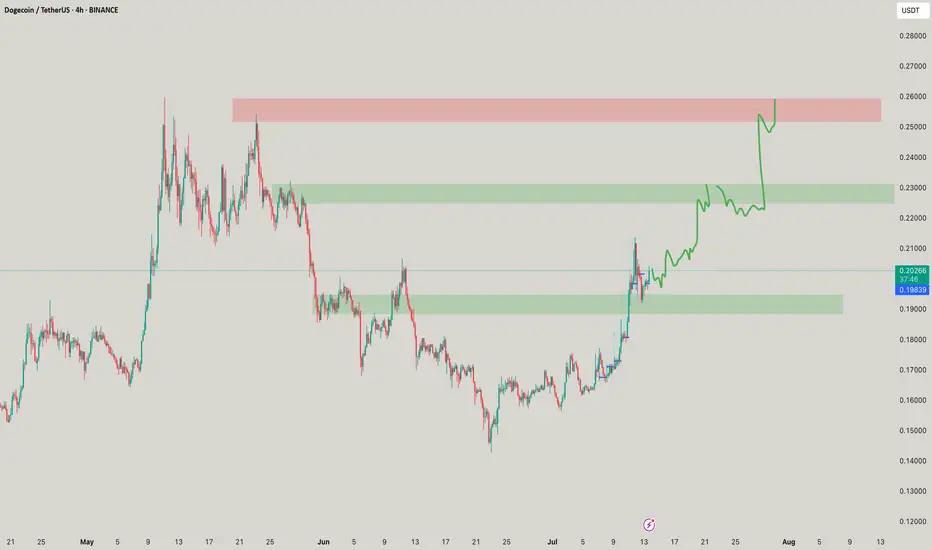
DOGEUSD – Reclaimed Key Support | Range to Continue?DOGE reclaimed the mid-range support zone at $0.18–$0.19 — a previous launch point from early May. Price is now testing this level for confirmation.
If this area holds, the path to $0.24 is back on the table.
Break back inside? Could see a fast drop to $0.15 support.
#DOGEUSD #Dogecoin #Crypto #SupportResistance #QuantTradingPro #TradingView

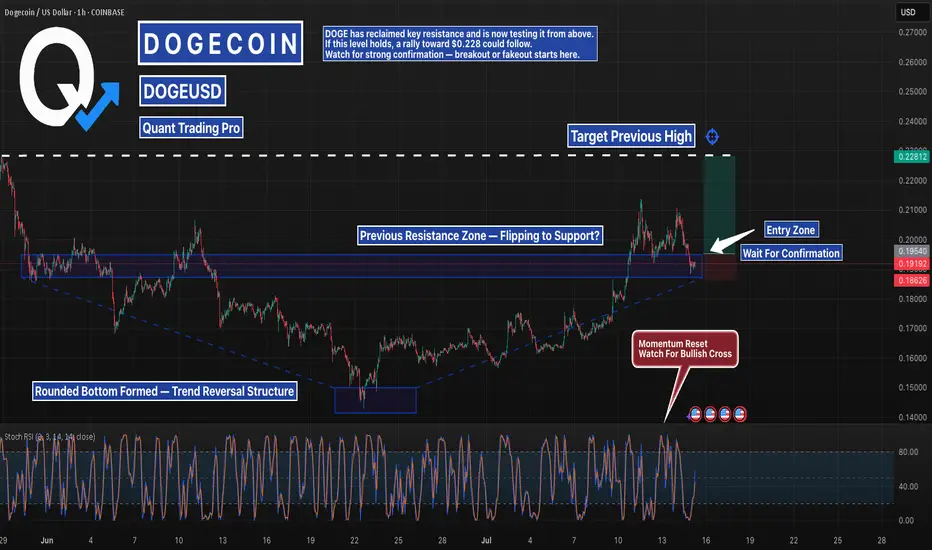
DOGE Retesting the Breakout: Bounce or Breakdown Coming SOON?DOGE has reclaimed key resistance and is now retesting it from above, following a textbook rounded bottom breakout. With Stoch RSI resetting and trend structure still intact, bulls are looking for confirmation before the next move.
If this zone holds, the path toward $0.228 opens up. But without a clean bounce, the setup weakens. Confirmation is everything — don’t front-run the signal.
#DOGEUSD #CryptoTrading #AltcoinSetups #BacktestYourEdge #QuantTradingPro #TradingView #BreakoutRetest
DOGe : BTC look at those indicators ! Holy crap that’s the strongest bullish trifecta of analysis I have seen in a minute!
Check the golden glory hole cross on the RSI at the bottom!
Check the MACD primed to rip up top too
And for the trifecta… I’ll post an update with the fractal / harmonic pattern pripegation… pls hold.
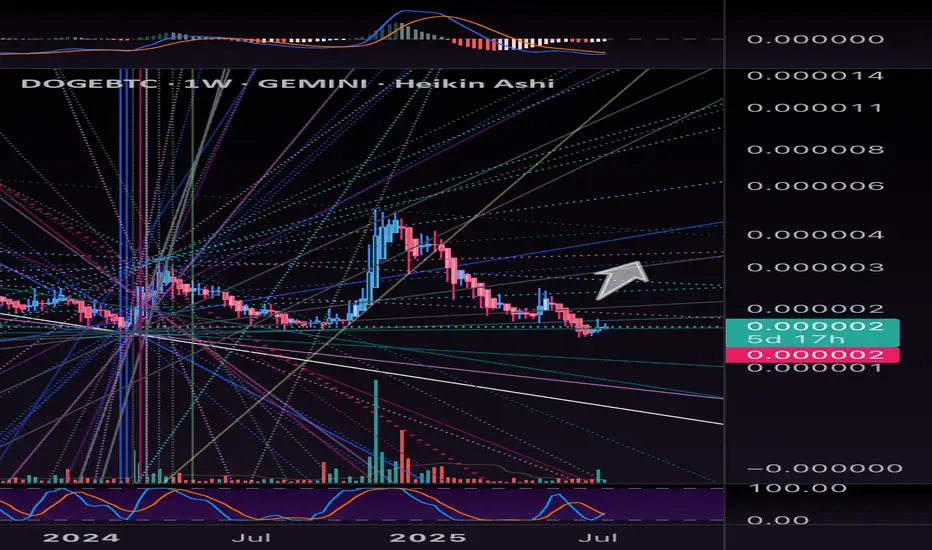
Dogecoin's Bullish Wave Over? Higher High Beyond $1.11111Nope, it is only getting started... Do you see that tiny speck of a black line on the chart? Way below the current candles around 0.135. That's MA200 weekly. Dogecoin is on the bullish zone 100% already confirmed. The bullish wave is only getting started.
DOGEUSDT is trading weekly above EMA13. Watch what happened in September 2024 when Dogecoin broke above this level. Or further back, October 2023. Both instances, there was a bullish impulse; both instances, a higher high.
Dogecoin moved and closed above EMA13 last week, July 2025. Guess what will happen next? A new bullish impulse and a strong higher high.
Patience is key, the market is set to continue growing long-term. No, the uptrend is not over, it is only getting started.
Thanks a lot for your continued support.
Namaste.
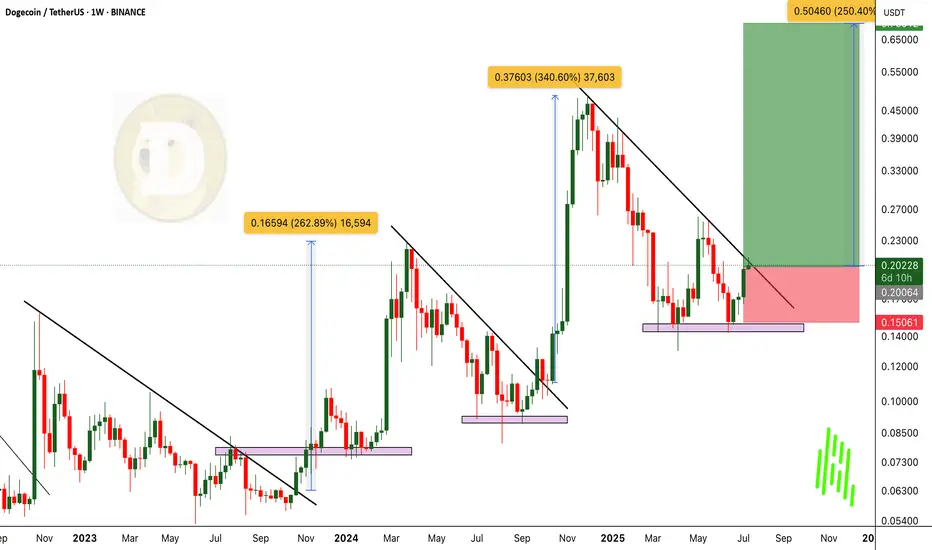
DOGEUSDT Breaking Out. 250% Rally Incoming? History Says Yes!BINANCE:DOGEUSDT is once again showing its classic breakout behavior, This time breaking above a key trendline with strong momentum. Historically, every time CRYPTOCAP:DOGE has broken out of similar structures, it has delivered powerful rallies averaging around 250% gains. And with the current bullish sentiment across the market, this setup looks ready to repeat history.
CRYPTOCAP:DOGE still appears undervalued, especially considering the broader market is already heating up. Once CRYPTOCAP:DOGE starts its move, it tends to run fast and hard – often leaving latecomers behind. This could be the start of the next explosive leg up.
For investors, this is a prime “BUY and HOLD” zone. For traders, this is the time to enter with proper risk management in place. Always use a stop loss and trail your profits accordingly.
BINANCE:DOGEUSDT Currently trading at $0.204
Buy level : Above $0.2
Stop loss : Below $0.15
Target 1: $0.27
Target 2: $0.35
Target 3: $0.48
Target 4: $0.7
Max leverage 2x
Always keep stop loss
Follow Our Tradingview Account for More Technical Analysis Updates, | Like, Share and Comment Your thoughts
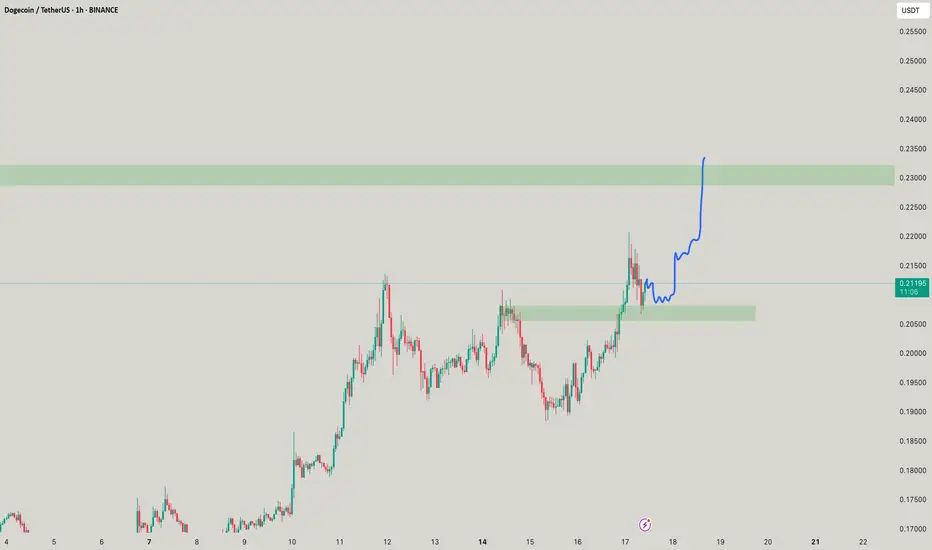
DOGE/USDT | Cup and Handle Breakout Setup – Swing Trade IdeaThis is my first post here, and I'm truly excited to begin this journey of learning, sharing, and growing as a trader with all of you.
📈 I'm currently tracking DOGE/USDT and noticed what looks like a classic Cup & Handle formation developing on the 4H chart. I've marked out the structure, potential breakout zone, and my own thoughts on the setup (entry, SL, and TP).
I'm sharing this not as financial advice but as part of my learning and analysis process, and I wholeheartedly welcome your feedback, thoughts, or alternate views — this is how we all get better together. 🙏
🧠 Trade Idea – Cup & Handle Breakout on 4H Chart
I'm observing a clean Cup and Handle pattern forming on the DOGE/USDT 4H timeframe.
Cup formation is smooth with rounded structure
Handle completed with a slight consolidation/pullback
Price is now testing the breakout zone between $0.207–$0.214
A confirmed breakout and candle close above these levels could open the door for a strong move toward TP near $0.246
📌 Trade Plan
Entry Zone: Above $0.2145 (confirmation breakout)
Stop Loss: Below $0.1924
Take Profit (TP): Around $0.2468
Risk/Reward: Roughly 1:2.5 depending on exact entry
⚠️ Disclaimer:
This is not financial advice. Please do your own research (DYOR) before making any decisions. Markets are unpredictable, and this post reflects just an idea and my personal analysis — it could work out or completely fail. Manage your risk wisely!
Let’s keep the community friendly, helpful, and focused on growing our collective trading knowledge. 💬📚
Wishing you all green candles and strong confirmations!
– Cheers, and happy trading! 🚀🔥

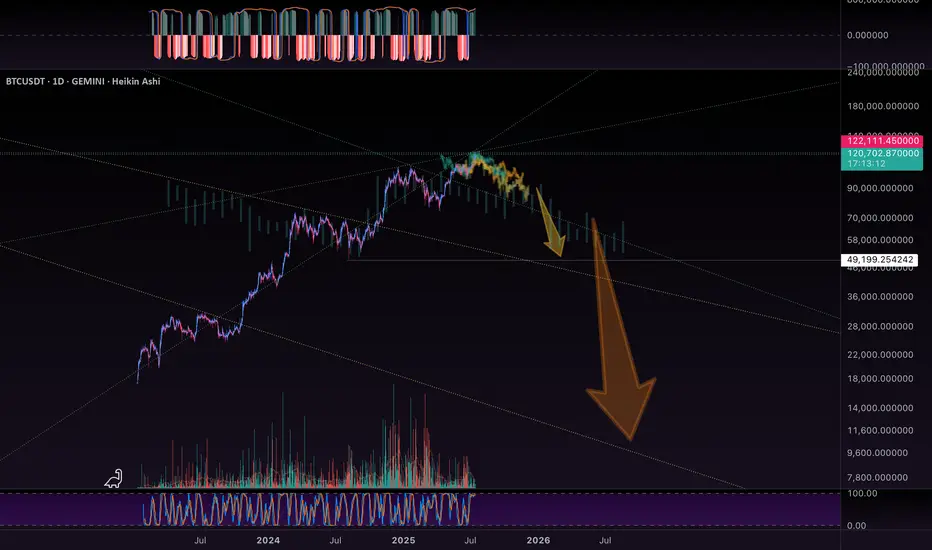
BTC - Historic Levels to CheckBTC has some checking in to do…. On historic resistance levels…
I drew in the major ones visible on this chart… and the initial bearish fractal, which was shown to us previously int he chart.
It will fractal for each arrow.
Pump and Dump!
Im going to run my DOGe.
See my linked post below for a bigger picture view of all this.
DOGE! _ RISK it ! Get itSince ages! Ive never seen such beautiful movement of charts and so is doge, lots of liquidity to get captured! Hopefully it gets done as I marked!

DOGE - Running your DOG.These traces represent a few of the prominent behaviors we would expect to see from our beloved DOGe.
As you can see, the orange traces Bearish leg leading into this is fit is much larger than our actual moves… indicating the Bulls are gaining strength. This pattern is matched harmonically to the relevant expansion / contraction patterns, and signature moves. Harmonically… in time. Shifted, in amplitude.
Blue trace is the bull run fractal we would expect to see propagate from the initial moves in this run. As we scale this trace to fit, it gains amplitude, indicating a strong bullish favor, and showing the chorus for an exponential run, as it continues to propagate.
DOGe is famous for its huge runs.
DOGe also assimilates unconditional LOVE… that humans share with DOG’s. Loyalty too…
As such, we expect DOGE to avoid any major corrections or market collapse sell offs. It’s like the emotional safe haven in the games of Fear vs Greed that is all other coins.
Also… check out the longer range analysis linked below. It’s a look at the 2W candle, and the all time chart… 10 years of data!
Let’s Go, Boy!
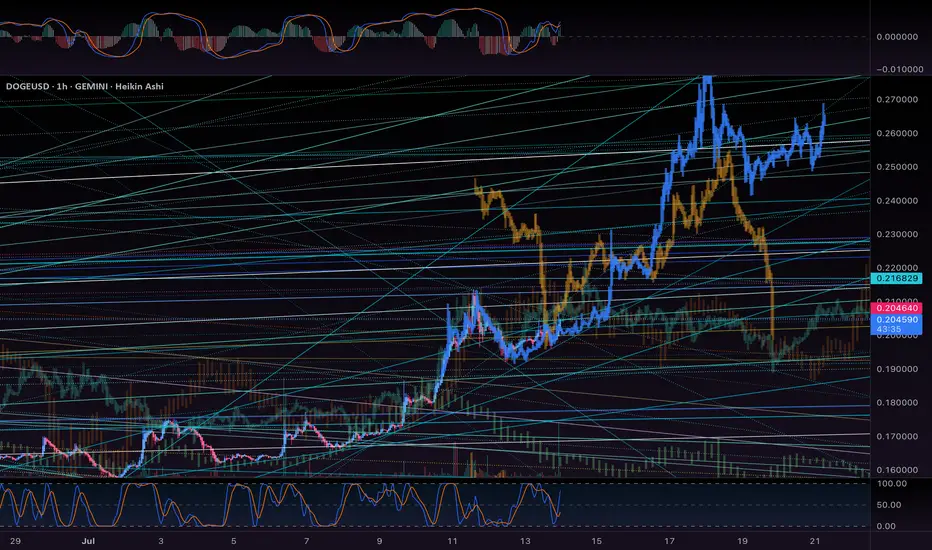
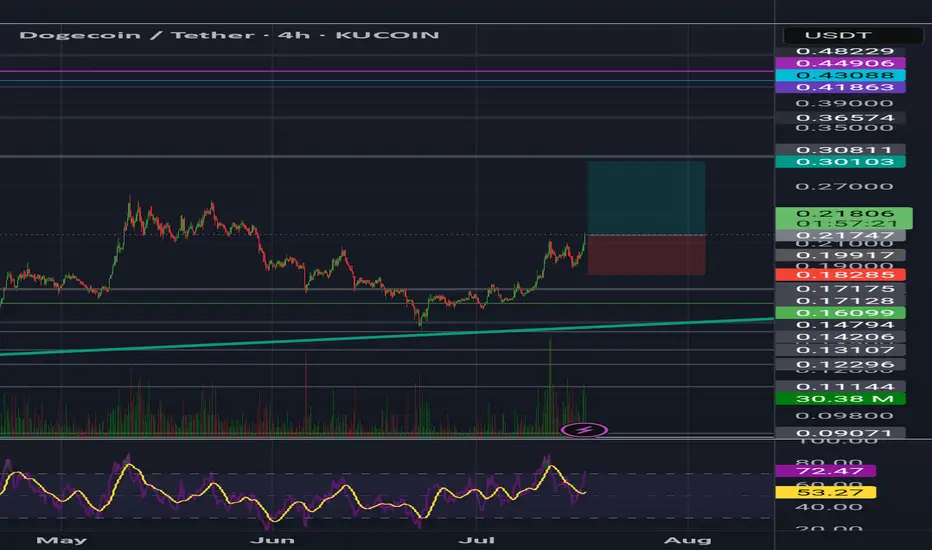
Check if there is an upward breakout of 0.21409-0.22958
Hello, traders.
If you "Follow", you can always get the latest information quickly.
Have a nice day today.
-------------------------------------
(DOGEUSDT 1D chart)
HA-High and HA-Low indicators are converging.
Accordingly, if it breaks through the 0.21409-0.22958 section, it is expected to surge.
However, since the DOM(60) indicator is formed at the 0.46635 point, we need to look at how the DOM(60) indicator is newly created.
It seems possible that the DOM(60) indicator will be newly created while shaking up and down in the 0.21409-0.31600 section, which is the HA-High indicator ~ DOM(60) indicator section of the 1M chart.
If the DOM(60) indicator is newly created, we need to check whether it is supported in the HA-High ~ DOM(60) section.
If it rises above the HA-High ~ DOM(60) section, it is likely to show a stepwise upward trend.
-
To summarize the above, it is as follows. - Buy range: 0.16343-0.22958
- Resistance range: 0.31600-0.37778
If the price breaks through the resistance range upward and maintains, there is a high possibility that the upward trend will continue in the medium to long term.
-
Thank you for reading to the end.
I hope you have a successful transaction.
--------------------------------------------------
- Here is an explanation of the big picture.
(3-year bull market, 1-year bear market pattern)
I will explain the details again when the bear market starts.
------------------------------------------------------

DOGE to the RESCUE!I know most have got liquidated but domge is to the rescue! The red box is the final target one can get it and to be precise can hit the targets as stipulated!
BTC crash to 50kLooks like the top is in!
This should propagate into a nice bear run.
Crypto community got BTC to 100,000$
That’s the PUMP
Then the ETF opens the flood gates for corrupt / corporate money supply… that’s the DUMP signal!
Take their money and run!
Where to? Maybe the park… I’m gonna run my DOGE!

DOGE's Situation, A Comprehensive Analysis !!!The price on the 3D timeframe is within an ascending triangle, which can be promising. If the price breaks this pattern with bullish candles, it could easily rise by the distance of AB=CD .
Best regards CobraVanguard.💚

DOGE's Situation, A Comprehensive Analysis (1h) !!!The price on the 1-hour timeframe is within an ascending triangle, which can be promising. If the price breaks this pattern with bullish candles, it could easily rise by the distance of AB=CD .
Best regards CobraVanguard.💚

Dogecoin Prepares 2025 Bullish Wave · New All-Time HighThe last time that Dogecoin produced strong bullish action was November 2024, more than 217 days ago. Before this wave, there was a small period of growth in early 2024 and that's about it, the market was bearish for a long-time after the 2021 all-time high. There is good news though. Dogecoin is preparing for a new major bullish cycle and this cycle is already in place.
Since mid-March 2025 the action has been weak. No growth but no decline either. Between May and June, there were more than 8 weeks of bearish action but Dogecoin's price remains strong within a mid-term higher low. The last three weeks have been green with this week being full green trading at the top of the candle, the market is about to produce a major advance.
If you look back to October 2024, late, you will see small candles then several huge big candles, maximum growth. That's how Crypto tends to operate. One day the market is silent, the next day we are witnessing the strongest ever bullish wave. This is what Dogecoin is getting into right now.
If you look back to early 2021 it is the same. Late March and early April 2021 we have very small candles and then everything changes suddenly and the market produced astonishing growth. We are on the verge of such an event, the 2025 bull market phase and bull run. Get ready and prepare for a new all-time high.
Namaste.
