DOGE/USDT – Is Dogecoin About to Ignite Altseason Again?Hey Traders!
If you’re finding value in this analysis, smash that 👍 and hit Follow for high-accuracy trade setups that actually deliver!
Dogecoin just broke out of a multi-month descending wedge — and history tells us to pay close attention when this meme king wakes up. Let’s dive into why this setup could be the start of something massive.
📈 Chart Pattern
DOGE has been consolidating for months inside a falling wedge — a classic bullish reversal structure. It’s now finally broken out with strong volume confirmation, holding above the 50 EMA and showing signs of momentum building up.
🔍 Historical Clue
Remember what happened in the previous bull markets?
✅ 2021: DOGE exploded 2000%+ and triggered the craziest altseason ever.
✅ 2017: DOGE moved first, followed by hundreds of altcoins rallying massively.
Now, in 2025 — it looks eerily similar. Every time DOGE wakes up, it signals that retail and meme sentiment is heating up, a classic altseason ignition.
🎯 Trade Setup
Entry: $0.198 (Already triggered)
Targets:
TP1: $0.28
TP2: $0.42
TP3: $0.64
Stoploss: $0.162
Risk-Reward: Massive upside potential, with clearly defined invalidation.
💡 Final Thoughts
Altcoins are starting to follow. ETH has broken out. XRP is running. BTC dominance has rejected trendline resistance. Everything is aligning. If history repeats, this breakout in DOGE could mark the official start of Altseason 2025.
👉 Don’t sleep on DOGE. This might just be the trigger we’ve been waiting for.
📌 Follow for more setups & insights. Stay tuned!
Doge

BTC Peak forecastedHI,
This is the weekly candle on BTC… showing in orange, a likely topping fractal, which would also likely propagate into something more like the dark orange, as we seek historic resistance levels to test for support.
As an interesting side note… i see DOGE coin as showing increasing strong bullish signals, which could indicate we are in the much prophecized decoupling of the DOGE-BTC pair… which will be a spectacular transfer of wealth from the dying giant to the intrepid coin of unconditional love! Thats what Dog’s represent… and it’s how the tribe feels about their coin too.
Biggest pump and dump of all time… the crypto geeks Pump btc, get the military dark money to buy in, and then dump it… empty bag. And where are they moving their money too? The favorite alt coins… and DOGE moves the biggest and fastest when it jumps and runs!
Good Luck!

DOGE started its final rally. Don't miss it.Dogecoin (DOGEUSD) has been trading on a Bullish Megaphone pattern within a Channel Up. The recent (June 16 2025) rebound on the 1W MA200 (orange trend-line) is a Higher Low at the bottom of both patterns.
With the 1W RSI also rebounding on its long-term Support Zone, Doge is most likely at the start of the new Bullish Leg, which could be the final rally that will shape this Cycle's Top.
As the previous two Bullish Legs peaked on the 3.618 Fibonacci extension of the last decline, Doge is technically targeting $1.2500. If you (naturally) wish to pursue a Target within the Channel Up though, you can settle for $0.800.
-------------------------------------------------------------------------------
** Please LIKE 👍, FOLLOW ✅, SHARE 🙌 and COMMENT ✍ if you enjoy this idea! Also share your ideas and charts in the comments section below! This is best way to keep it relevant, support us, keep the content here free and allow the idea to reach as many people as possible. **
-------------------------------------------------------------------------------
💸💸💸💸💸💸
👇 👇 👇 👇 👇 👇

Is DOGE About to Explode or Collapse?Yello Paradisers! Are you ready for what could be DOGE’s most explosive move in weeks? DOGEUSDT is currently developing a very interesting bullish setup that deserves attention.
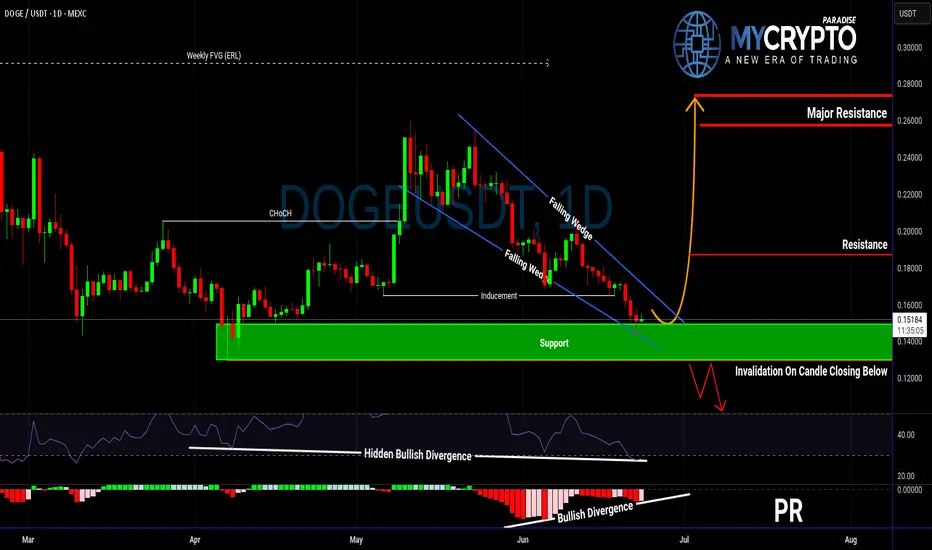
💎The pair has formed a falling wedge — a pattern that often precedes a breakout to the upside. This comes right after a confirmed bullish Change of Character (CHoCH), indicating that buyers are quietly stepping back in.
💎Even more important, we’ve seen a classic inducement grab, meaning early liquidity has been taken out, clearing the way for a potential real move. On top of that, there’s hidden bullish divergence on the RSI and clear bullish divergence on the MACD. This combination of signals significantly increases the probability of a bullish reversal from the current support zone.
💎If DOGE prints a convincing bullish candlestick pattern at these levels, it could offer a high-probability long opportunity with a strong risk-to-reward ratio. But be careful — if the price breaksdown and closes candle below this key support, the bullish scenario becomes invalid, and it’s better to wait for a more favorable structure to develop.
Strive for consistency, not quick profits. Treat the market as a businessman, not as a gambler. This is the only way you will make it far in your crypto trading journey. Be a PRO.
MyCryptoParadise
iFeel the success🌴
Dogecoin Will Shock Investors With Its Next Move!Today I’m doing an in-depth analysis of Dogecoin and its market cycle in comparison to the early Bitcoin cycles. As you can see, the same human psychology and emotions are playing out in the Dogecoin market that we previously saw with Bitcoin. With mass adoption coming to the cryptocurrency markets, it’s very possible we’ll see a parabolic run on Dogecoin similar to what we saw with Bitcoin in 2016 and 2017. This could lead us to a new all-time high.
Because markets are fractal in nature, we see similar patterns appearing over and over again. If you can learn to understand and identify these cycles and patterns, you can position yourself for maximum profit. I see Dogecoin running very bullish through the rest of 2025, and it could also continue into 2026 as mass adoption drives increasing demand for cryptocurrencies. In fact, we could see the entire crypto market run all the way into 2029, as the stock market is also primed for a large parabolic move in its own cycle.
Stocks and crypto are heavily correlated since both are tied to the global economy. Contrary to popular belief, the world economy may actually be set up for a massive run in value—almost like a “Roaring 20s 2.0.” This means buying Dogecoin today could be like buying Bitcoin in early 2016—the opportunity for profit is enormous.
As always, stay profitable.
- Dalin Anderson

#DOGE/USDT Long Swing Setup #DOGE
The price is moving within a descending channel on the 1-hour frame, adhering well to it, and is on its way to breaking it strongly upwards and retesting it.
We have a bounce from the lower boundary of the descending channel, this support at 0.1660.
We have a downtrend on the RSI indicator that is about to break and retest, supporting the upside.
There is a key support area in green at 0.16200, which represents a strong basis for the upside.
Don't forget one simple thing: ease and capital.
When you reach the first target, save some money and then change your stop-loss order to an entry order.
For inquiries, please leave a comment.
We have a trend of stability above the Moving Average 100.
Entry price: 0.17120
First target: 0.17420
Second target: 0.17788
Third target: 0.18250
Don't forget one simple thing: ease and capital.
When you reach the first target, save some money and then change your stop-loss order to an entry order.
For inquiries, please leave a comment.
Thank you.

DOGE Long Swing Setup – Musk-Fueled Hype & Political BuzzElon Musk’s launch of the “America Party” is reigniting interest in his potential impact on crypto—especially Dogecoin. With his history of moving DOGE’s price, this political pivot could stir volatility and renewed upside. We’re watching for a dip into the $0.15–$0.16 zone for a possible long entry.
📌 Trade Setup:
• Entry Zone: $0.15 – $0.16
• Take Profit Targets:
o 🥇 $0.19 - $0.20
o 🥈 $0.23 – $0.24
• Stop Loss: Daily close below $0.13

Dogecoin - This is the key structure!Dogecoin - CRYPTO:DOGEUSD - has to reverse now:
(click chart above to see the in depth analysis👆🏻)
A couple of months ago Dogecoin retested the previous all time high. We have been seeing a harsh correction of about -65% thereafter. However Dogecoin still remains in a bullish market with bullish structure. In order to validate this trend, a reversal must happen now.
Levels to watch: $0.15, $0.5
Keep your long term vision🙏🙏
Philip (BasicTrading)

Much DOGE Much WOW!DOGE will caught you on the guard to eat you! Beware! You know the direction well! Its a well liq hump!

DOGE Ready for PUMP or what ?The price is within a descending triangle, which is discouraging, but this market often behaves contrary to these patterns, and it could be the start of a new price increase. I won’t fall for these patterns anymore.
Best regards CobraVanguard.💚

Dogecoin $0.1725 Next Target ? #DOGE
The price is moving within a descending channel on the 1-hour frame, adhering well to it, and is on its way to breaking it strongly upwards and retesting it.
We have a bounce from the lower boundary of the descending channel. This support is at 0.1624.
We have a downtrend on the RSI indicator that is about to break and retest, supporting the upside.
There is a major support area in green at 0.16000, which represents a strong basis for the upside.
Don't forget a simple thing: ease and capital.
When you reach the first target, save some money and then change your stop-loss order to an entry order.
For inquiries, please leave a comment.
We have a trend to hold above the 100 Moving Average.
Entry price: 0.1656
First target: 0.1682
Second target: 0.1713
Third target: 0.1752
Don't forget a simple thing: ease and capital.
When you reach the first target, save some money and then change your stop-loss order to an entry order.
For inquiries, please leave a comment.
Thank you.

Dogecoin $1.17 Next Target (591% Profits Potential)From its June 2022 bear market low, Dogecoin managed to grow more than 880% to its December 2024 peak price. The peak happened around the 0.618 Fib. extension level.
The next major level based on Fibonacci proportions in relation to the 2021 bull market/2022 bear market stands at $1.17, this would give us 591% profits potential from current price and a total of 2281% total growth coming from the June 2022 bottom. That would the total size of the bull market for Dogecoin if it peaks at $1.17, more than 23X.
Prices go up but they don't remain up. After a bullish wave there is always a correction. After a bull market there is always a bear market.
Dogecoin is now back at baseline levels but within a higher low. All the same resistance levels that were conquered in late 2024 will need to be challenged again. All these levels will break easily. The main resistance will be found at $0.59 followed by the previous, 2021, all-time high, around $0.74.
What other resistance levels are relevant if the market doesn't perform great?
I will give you the exact numbers. Below the last high $0.35 is a relevant level. Hitting new highs compared to December 2024 $0.70 needs to be watched. New ATH $1.05 and the rest of the numbers mentioned before and shown on the chart.
My guess? Above $1.00. There is no reason for the market to peak any lower.
Thanks a lot for your continued support.
Namaste.

DOGE, expanding upside pressure from 0.17 below. Targeting 0.4!DOGE had a good year last year 2024, going parabolic -- and reaching as high as 0.48.
Then as with any overheated price growth with the overall market, it went into extreme corrective mode -- trimming down as much more than 3x its price, tapping major lows at 0.14 area.
Now, based on its current long term metrics. We are now seeing some baselining action at the current price range at 0.17 area. Based on our diagram above, a hop signal has been spotted hinting of an expanding upside pressure on the present price zone.
DOGE has corrected to below bargain zone at 78.6 Fib levels. A no-brainer key area where buyers get the most discounted price. The MAJOR shift everyone is waiting for is currently transpiring this week.
Higher lows on long term momentum metrics has been registered as well -- conveying intense ascend pressure.
Ideal seed is at the current price and anything below 0.17 is a definite bargain.
Spotted at 0.169
Mid Target 0.5
Long term target 1.0
Trade safely. Market is still Market.
Not financial advice.
TAYOR.

DOGECOIN Eyes Major Breakout – Trend Channel in Controlhello guys!
doge seems potential now!
DOGECOIN has successfully broken out of a long-standing bearish trendline and is now respecting a well defined ascending channel structure.
After a clean retest of both the midline and the demand block around 0.1950–0.2150, the price is showing renewed bullish pressure. As long as price holds above this key support zone, we can expect further continuation to the upside.
what I see:
✅ Breakout of descending trendline confirmed
✅ Strong structure support from the demand block (0.1950–0.2150)
✅ Clean reaction from channel midline
✅ Momentum currently favors continuation of the bullish trend
🎯 Bullish Targets:
TP1: 0.2530 (recent swing high)
TP2: 0.2750 (channel upper boundary)
TP3: 0.3035 (major horizontal resistance zone)
🛑 Stop-loss idea: Below 0.1950 (invalidates bullish structure)

DOGE - IDEA index to my B/ september pumpWe have an instrument — DOGE — and I see a certain pattern. From one pump zone to the next, it's 14.4 cm, and this happens three times. From the high zone after these pumps, it's 15.5 cm, also three times. From the high at $0.74 to the high at $0.48, we get 40.7 cm. Similarly, from the very first DOGE pump where the mega rally began, there's also a 40.7 cm gap to the next strong pump.
After analyzing the old “Sparta” idea
I came to the conclusion that the price is being compressed within a specific range, and after some time, this range gets multiplied by a numerological coefficient. To get 444, you need to multiply 333 by 1.333. But another coefficient close to this value is 0.69 (zone) multiplied by 2, which equals 1.38.
On the chart, you can see that from the starting point we have 14.4 cm. If we apply the derived coefficient (0.69) — taken from the length of the circle — we get 20.9 cm. That is, our diameter is 14.4 cm. If we multiply it by Pi (3.14), we get the circumference: 45.2 cm. Then, we need to find the 0.69 zone, which equals 0.69π = 2.166. That means we divide 45.2 by 2.166 and get 20.9 cm. If we measure this from our first control point (from where we took the diameter), we arrive precisely at the bottom from which the trend reversal began.
Now, keeping in mind the coefficient that the cycle follows — 1.333 — if it moved exactly, it would be too obvious and there wouldn’t be the necessary chaos on the chart. Since we have more than one cycle, multiplying 0.69 × 2 = 1.38 gives us 28.8 cm, which precisely points to the high formed at $0.23.
You might not believe me or understand, but these are facts. I’ve provided you with the chart — you can verify everything yourself.
What does this give us?
This provides us with valuable information about how the trend develops after the strongest initial pump of the instrument, allowing us to capture all the movements by trading within a channel using complex percentages and taking massive % gains.
What do we need to do? Let’s repeat:
Study the distance from the lows before the pump to the next low right before the next pump (in cm).
Then we carry this same cycle backward to confirm its validity in the past and again forward — that will be the main one from which strong growth begins.
From the measured value (in cm), we take it as the diameter and multiply by Pi to get the circumference, which helps us understand what might come in the future.
We trade the 0.69 zone or 69%, whichever is easier for you. To find this zone, divide the circumference by 2.166.
Then multiply the result by the coefficient 1.333 or 1.38 — this will show us the final zone of growth or decline.
This math can also be applied not only to centimeters but to time bars. For example, if from one low to the next is 492 days, you can use the same formulas to extract valuable insights.
So, what’s next for DOGE?
If the zones I’ve already mentioned have occurred, how do we trade the future?
When we extend the diameter — that is, the 14.4 cm cycle in our case — we do this three times. Pi is 3.14, so obviously:
14.4 × 3 = 43.2
Our Pi value is 45.2.
That means 2 cm to the right will be the low before strong growth. This falls around September 1st, give or take — meaning sometime within the first two weeks of September a strong rally should begin, with acceleration in late September 2025.
I came to all these conclusions after 2 hours of work and recently developed this linear strategy — or more precisely, I had a breakthrough on it — so I expect a lot more will be added as I continue writing the book.
I also realized something else: remember the correlation between the highs and the strong pumps at 40.7 cm? We apply the same formula:
40.7 / 2.166 = 18.8
Which precisely points to the low before the pump.
Then we take:
(40.7 / 2.166) × 1.38 = 26 cm
Which also points to the same low as the 20.9 cm from the beginning of the 14.4 cm diameter.
An incredible mathematical correlation found using the formula I discovered.
To back up my words, I will index this idea and publish this excerpt on TradingView so it’s visible and verifiable. I hope the idea plays out, and that DOGE forms a local bottom in early September, followed by strong growth with acceleration at the end of September.
To be clear, I just described how the internal structure works — and it is only Pi that points directly to the strong September rally. Let's see what happens.

DOGE/USDT Rebound from Key Demand Zone! Bullish Rally Incoming?
🔍 Technical Analysis Overview:
1. Strong Demand Zone (Support Area):
DOGE has just bounced off a strong demand zone around $0.15000 – $0.16318, which previously acted as a significant accumulation area (highlighted in yellow). This signals a potential trend reversal from bearish to bullish.
2. Bullish Bounce Confirmation:
Price action is forming a potential "higher low" in this support area, indicating the early signs of a bullish structure.
3. Key Resistance/Target Levels: If momentum continues, DOGE could target the following resistance zones:
📍 $0.19637 – Initial minor resistance.
📍 $0.21000 – Previous consolidation area.
📍 $0.24911 – $0.31170 – Mid-term targets.
📍 $0.41583 – $0.48432 – Major resistance zone for long-term rally.
4. Short to Mid-Term Outlook:
The price is showing signs of a potential "V-shaped recovery." The yellow arrow suggests possible minor pullbacks before a continued bullish move toward higher resistance zones.
💡 Potential Strategy:
Entry: Look for re-entry opportunities on a retest of the $0.16 – $0.18 zone with bullish candle confirmation.
Stop Loss: Below $0.15000 (key invalidation level).
Take Profits: $0.196 – $0.249 – $0.311 – $0.415 (ladder out positions).
🚀 Conclusion:
DOGE is currently in an exciting technical setup, rebounding from a major demand zone with a strong potential for a bullish trend reversal. If volume supports and broader crypto sentiment improves, a strong upside rally could be in play in the coming weeks.
#DOGE #Dogecoin #DOGEUSDT #CryptoAnalysis #TechnicalAnalysis #Altcoins #CryptoTrading #Breakout #SupportAndResistance #BullishReversal

DOGEUSD: $1.100 is the minimum target.Dogecoin is bearish on its 1D technical outlook (RSI = 37.555, MACD = -0.00967, ADX = 29.193), suggesting that it is heavily undervalued in relation to the position it has during the same stage of the previous Cycles. All Cycles have smashed through the top red Mayer Multiple Band before pricing the Top. This means that by the end of the year, we can expect at least $1.100 for Doge (current projection of the Top Mayer Band).
## If you like our free content follow our profile to get more daily ideas. ##
## Comments and likes are greatly appreciated. ##

Doge H4 | Overlap resistance at 50% Fibonacci retracementDoge (DOGE/USD) is rising towards an overlap resistance and could potentially reverse off this level to drop lower.
Sell entry is at 0.1726 which is an overlap resistance that aligns closely with the 50% Fibonacci retracement.
Stop loss is at 0.1930 which is a level that sits above a pullback resistance.
Take profit is at 0.1494 which is a swing-low support.
High Risk Investment Warning
Trading Forex/CFDs on margin carries a high level of risk and may not be suitable for all investors. Leverage can work against you.
Stratos Markets Limited (tradu.com ):
CFDs are complex instruments and come with a high risk of losing money rapidly due to leverage. 63% of retail investor accounts lose money when trading CFDs with this provider. You should consider whether you understand how CFDs work and whether you can afford to take the high risk of losing your money.
Stratos Europe Ltd (tradu.com ):
CFDs are complex instruments and come with a high risk of losing money rapidly due to leverage. 63% of retail investor accounts lose money when trading CFDs with this provider. You should consider whether you understand how CFDs work and whether you can afford to take the high risk of losing your money.
Stratos Global LLC (tradu.com ):
Losses can exceed deposits.
Please be advised that the information presented on TradingView is provided to Tradu (‘Company’, ‘we’) by a third-party provider (‘TFA Global Pte Ltd’). Please be reminded that you are solely responsible for the trading decisions on your account. There is a very high degree of risk involved in trading. Any information and/or content is intended entirely for research, educational and informational purposes only and does not constitute investment or consultation advice or investment strategy. The information is not tailored to the investment needs of any specific person and therefore does not involve a consideration of any of the investment objectives, financial situation or needs of any viewer that may receive it. Kindly also note that past performance is not a reliable indicator of future results. Actual results may differ materially from those anticipated in forward-looking or past performance statements. We assume no liability as to the accuracy or completeness of any of the information and/or content provided herein and the Company cannot be held responsible for any omission, mistake nor for any loss or damage including without limitation to any loss of profit which may arise from reliance on any information supplied by TFA Global Pte Ltd.
The speaker(s) is neither an employee, agent nor representative of Tradu and is therefore acting independently. The opinions given are their own, constitute general market commentary, and do not constitute the opinion or advice of Tradu or any form of personal or investment advice. Tradu neither endorses nor guarantees offerings of third-party speakers, nor is Tradu responsible for the content, veracity or opinions of third-party speakers, presenters or participants.

It's disappointing !!!Do you think this will happen, or do you see DOGE below $0.14 in the future?
Best regards CobraVanguard.💚

DOGE ANALYSIS (12H)Based on the current available data, it appears that Dogecoin has entered a bullish phase after completing the diametric pattern marked on the chart. We are currently in wave B of this bullish phase.
Wave B may complete within the green zone, which is a key support area.
The targets for wave C have been marked on the chart.
A daily candle closing below the invalidation level would negate this outlook.
For risk management, please don't forget stop loss and capital management
Comment if you have any questions
Thank You

Doge Long SetupDoge has successfully changed it's downtrend to uptrend with heavy volume, Waiting for a potential retest at 0.1590 area then we are good to go towards our MASSIVE target in the coming days.
DOGE Free Call
Longing Now: 0.1590 - 0.1640
Tp: 0.1980
Sl: 0.13445
It will take few days to fully play out.
Do your own research before taking any entry.

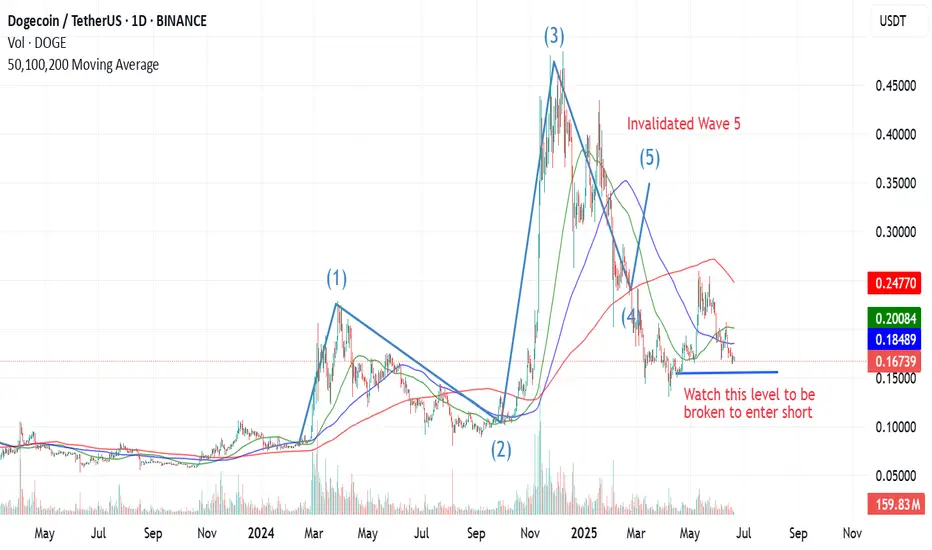
Elliot Wave Analysis for Doge - Bearish TrendLets analyse Doge on 1D timeframe since Feb 2024.
Wave 1 - It reached a high of 0.23 from a bottom price range of 0.084.
Wave 2 - Corrective wave take the prices back to 0.08 in Aug - Sep 24.
Wave 3 - As per theory should be the strongest and it proved to be one, taking the price to 4 year high of 0.4843.
Till now everything was fine and the next corrective Wave 4 started which as per classical Elliott Wave theory, should never enter the price territory of Wave 1.
Wave 1 high was 0.2288 however if we see the current price 0.168 (Wave 4), it already has invalidated the previous wave.
So now if we re-evaluate -
The run from 0.084 to 0.4843 was a Zigzag A-B-C Pattern with A marking as 0.2288, B as 0.08 and C = 0.4843. So seems we are in a complex correction phase and can see prices move down to previous lows or even lower.
So for now be patient and watch the prices between $0.168–0.182, if it reclaims $0.228–0.245, then we can consider entering a Long.
A breakdown below 0.154 can cause a lot of trouble for Bulls.
Trade Safely!
Thanks!
Where Most See Resistance, Smart Money Sees OpportunityDOGE is currently hovering around the 0.382–0.5 Fibonacci retracement zone after a reactive bounce from 0.618 (0.16784) — a critical discount level. Most traders panic at these levels, but experienced participants know this is the zone where price builds intention.
Here's the breakdown of the structure:
Price tapped into the 0.618 Fibonacci level (0.16784) and began showing signs of recovery — a typical Smart Money accumulation zone.
The next target is 0.17042, aligning with the 0.236 retracement level, followed by 0.17151, where previous supply might get mitigated.
Potential retracements are possible, but as long as price holds above 0.16670 (0.786), the bullish structure remains intact.
Execution strategy:
Entry (Accumulation Zone): Between 0.16784 and 0.16864
Invalidation: Break below 0.16600 would weaken the bullish case
Upside targets:
• TP1 → 0.17042
• TP2 → 0.17151
• Extension possibility beyond 0.17204
This move appears to be a classic premium-delivery setup — a structural reset, not a collapse. Smart Money steps in quietly when retail panic takes over. If you're trading DOGE like a pro, focus on levels, not emotions.
Let me know if you'd like this converted into a tweet format or turned into a technical newsletter paragraph.
