Dogecoin $0.1725 Next Target ? #DOGE
The price is moving within a descending channel on the 1-hour frame, adhering well to it, and is on its way to breaking it strongly upwards and retesting it.
We have a bounce from the lower boundary of the descending channel. This support is at 0.1624.
We have a downtrend on the RSI indicator that is about to break and retest, supporting the upside.
There is a major support area in green at 0.16000, which represents a strong basis for the upside.
Don't forget a simple thing: ease and capital.
When you reach the first target, save some money and then change your stop-loss order to an entry order.
For inquiries, please leave a comment.
We have a trend to hold above the 100 Moving Average.
Entry price: 0.1656
First target: 0.1682
Second target: 0.1713
Third target: 0.1752
Don't forget a simple thing: ease and capital.
When you reach the first target, save some money and then change your stop-loss order to an entry order.
For inquiries, please leave a comment.
Thank you.
DOGEBTC

DOGE ANALYSIS (12H)Based on the current available data, it appears that Dogecoin has entered a bullish phase after completing the diametric pattern marked on the chart. We are currently in wave B of this bullish phase.
Wave B may complete within the green zone, which is a key support area.
The targets for wave C have been marked on the chart.
A daily candle closing below the invalidation level would negate this outlook.
For risk management, please don't forget stop loss and capital management
Comment if you have any questions
Thank You

DOGEUSDT BINANCE:DOGEUSDT Price is ranging between 0.18200 and 0.18650 dollars after a sharp rise from 0.17000. A break above 0.186 triggers a buy, targeting 0.19450 and 0.19950 dollars. A break below 0.182 triggers a sell, with supports at 0.17650 and 0.17000 dollars.
Trigger Levels:
Buy Trigger: 0.186
Sell Trigger: 0.182
⚠️Contorl Risk management for trades.

#DOGE/USDT#DOGE
The price is moving within a descending channel on the 1-hour frame and is expected to break and continue upward.
We have a trend to stabilize above the 100 moving average once again.
We have a downtrend on the RSI indicator, which supports the upward move by breaking it upward.
We have a support area at the lower limit of the channel at 0.1800, acting as strong support from which the price can rebound.
Entry price: 0.1838
First target: 0.1886
Second target: 0.1928
Third target: 0.1972

I positioned here — while others waited for confirmation.This was a textbook setup. Clean structure, high-probability narrative, and the kind of zone that doesn’t ask for your belief — it commands it.
Breakdown:
Price delivered a sharp move into a 1H OB confluence with an untouched 60min FVG sitting just below. That OB wasn’t noise — it was a true origin point, the last down candle before a major rally.
As price retraced, it swept short-term liquidity and tapped into that OB with precision. I watched volume spike on the drop — not retail fear, but Smart Money engineering the entry.
The 0.1795 zone wasn’t random. It was deliberate. A key equilibrium between displacement and rebalancing. And if this holds, the next logical draw is above 0.1860 — into the unmitigated FVG and resting buy-side liquidity.
Expectation:
From this 1H OB / FVG stack, I’m looking for:
Entry: ~0.1795
SL: Just under the 1.0 fib — under 0.1777
TP1: Mid FVG at 0.1831 (0.5)
TP2: Full inefficiency fill at 0.1887
I’m not forcing anything. If the market wants lower, there’s another FVG just below to absorb it — but structure still favors premium re-pricing.
Final note:
I don’t chase breakouts. I trap Smart Money setups, wait in silence — and strike when the chart gives me the story.
“The market doesn’t move by chance. It moves by design. And I design my trades the same way.”

They see relief. I see rebalancing.BINANCE:DOGEUSDT.P isn't bullish — it's rebalancing. What we’re witnessing now is price doing what it always does after manipulation: return to efficiency before delivering its next displacement.
Here’s the setup:
Price tapped into the 4H discount zone — a structural STB
We’re now reacting from the 0.618 (0.1940) and pushing up toward the 4H OB at 0.20403
That OB is perfectly nested just above the 0.5 fib (0.20190), and below the 0.382 (0.20970) — prime for internal liquidity collection
If price fails to break structure above that 4H OB, the move is complete. This isn’t bullish continuation — it’s cleanup. From there, I’m watching closely for signs of rejection and displacement back toward the OB + BTS zone near 0.16884.
This is where real risk is priced in — and where Smart Money actually loads up.
Execution mindset:
Let price reach into 0.204–0.209
Watch for rejection — that’s the trigger
Downside target: 0.18299 → 0.16884
If we impulsively break 0.2097 and reclaim it, the bearish thesis is invalidated and I’ll re-evaluate
This isn’t trading a bounce. It’s reading the cleanup.
You want real entries, real invalidations, real structure? Check the profile description. The trades speak louder than the noise.

Price tapped the discount — now it’s time to test premium.This setup on DOGE/USDT was mechanical. Not emotional.
I’ve seen this formation enough to know what comes next. The chart has already spoken.
After a clean markdown into the 4H OB, price hit the 0.786 retracement level — right inside a prior imbalance zone. That wasn’t a random drop. That was engineered. Liquidity was swept, sentiment reset, and now we have structure ready to reverse.
Notice this:
We’re sitting in a 4H demand OB with confluence from the FVG just above.
The Fibonacci levels are aligning with Smart Money delivery: 0.5 sits right at the base of the new rally expectation.
The 0.20928 level is the first key reaction point — I expect a stall or consolidation there.
But the real test comes higher: the 0.22094 OB, which also aligns with the 0.382 fib level — the market’s threshold between discount and premium.
I’ll be watching price closely on its approach into that 0.209–0.22094 region. If it delivers clean displacement through FVG, the next liquidity grab sets up a premium continuation model.
If we reject early — that tells me distribution is starting, and I’ll prep for a secondary sweep below 0.18 to retest the deeper 4H OB near 0.16387.
This setup didn’t require a confirmation signal.
It required understanding why price dropped — and where it’s designed to go.
I don’t need to guess. I just need to be aligned.

DOGE Analysis (4H)It appears that Dogecoin's correction has started from the point where we placed the red arrow on the chart. This correction seems to be a flat pattern, with the first two parts forming a diametric and a triangle.
If the price reaches the green zone | which is a key area | we can start looking for buy/long positions.
Targets : 0.23092 _ 0.25283 _ 0.29426 _ 0.32217
A daily candle closing below the invalidation level will invalidate this analysis.
For risk management, please don't forget stop loss and capital management
Comment if you have any questions
Thank You

DOGECOIN (FREE SIGNAL)Hello friends
Given the good growth we had, the price has corrected and now is a good time to buy step by step and with capital management...
We have specified the purchase steps for you and the target is also specified...
*Trade safely with us*

DOGEBTC Strong chance that Dogecoin outperforms Bitcoin soon.DOGEBTC is testing its 1W MA50 (blue trend-line), which keeps it into a buy zone, exhibiting the same kind of price action it had during its previous Cycle in late December 2020.
That was right before the parabolic rally started where Dogecoin outperformed Bitcoin massively on the last strong known Altseason.
Right now the market is forming the same 1W MACD Bullish Cross it did on December 21 2020, straight after which it broke above the 1W MA50. The rebounded that was causes even broke above the Cycle's Falling Wedge in a rally that lasted 4 months.
We are inside a similar Falling Wedge since 2021 so a break-out may have a similar outcome. This chart shows that it may be time to move some capital to Doge.
-------------------------------------------------------------------------------
** Please LIKE 👍, FOLLOW ✅, SHARE 🙌 and COMMENT ✍ if you enjoy this idea! Also share your ideas and charts in the comments section below! This is best way to keep it relevant, support us, keep the content here free and allow the idea to reach as many people as possible. **
-------------------------------------------------------------------------------
💸💸💸💸💸💸
👇 👇 👇 👇 👇 👇

DOGEUSDT - Worth to Take Some RisksBINANCE:DOGEUSDT — Buyer Stepping in After the Sweep?
BINANCE:DOGEUSDT just pulled a textbook move I’ve seen play out hundreds of times — swept a key low, triggered stops, then snapped back up. That’s never accidental.
I’ve been watching this carefully, and I believe we just entered an area with a real buyer behind it.
🔵 Blue Box: Hidden Demand Zone
Price made a new local low, then quickly reversed, printing a bullish engulfing candle on high volume — but here’s what matters more:
On the drop, CDV didn’t follow. That’s a subtle but powerful divergence that shows aggressive selling wasn't truly present — just a liquidity sweep.
Now price is hovering above that zone. This blue box is where I believe the real position was built. If we come back down and test it with weak selling and small-bodied candles, I’m looking for an entry.
🔁 Game Plan
If price pulls back into the blue box and shows buyer defense on the 1m/5m, I’ll enter long. Simple.
If we break lower again but reclaim the box with force and retest it cleanly, I’ll also long that reclaim.
No long if the zone breaks cleanly and volume confirms the breakdown — I’ll reassess for shorts only if it retests from below.
I will not insist on my long idea.
If this level gives way and doesn’t reclaim with conviction, I’ll step aside.
But if it reclaims and gives me confirmation, I’ll take it.
📊 Order Flow & Volume
This entire sweep was followed by a volume spike into the low and a delta absorption pattern — price moved down, but aggressive buyers were filling in. That’s never retail.
Now we’re seeing low effort in pushes downward. That’s when traps get set. Don’t be surprised if we see a sharp move upward in the next sessions.
🧠 Final Word
Most traders will only see a “double bottom” if this plays out. They won’t realize the liquidity grab has already happened.
If you ignore this level, you might regret it.
This is how the big moves start — quietly, after the sweep, before the crowd even notices.
And these are the setups that have built my high win rate.
📌I keep my charts clean and simple because I believe clarity leads to better decisions.
📌My approach is built on years of experience and a solid track record. I don’t claim to know it all but I’m confident in my ability to spot high-probability setups.
📌If you would like to learn how to use the heatmap, cumulative volume delta and volume footprint techniques that I use below to determine very accurate demand regions, you can send me a private message. I help anyone who wants it completely free of charge.
🔑I have a long list of my proven technique below:
🎯 ZENUSDT.P: Patience & Profitability | %230 Reaction from the Sniper Entry
🐶 DOGEUSDT.P: Next Move
🎨 RENDERUSDT.P: Opportunity of the Month
💎 ETHUSDT.P: Where to Retrace
🟢 BNBUSDT.P: Potential Surge
📊 BTC Dominance: Reaction Zone
🌊 WAVESUSDT.P: Demand Zone Potential
🟣 UNIUSDT.P: Long-Term Trade
🔵 XRPUSDT.P: Entry Zones
🔗 LINKUSDT.P: Follow The River
📈 BTCUSDT.P: Two Key Demand Zones
🟩 POLUSDT: Bullish Momentum
🌟 PENDLEUSDT.P: Where Opportunity Meets Precision
🔥 BTCUSDT.P: Liquidation of Highly Leveraged Longs
🌊 SOLUSDT.P: SOL's Dip - Your Opportunity
🐸 1000PEPEUSDT.P: Prime Bounce Zone Unlocked
🚀 ETHUSDT.P: Set to Explode - Don't Miss This Game Changer
🤖 IQUSDT: Smart Plan
⚡️ PONDUSDT: A Trade Not Taken Is Better Than a Losing One
💼 STMXUSDT: 2 Buying Areas
🐢 TURBOUSDT: Buy Zones and Buyer Presence
🌍 ICPUSDT.P: Massive Upside Potential | Check the Trade Update For Seeing Results
🟠 IDEXUSDT: Spot Buy Area | %26 Profit if You Trade with MSB
📌 USUALUSDT: Buyers Are Active + %70 Profit in Total
🌟 FORTHUSDT: Sniper Entry +%26 Reaction
🐳 QKCUSDT: Sniper Entry +%57 Reaction
📊 BTC.D: Retest of Key Area Highly Likely
📊 XNOUSDT %80 Reaction with a Simple Blue Box!
📊 BELUSDT Amazing %120 Reaction!
📊 Simple Red Box, Extraordinary Results
I stopped adding to the list because it's kinda tiring to add 5-10 charts in every move but you can check my profile and see that it goes on..

Dogecoin (DOGE) OverboughtI have been trading for a long time using the DCA strategy indicator that I have developed and I have recently published the indicator on my Tradingview page.
According to this indicator, I have been buying DOGEs at support levels with more money than I would have thrown away so far. This support level is generally seen at $0.056. In addition, I dumped some of my DOGE at $0.2285, but then bought again at $0.107. I have already shared this analysis.
I think that DOGE, which has broken through two resistances, will advance at least up to $0.75 (potential 89% return). But for this progress, I think that it must first find support at the $0.2285 level, which was broken again. This is because the indicator also gives an overbought signal. Therefore, I will tailor my portfolio accordingly. But I wouldn't be surprised if it continues relentlessly.
As long as Elon Musk remains in government, I think this cryptocurrency will be on a continuous upward trend.

Dogecoin Buy Signal: Will the Channel Break Today?Hello friends
Given the good growth we had, you can see that the price has taken a break, which can be used as a buying opportunity.
We have identified the buying steps for you to buy in steps and move to the specified goals.
*Trade safely with us*

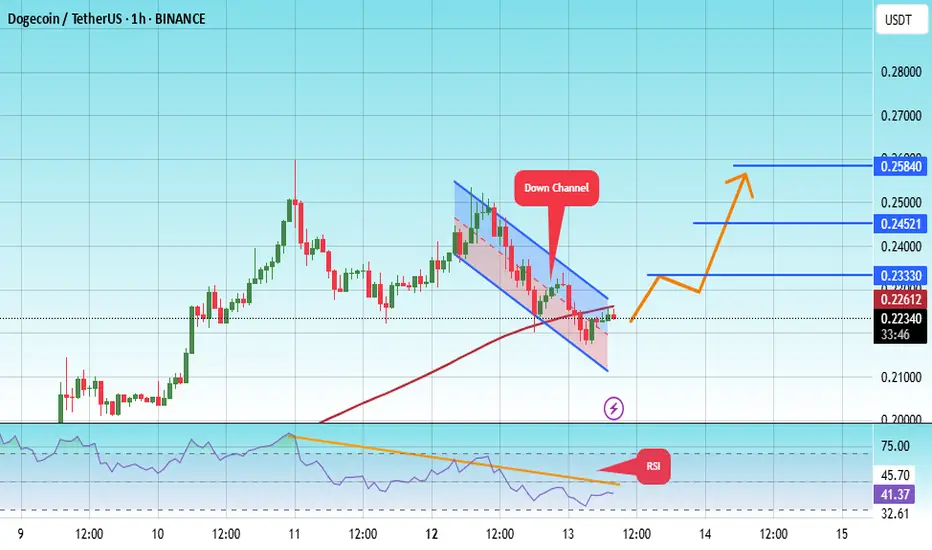
#DOGE/USDT#DOGE
The price is moving within a descending channel on the 1-hour frame, adhering well to it, and is on its way to breaking it strongly upwards and retesting it.
We are seeing a bounce from the lower boundary of the descending channel, this support at 0.2136.
We have a downtrend on the RSI indicator that is about to break and retest, supporting the upward trend.
We are looking for stability above the 100 Moving Average.
Entry price: 0.21390
First target: 0.23330
Second target: 0.24521
Third target: 0.25840
Dogecoin Vs Bitcoin: Mapping The 2025 All-Time HighThese are not the numbers that I am using for my DOGEBTC trade, these are very strong targets, for my numbers I am using the conservative targets for whatever reason. I guess it has been just too long since the last bull run phase.
Dogecoin is now trading within a long-term support zone vs Bitcoin, the strongest support range ever for this Cryptocurrency trading pair.
In the 2021 bull market, this level worked as resistance before the fifth and final wave. After the end of the bull market, this resistance turned support and it has been tested over and over and it holds.
The first time it was tested was June 202, then again in late 2023, early 2024 and again late 2024. This is the blue zone on the chart.
After the bullish jump last year, DOGEBTC is back again moving in this trading range. The action is happening as a higher low compared to previous years and there is no volume. It is 100% certain that this support will hold, which means that we are now in a very strong buy-zone, the accumulation zone. The best entry range possible before the 2025/26 bull market phase and bull run.
» Buy and hold.
Namaste.

Cup & Holder on Doge DOGE has been sleeping since the ATH in 2024. But has now woken up. The interest in this coin of freedom between people has again started to spike. On 21D chart there's a giant Cup & Holder with the promise of taken this coin to $0.72.

Is It "GO" Time for $DOGE Dominance to Flippen BTC?Been talking about this for a while.
Early, but not wrong.
Remember: nothing ever moves in a straight line except c0caine- and even then, only if you're a degenerate.
But enough about my theory- this market is breaking a lot of old "ObViOuS" patterns, because they never repeat perfectly.
What do YOU think is going on here?
Is it actually GO time?

Is DOGE Ready to Explode? Daily 1D Analysis with a 100% BullishThe overall power and main direction of Dogecoin is bullish. A healthy correction has recently occurred on the chart, and a 3D (three drives pattern) has been observed at the bottom, suggesting that sellers and those holding sell/short positions are currently exiting the market.
From the demand zone, we expect the price to move toward the specified targets.
A daily candle closing below the invalidation level would invalidate this analysis
Do not enter the position without capital management and stop setting
Comment if you have any questions
thank you

Dogecoin 🚨 Dogecoin at a turning point!
💰 Price is hovering around 0.15842 dollars, moving within a symmetrical triangle. Right at the intersection of dynamic resistance and a descending trendline 📉. A breakout above 0.16643 dollars could pave the way for a rally toward 0.17830 and even 0.19401 dollars 🚀
But if sellers take control and price gets rejected 🔻, supports at 0.14632 and 0.13850 dollars come into play. Further pressure could push it down to the key support at 0.12980 dollars.
📊 With tightening price action and approaching the triangle’s apex, a breakout in the coming days seems likely. The big question: who’s in charge — buyers or sellers? 🤔
📈 Breaking 0.16643 = buyer strength
📉 Rejection = seller dominance

$dogecoin Doge over 70% retracement in falling wedge...$Dogecoin has committed an over 70% retracement from a high of $0.48
Price action is currently in a falling wedge!
Current Price: 0.15
Previous falling wedge yielded a movement of over 400% , just as price found support around the 200EMA.
CRYPTOCAP:DOGE is currently finding support around the 200EMA area and If history repeats then expect previous supports (now resistances) to be tested at levels at 0.27, 0.38, 0.48 - Possibly up to 0.70
#dogecoin idea invalidates under 0.135
My preferred Buy Zone: 0.135-0.175

Dogecoin Breakout Alert: Is a Major Recovery Rally Starting Now?Dogecoin on the Cusp? Analyzing the Potential Breakout and Path to Recovery
Dogecoin (DOGE), the original meme coin that captured the world's attention with its Shiba Inu mascot and community-driven rallies, is once again stirring excitement in the cryptocurrency markets. After a period of consolidation and navigating broader market volatility, DOGE is showing signs of life, prompting speculation about whether a significant upside move could be on the horizon, potentially leading to a more sustained recovery. Recent price action, technical indicators, and optimistic trader sentiment are converging, painting a picture of a coin potentially coiling for its next big move.
Finding Footing: The Bounce from $0.1500
The foundation for the current optimism was laid when Dogecoin successfully defended the $0.1500 support zone against the US Dollar. In volatile markets, establishing clear support levels is crucial. Holding above $0.1500 demonstrated resilience and provided a base from which buyers could initiate a fresh push upwards. Following this defense, DOGE began a "decent upward move," managing to climb above the $0.1550 level.
This initial climb is significant because it signals a shift from purely defensive price action to potentially offensive momentum. Buyers stepped in at a key psychological and technical level, absorbing selling pressure and turning the tide, at least in the short term. The ability to not only hold support but to initiate a bounce suggests underlying demand and interest returning to the meme coin.
Consolidation and Key Technical Signals
Currently, Dogecoin appears to be in a consolidation phase, trading above the $0.1580 level. Consolidation after an upward move is often viewed constructively by technical analysts. It can represent a period where the market digests recent gains, shakes out weak hands, and builds energy for the next directional leg. The key question during consolidation is whether it resolves upwards (a continuation of the prior move) or downwards.
Several technical indicators are lending credence to the bullish case during this consolidation:
1. Trading Above the 100-Hourly Simple Moving Average (SMA): The price remaining above this key short-term moving average is generally considered a bullish sign on hourly charts. It indicates that the average price over the recent past is trending upwards, and the current price is maintaining strength relative to that average. It often acts as dynamic support during pullbacks within an uptrend.
2. Bullish Trend Line: The formation of a short-term bullish trend line with support currently identified around $0.1590 on the hourly DOGE/USD chart is another positive signal. This ascending line connects recent lows and visually represents the current upward trajectory. As long as the price stays above this trend line, the immediate bullish structure remains intact. It provides traders with a clear reference point for potential entry or stop-loss levels.
These technical factors suggest that despite the consolidation, the underlying momentum favors the bulls in the immediate term. The market structure is building higher lows, supported by the trend line and the moving average.
The Resistance Hurdle and Breakout Potential
While the support and short-term indicators are encouraging, the true test for Dogecoin lies in overcoming resistance. The immediate significant hurdle identified is the $0.1650 level. A decisive break and close above this resistance zone would be a strong technical signal, potentially confirming the end of the consolidation phase and the beginning of a more substantial rally. Breaking resistance often triggers further buying activity, including stop-loss orders from short sellers and new entries from breakout traders.
Beyond $0.1650, the next major target highlighted is the $0.2050 resistance zone. Clearing this level would represent a more significant milestone, potentially putting Dogecoin firmly back on the path towards higher valuations seen earlier in the cycle. A move towards $0.2050 would likely require sustained buying pressure and positive sentiment across the broader crypto market.
Trader Sentiment and Bold Predictions
Adding fuel to the speculative fire are optimistic predictions from market participants. Notably, one trader, who reportedly "nailed" a previous 300% rally in Dogecoin, is suggesting that history might be about to repeat itself. While such predictions should always be taken with caution, they reflect a growing bullish sentiment within certain segments of the trading community. These forecasts often rely on pattern recognition, fractal analysis (comparing current price structures to historical ones), and sentiment indicators.
Furthermore, bullish signals are reportedly pointing towards a potential "pump," with some analysts setting longer-term price targets as high as $0.28. Achieving such a target would represent a significant recovery and substantial gains from current levels. This level likely corresponds to previous key resistance or Fibonacci extension levels, representing areas where traders anticipate strong price reactions.
Why the Optimism? Potential Catalysts
Several factors could be contributing to this renewed optimism:
• Broader Market Recovery: Cryptocurrencies often move in tandem, especially Bitcoin and major altcoins. If Bitcoin continues its strength or embarks on a new leg up, it often lifts sentiment across the market, benefiting coins like Dogecoin.
• Meme Coin Season: Historically, periods of market exuberance have seen "meme coin seasons" where highly speculative, community-driven tokens experience outsized gains. Renewed interest in this sector could benefit its leading token, DOGE.
• Community Engagement: Dogecoin boasts one of the most active and vocal communities in crypto. Social media hype and coordinated community efforts can significantly impact its price, especially during positive market conditions.
• Technical Setup: As outlined above, the technical picture (holding support, bullish trend line, potential breakout from consolidation) provides a logical basis for traders anticipating an upward move.
Risks and Considerations
Despite the bullish signals and optimistic forecasts, investing in Dogecoin remains inherently risky and speculative:
• Volatility: DOGE is known for its extreme price swings. Gains can be rapid, but losses can be equally swift.
• Resistance is Real: Failure to break decisively above $0.1650 or $0.2050 could lead to a rejection and a move back down to test support levels, potentially invalidating the bullish setup.
• Market Dependence: A downturn in Bitcoin or the broader crypto market could easily drag Dogecoin down, regardless of its individual technical setup.
• Hype-Driven: Price action can be heavily influenced by social media trends, celebrity endorsements (like those historically from Elon Musk), and general market sentiment, which can change rapidly and unpredictably.
Conclusion: Poised for Potential, Confirmation Needed
Dogecoin currently stands at an intriguing juncture. It has established a solid base of support, initiated an upward move, and is consolidating above key short-term indicators, supported by a bullish trend line. Optimistic traders are eyeing significant upside potential, with targets ranging from $0.1650 and $0.2050 to as high as $0.28, fueled by predictions of repeating past explosive rallies.
However, potential does not guarantee performance. The immediate challenge is converting the current consolidation into a confirmed breakout above the $0.1650 resistance. A successful breach could indeed ignite further buying pressure and set the stage for a move towards $0.2050 and potentially higher, sparking the "full-on recovery" bulls are hoping for. Conversely, failure to overcome resistance could see momentum wane.
For traders and investors, the current situation demands careful monitoring of key levels. While the technical signals lean bullish in the short term, Dogecoin's inherent volatility and sensitivity to broader market conditions necessitate cautious optimism and robust risk management. Whether DOGE is truly about to repeat history remains to be seen, but the current setup has certainly put the beloved meme coin back in the spotlight.

DOGE is very interesting here!DOGE / USDT
Price is setting near a very interesting area for buying after 5 months of bear market
According to this setup .. Prices from 0.16$ - 0.10$ are considered an accumulation zone and could produce a strong rebound
1- Price can jump from here with strong volume any time forming a bull rally
2- However, if price lost the lower trend line (white) it will become bearish again !
Keep an close eye in this zone …

#DOGE/USDT#DOGE
The price is moving in a descending channel on the 1-hour frame and is adhering to it well and is heading to break it strongly upwards and retest it
We have a bounce from the lower limit of the descending channel, this support is at a price of 0.1630
We have a downtrend on the RSI indicator that is about to break and retest, which supports the rise
We have a trend to stabilize above the moving average 100
Entry price 0.18372
First target 0.18372
Second target 0.19350
Third target 0.20533
