DOGE - McDonald's? Much information is circulating about negotiations between Elon Musk and McDonald's regarding accepting DOGE payments at McDonald's. As is known in the world of cryptocurrencies, such situations can lead to sudden and large increases. So let's follow how the whole thing unfolds.
DOGEBTC

DOGEUSDT-SHORTBased on technical factors there is a short position in :
DOGEUSDT Dogecoin
Score 2️⃣
🔴Short Now or set on Key Level 0.1455
🟢Target 1 0.1370
🟢Target 2 0.1270
❌Stop loss 0.1480
#K_Level
Every signal has a score from 1 to 5, so accordingly adjust your risk for each signal. The signals with the score of 5 are the most probable ones.
Please support our activity with your likes and comments.

Elon Musk would eat a Happy Meal if McDonald's accepts DOGEElon Musk said he would eat a Happy Meal on TV if McDonald's started accepting Dogecoin as a form of payment.
Even BurgerKing, who had joint marketing campaigns with Dogecoin before, commented on the tweet.
So i believe DOGE has some upside momentum to the next resistance, $0.165, or at least a strong support at this current level.
Looking forward to read your opinion about this.

DOGEUSDT-SHORTBased on technical factors there is a short position in :
DOGEUSDT Dogecoin
Score 2️⃣
🔴Short Now or set on Key Level 0.1470
🟢Target 1 0.1365
🟢Target 2 0.1245
❌Stop loss 0.1550
#K_Level
Every signal has a score from 1 to 5, so accordingly adjust your risk for each signal. The signals with the score of 5 are the most probable ones.
Please support our activity with your likes and comments.

DOGEBTCHello Crypto Lovers,
Mars Signals team wishes you high profits.
We are in the daily time frame. The price has broken the S1 line and has turned it into the support line. It has also made its pullback and now it is time for the price to move up. If the S1 line is also lost, then there would be more falling.
Warning: This is just a suggestion and we do not guarantee profits. We advise you to analyze the chart before opening any positions.
Wish you luck

Dogecoin SHORT TO $0.08 or $0.04 Dogecoin going on an A-B-C ZIG-ZAG correction which is a (5-3-5 wave) very common after a good 5 wave impulse
Blue 5 wave Elliot wave in 2021 Jan TO May
ABC corrective wave in RED
We are now in Wave C in the ZIG-ZAG correction (PURPLE)
Wave C is going through sub wave (4) and sub wave (5), we are already going below 78.6% FIB retracement, so the next best points are 88.6% and 94.1% and they are derived by the following formulae:
88.6% price level is derived by squaring (or multiplying by itself) from the Golden Ratio, 0.618:
0.618 x 0.618 = 0.786 (78.6%)
0.786 x 0.786 = 0.886 (88.6%)
0.886 x 0.886 = 0.941 (94.1%)
88.6% retracement price is $0.08
94.1% retracement price is $0.04
I believe DOGE will still be shorted and may find the reversal at that zone
Please like and comment for feedback

DOGEUSDT | The safest place to sell🎯Hello traders, Dogecoin in daily timeframe , this analysis has been prepared in daily timeframe but has been published for a better view in 2 day timeframe.
In the count we had, the main waves 1, 2 and 3 were completed.
We examined wave 4.
From wave 4 we are sure that wave a is complete, but we still have doubts about wave b because it is not in normal terms in terms of time.
Preferably we counted wave b as finished and now we are waiting for wave c movements.
Wave c has completed waves 1, 2, 3 and 4.
Wave 5 has moved enough to be considered complete, but we prefer to state all the probabilities in the confirmed points.
If the Fibonacci 0.618 is broken down for wave c, the decline will continue until wave c equals wave a.
If the roof of the canal is broken, the ascent will be confirmed and wave 5 will be completed.
🙏If you have an idea that helps me provide a better analysis, I will be happy to write in the comments🙏
❤️Please, support this idea with a like and comment!❤️

Doge breakout soon!Beautiful cup and handle + bullish divergence on 1 h chart.
Doge sell off is slowing down as btc is finding support again and again on the 40k level.
We are clearly not in a bear market. Its just a downtrend in a bullmarket.
Its clear that the situation is on the verge of becoming very hot for altcoins and bitcoin.
I think doge will lead the way again but given the cap very high it will rise slower than before but it will still give good profit!
Check my other ideas for Doge!
Here for you, as always, CryptoSoap!

Liquidity Pool on the weekly pattern DOGECOIN ELON MUSK just played with the fire 😂
Dogecoin bounce back
Robots entry.

Buying DOGE Here for a Quick PumpBuy: 0.155 - 0.1625
Stop Loss: Close below 0.15
Taking profit around 10%

doge/usdt------ to the moon!!!!!You have to wait for a suitable and strong return candle to strike in the specified areas where there is a possibility of pullback, and then you start buying this currency.
I emphasize again that a strong candle and return must be struck...
Note that Dodge Coin has broken its downward trend towards Bitcoin and is doing a pullback....
If Doge fails to reverse its trend in these pullback areas, it will most likely have a downward trend.
what is your idea?

doge/btc --------doge to the mooonYou have to wait for a suitable and strong return candle to strike in the specified areas where there is a possibility of pullback, and then you start buying this currency.
I emphasize again that a strong candle and return must be struck...
what is your idea?

DOGEI expect that if the price crosses the support range of $0.1677 - $0.1663, we will see the price of Dogecoin decrease to the support range of $0.1623 - $0.1612.

DOGEBTC goes back 2 trendHey fren it looks like DOGEBTC goes back on trend track this year by this rly.
Right now maybe is bottom & around March/April should be trying a nice + obvious starting for sure if so.
Hope it helps a little and u are ready when rly is happening bye. #doggonacci

DOGECOIN, SIGNAL, DAILY TRADEDoge had a little helping hand from Elon on the merch sale news but the bullrun looks its come to an end.

DOGEUSDT | The safest place to sell🎯Hello traders, Dogecoin in daily timeframe , this analysis has been prepared in daily timeframe but has been published for a better view in 2 day timeframe.
In the count we had, the main waves 1, 2 and 3 were completed.
We checked wave 4, from wave 4 we are sure wave a is complete.
But we still have doubts about wave b because it is not normal in terms of time.
Preferably we counted wave b as finished and now we are waiting for wave c movements.
At times lower than wave c, waves 1,2,3 are completed, and based on new observations, we think we are inside wave 4, another wave is probably left to complete, and then we will have a decrease for wave 5 as much as wave a.
This analysis will be fielded if the warning signal, ie the channel ceiling, is broken upwards
And if the red circle is broken downwards, it is a confirmation of the formation of wave 5.
🙏If you have an idea that helps me provide a better analysis, I will be happy to write in the comments🙏
❤️Please, support this idea with a like and comment!❤️

DOGE Support and Resistance playDOGE bounced from the oversold support area and looking at the chart it seems like it is heading to the $0.24 resistance.
Looking forward to read your opinion about it.

DOGE Coin. A Trend Shift is Taking Shape.BINANCE:DOGEBTC has seen many a great pumps in 2021, with smaller pumps inside the bigger ones in what looks like a fractal. Recently, DOGE has been going sideways for a whole month. This hasn't happened in a long time. It has always been trending lower and lower. A support line is gaining more significance as DOGE keeps bouncing off of it. I believe we are on the verge of a trend shift, either we remain going sideways for two more months, or we see a new pump soon that is greater than the recent weak 1-day pumps. Moreover, RSI is showing a sign of reversal due to stronger lows in RSI coinciding with lower lows in price. Let us wait and see how this unfolds, and whether the next pump is indeed stronger than the last.

$dogeEvery doge on his own.
To add gas on the fire, Two pivots to be flipped for me the TL & blue line.

DOGECOIN is up about 20%, Where is the best place to buy?Hi everybody,
Doge is up about 20%, This price increase happened because of BTC bounce and Elon Musk tweet.
In my idea breaking out of this strong descending channel is a good event but it isn't enough for more price increase!
For going higher, It's necessary to break 20 cent resistance In My Idea. Then we can expect to see more uptrend, So in this situation, I'm not bullish on this coin but I will publish this analysis as LONG analysis Because going higher is more possible.
A breakout of current resistance will turns my opinion bullish!

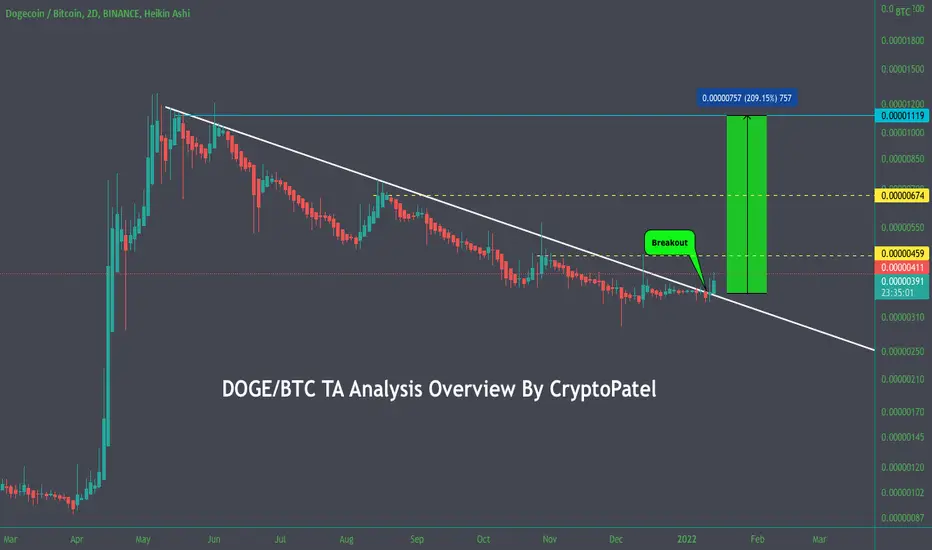
DOGECOIN Ready to Pump because 2D Breaking out#DOGE/BTC Breakout Alert:-
- #DOGE breaking out resistance in 2D time frame.
-Still, 24 hour left to close 2D candle with Good Volume.-
-Currently trading at 390 Satoshi
-So I am expecting 1200 Satoshi Target after this Breakout.
- T&c= Need to hold this 350 Satoshi support.
DOGE,squeeze and key level breakout as a good buying opportunityDOGE has recently risen by 50% from its low. This is partly thanks to Elon Musk's tweet, but it is worth pointing out that the price started rising even before the tweet.
On the technical analysis side, the price came to a key level, which is currently resistance. As a result, we see a small pullback.
In case the price comes back, squeezes, and breaks the key level, there could be a good buying opportunity.
Write in the comments all your questions and instruments analysis of which you want to see.
Friends, push the like button, write a comment, and share with your mates - that would be the best THANK YOU.
P.S. I personally will open entry if the price will show it according to my strategy.
Always make your analysis before a trade.

doge/btcDoge is suspicious ....What do you think?
What about when Bitcoin is suffering.. money enters to Doge!!!!!!
what is your idea?
