DOGE/USDTDOGE will follow SHIB very soon ;)
Buying here & will wait for breakout , Targets on chart.
DOGEBTC

DOGECOINwe see channel building in charts. So Bulls are healthier and creating position for fresh move . so we go with trend and make a long position with logic
DOGE/USD - Doge About To EXPLODE?! 🤣💥Doge broke above the blue pennant and now has made the pennant support... so long we hold above that level Doge is likely to break the resistance on the chart and push much higher.
The Fib levels will provide resistance, but a 50% pump from Doge looks likely at this time.
Volume above the pennant has also been much higher than usual, this indicates interest in DOGE.
Indicators are also bullish overall... lets see. We should have some fireworks soon, or at least when we break away from our current structure above the blue pennant.
Bias remains bullish on Doge so long it sits above the pennant.
Like and follow if you liked this idea!

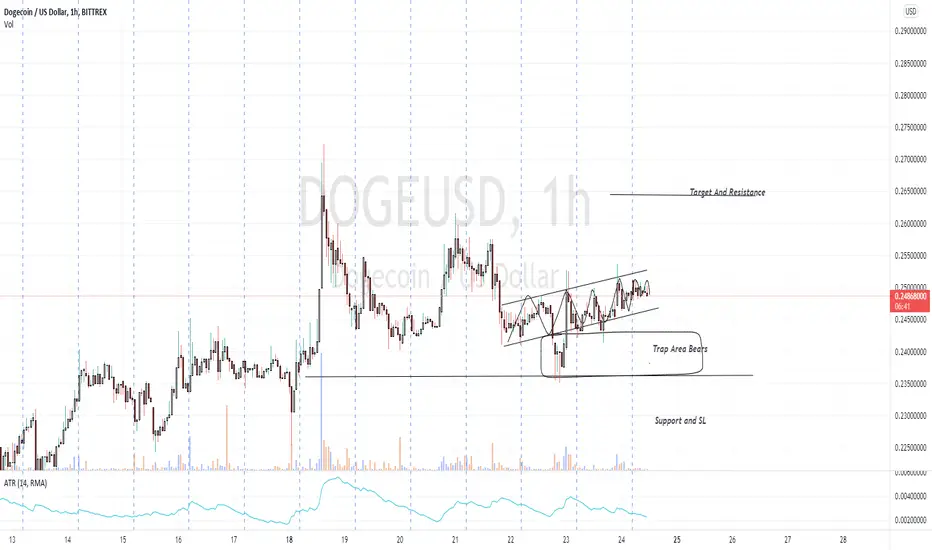
✴️ DOGE/USDTDOGE is been in a range since the start of the month. There's not any major pattern forming yet. $0.22 - $0.23 is the major support level and $0.25 - $0.26 is the major resistance level. You can wait for the price to dip back to the support area at around $0.23 for a buy and continue to range. If the price breaks the resistance zone then we gonna find potential entries in the pullback.

DOGE MASSIVE BULLISH DIVERGENCEDOGE is in the process of confirming a major weekly bullish divergence.
1. Price double bottom confirmation - this forms an uptrend
2. MACD downtrend - further supported with MACD histogram creating higher low as indicated by green lines
3. PFE downtrend - very sharp contrast
Price uptrend combined with multiple oscillator downtrends is classical hidden bullish divergence.
4. Decreased consolidating volume - liquidity is low and spread on exchanges are thin (necessary set-up for volatile price action)
5. Price confirms 50 EMA twice - simultaneously having crossed MACD and massive oscillator downtrend and not breaking below 50EMA indicates very strong support on price upside.

DOGE - Sleeping GiantOne more tweet from our favorite Elon and this coin will be unstoppable. Get ready we are at the verge of the consolidation.

DOGE is Ready to MoveBTC Dominance is dropping which mean large caps are next.
I expect us to breakout on the BTC Pair.
Buy: $0.24 - 0.25
Stop loss: daily close USDT pair back below trendline
Max target is shown in BTC pair

dogeusdt 0.2380 analysishi freinds
After a few months of downtrend with the formation of a downside pattern and signs of return
It will be an uptrend if it breaks the price range of 0.2790 and I do not have a downtrend.
Otherwise, we will see a further fall in prices


Doge getting close to breaking outDoge looking good down here to break out
Accumulated down here and looks good for risk reward

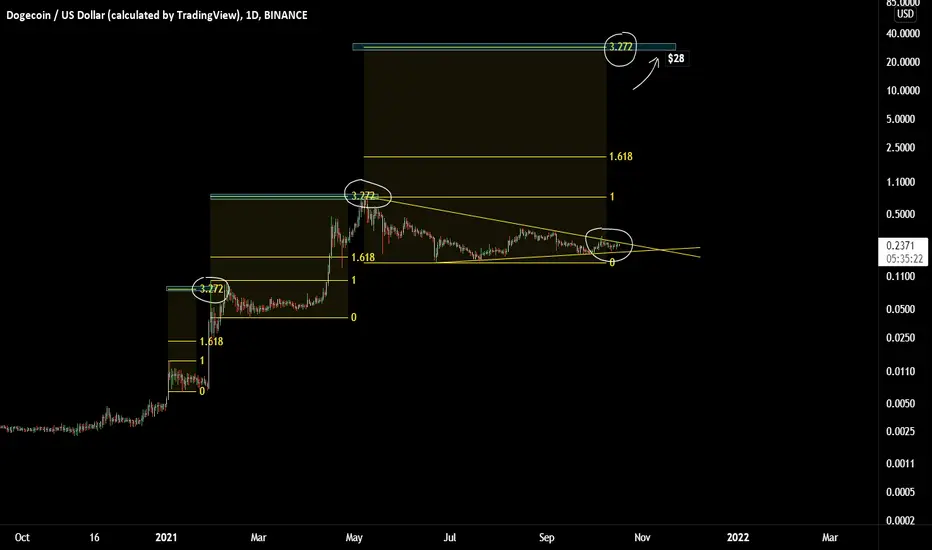
$DOGE IS READY FOR $28Dogecoin finally got out of the bullish triangle it's been forming since May and is ready to reproduce its usual pattern to 3.272 of Fibonacci. We can expect a rise whenever Bitcoins decides to pull-back in the next few weeks. See my previous post about Dogecoin for more explanation.


doge the perfect meme coindoge still in mega phase of accumulation, you need hold this shit to 1.5 usd , and sell the shit before ath. are you warned


Almost 8% Profit for TODAYLet's See what will happen
in the next hours, DOGE will break 0.25$ and then 0.26$ Lines.

DOGE, DOGECOIN, DGEUSDTDOGE Daily Time Chart
Can history repeat itself and see another 1000% return with a breakout from bull pennant! Watch closely for a daily close at 0.24 for the breakout confirmation.

DOGE/USD - About to breakout, +50% possible! 🚀🚀🚀DOGE has formed a large pennant (in blue) which is about to break to the upside!
Can DOGE do it? The indicators appear to say YES.
Volume is up on this last daily candle that wicked above the pennant. RSI and MACD are bullish as well.
We were pushed down by the bears, but if DOGE can make this top trendline which acted as resistance, support, then DOGE army is gonna celebrate soon... since a PUMP will likely follow such a scenario. :)
The first two targets are on the chart, one at $0.3 and the other just under $0.4 as indicated by the Fib levels.
A 50% pump for DOGE is nothing. So this becomes very likely should doge decide to pump soon.
Be ready. Bias is very bullish.
Like and follow if you liked this idea!


DOGE COIN - Updated Chart 🦴🐾We did well going short on this one (previous idea here) but for the last 2 weeks we have been looking for a breakout over the key support (pink level).
That seems to be happening today so here is the chart with updated levels for targeted take profit prices.
One Love,
the FXPROFESSOR

DOGE ABOUT TO FLY TO $28 Why $28 ?
As we have seen before, Dogecoin always follows a specific pattern that we can reproduce with Fibonacci extension tool : it always goes to 3.272. We can reproduce this pattern and see that the next 3.272 is $28.
When will it begin ?
Bitcoin is rising, and we know that Dogecoin usually rises when bitcoin pullbacks. In order for Dogecoin to rise, Bitcoin has to pull back or go sideways for a while. Knowing that Bitcoin just reached its previous all-time high, we're going to have to wait a few more weeks in order to see bitcoin pulling back from a higher price than its current price.
What about the bullish triangle ?
We can see on the chart that Dogecoin always forms a bullish triangle before rising. Here we can see that the current triangle is 3 times bigger than the previous one, which let us conclude that the next rise will be much bigger than the previous one. Moreover, this triangle ends around November 15th which gives about one month to Bitcoin to rise and pullback in order for institutional traders to put move the money from Bitcoin to Altcoins
Tell me what you think about this chart down-below
DOGE - Daily ChartI don't like the recent DOGE chart. 1H candles are showing too much noise. Pure manipulation!
Market is showing moderate buy volumes for DOGE.
Bollinger Bands are trying to get the price to focus on one area bur they're not as squeezed as Bitcoin.
There are 2 support areas on the way down since I feel that Doge is acting edgy.
Also we have two resistance areas on the way up so watch out for them.
I'll keep this chart updated.
Use this chart as your trade setup for now.
Current Market Price: $0.2370
Good Luck
Tell me your ideas. Like and Share

DOGE forming an inverse Head and Shoulder pattern!Here's a quick Look at DOGE 8 hr chart. As we can see, the price has been forming a inverse head and shoulders pattern and we could see a break to the upside soon! Definitely one to keep an eye on.
The best entry would be, when the price breaks above the trend line with good amount of volume .
-------------------------------------------
The idea is: Buy the breakout from the trend line and take profits at the levels shown in the chart.
Targets:
- Profits can be taken in the resistance zone .
1. 0.26$
2. 0.276$
3. 0.294$
4. 0.31$
-------------------------------------------
If you like the content, then make sure to comment and like the post :D
Follow me for daily profitable trading setups
BTC dictates the market. If BTC falls, then Alts will fall as well. Trade safe!

Doge breakout is IMMINENTAccumulate as much DOGE as you can in this dip because once it will start moving, its not going to give you a another chance.
