DOGE - Daily SetupAlright now that the price has become stable, we can see a consolidation channel is formed.
Use this setup to open long and short positions>
Open your long positions once it hit the support, and open your short positions when the price touched the resistance line.
Don't keep your positions for too long, close at small profits and enjoy this consolidation.
Current Market Price: $0.210
Good Luck
Tell me your ideas. Like and Share
DOGEBTC

BTC bullish short term scenarioAs we can see we are getting closer to the triangle apex... will it break up... i think there is a possibility because we had a looong time of chop and everyone got bored of this lazy PA. === someone was accumulating. So some move i expected.
This is not a financial advice... i am posting it only for educational purpose.

DOGE TO THE MOONIf BTC and Elon help, potentially it can rise to 57c and more... take profit by parts to be out of RISK and trade SAFE.
SL: 19c
TP1: 27.5c 40%
TP2: 33.5c 20%
TP3: 43c 10%
TP4: 46.5c 10%
TP5: 51.5c 10%
TP6: 56.5c 10%

Doge got dropped after Elon Tweets. Buyers were trapped Doge got dropped after Elon Tweets. Buyers were trapped

Dogecoin (DOGE) - July 11Hello?
Welcome, traders.
By "following", you can always get new information quickly.
Please also click "Like".
Have a good day.
-------------------------------------
(DOGEUSD 1W Chart)
If the price is maintained above the 0.23923275 point, it is expected that the uptrend will continue.
(1D chart)
If the price finds support in the 0.17352560-0.23923275 zone and moves up and maintains the price in the 0.23923275-0.34555029 zone, I would expect it to turn into an uptrend.
If it falls from the 0.16991897 point, the support zone is weak and it is possible to enter the mid- to long-term investment area, so you need to trade cautiously.
--------------------------------------
(DOGEBTC 1W chart)
If the price holds above the 574 Satoshi point, it is expected that the uptrend will continue.
(1D chart)
If the price is maintained in the range of 610 Satoshi-808 Satoshi, it is expected to turn into an uptrend.
However, we expect the uptrend to be limited until it breaks away from all downtrend lines.
If it goes down from the 574 satoshi point, you should see support in the 313 satoshi-412 satoshi section.
------------------------------------------
We recommend that you trade with your average unit price.
This is because if the price is below your average unit price, whether it is in an upward trend or in a downward trend, there is a high possibility that you will not be able to get a big profit due to the psychological burden.
The center of all trading starts with the average unit price at which you start trading.
If you ignore this, you may be trading in the wrong direction.
Therefore, it is important to find a way to lower the average unit price and adjust the proportion of the investment, ultimately allowing the funds corresponding to the profits to regenerate themselves.
------------------------------------------------------------ -----------------------------------------------------
** All indicators are lagging indicators.
Therefore, it is important to be aware that the indicator moves accordingly with the movement of price and volume.
However, for the sake of convenience, we are talking in reverse for the interpretation of the indicator.
** The wRSI_SR indicator is an indicator created by adding settings and options to the existing Stochastic RSI indicator.
Therefore, the interpretation is the same as the traditional Stochastic RSI indicator. (K, D line -> R, S line)
** The OBV indicator was re-created by applying a formula to the DepthHouse Trading indicator, an indicator disclosed by oh92. (Thanks for this.)
** See support, resistance, and abbreviation points.
** Support or resistance is based on the closing price of the 1D chart.
** All descriptions are for reference only and do not guarantee a profit or loss in investment.
Explanation of abbreviations displayed in the chart
R: A point or section of resistance that requires a response to preserve profits.
S-L: Stop Loss point or section
S: A point or section where you can buy to make a profit as a support point or section.
(Short-term Stop Loss can be said to be a point where profit and loss can be preserved or additional entry through split trading.
GAP refers to the difference in prices that occurred when the stock market, CME, and BAKKT exchanges were closed because they are not traded 24 hours a day.
G1 : Closing price when closed
G2: Opening price
(Example) Gap (G1-G2)

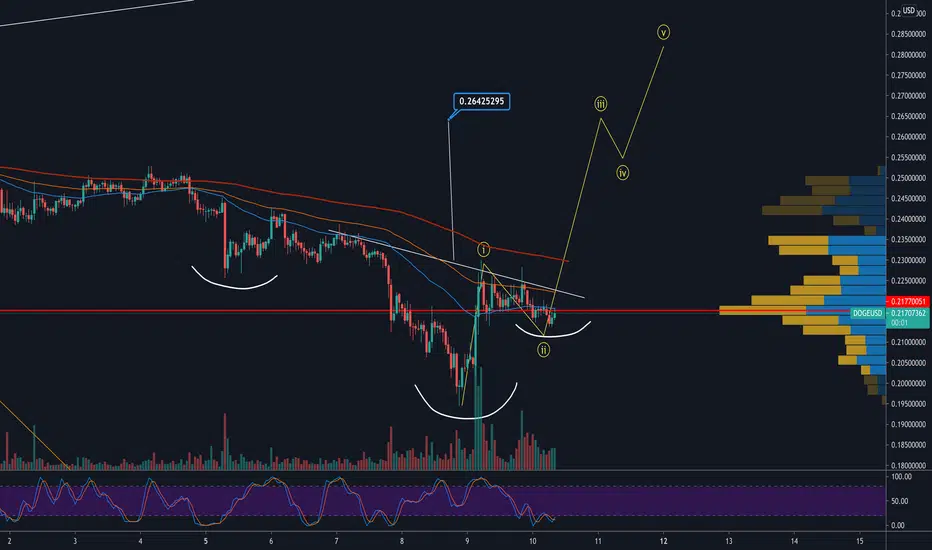
DOGEDOGE we have what appears to be an impulsive W1 and now in W2 pull back W3 taget is .26c and W5 is .29c looks like Elon canceled our .13c Doge op
Doge to the moon but before 0.14 (Must Read)Doge loves triangles.
And we must ZOOM OUT to see what is going on.
Doge is in a downtrend which is respecting every fundamental.
Doge is respecting Fibs as well and every time does beyond the Fib 5.
This is a descending wedge which we must LOVE because is going to give us so much rewards.
Do not sell. Buy more at 0.18, 0.17, 0.16. 0.15 and 0.14 from there just wait.
Forget about $1 we will go straight to $4 and beyond.
Trust the process.
It happened 7 times before, why is not gonna happen now?
Let the DOGE go to 0.14 love 0.14 because we are going to the moon big time.
Sell around $5 because we'll drop very hard after that.
Save this post as your reference for the future days.
BINANCE:DOGEUSD


DOGE sell the downtrend.DOGEUSD - Intraday - We look to Sell at 0.2369 (stop at 0.2456)
Daily signals are bearish.
Trend line resistance is located at 0.2380.
Neckline resistance 0.2300.
Broken out of the triangle formation to the downside.
Early optimism is likely to lead to gains although extended attempts higher are expected to fail.
Our profit targets will be 0.2125 and 0.2025
Resistance: 0.2260 / 0.2300 / 0.2400
Support: 0.2100 / 0.2000 / 0.1900


DOGE Sell the breakdown.DOGEUSD - Intraday - We look to Sell a break of 0.2248 (stop at 0.2333)
Daily signals are bearish.
We are trading close to the end of a descending Ending Wedge Formation.
The bias is to break to the downside.
Rallies continue to attract sellers.
Our profit targets will be 0.2001 and 0.1968
Resistance: 0.2400 / 0.2500 / 0.2550
Support: 0.2300 / 0.2150 / 0.2000

DOGE Sell a triangle break.DOGEUSD - Intraday - We look to Sell a break of 0.2248 (stop at 0.2333)
Trades with a bearish descending triangle formation.
The bias is to break to the downside.
A bullish reverse Head and Shoulders has formed.
The previous swing low is located at 0.2260.
A break of 0.2250 is needed to confirm follow through negative momentum.
Daily pivot is at 0.2260.
Price action is forming a bearish flag which has a bias to break to the downside.
Our profit targets will be 0.2001 and 0.1948
Resistance: 0.2400 / 0.2530 / 0.2600
Support: 0.2300 / 0.2150 / 0.2000

Doge coin broke level as i sad✅ But it took my SL before DROP(((Doge coin broke level as i sad✅ But it took my SL before DROP(((

DOGE Analysis #DOGE somehow break its downtrend line but unable to break its strong resistance level and fell below. No buying zone for #DOGE, wait for price to come near liquidity area or towards its support level.
If you liked my idea, follow me for more.

Dogecoin EXPLOSION soon!Dogecoin is getting squeezed in and everyday we are getting closer to a major breakout. It can go either way up or down, but there is a higher chance of pumping to upside since bitcoin is gaining some strength!
How DOGE likes to pump DOGEUSDIdea for DOGE includes a few wedge patterns mostly falling
Each breakout of these patterns has led to massive rises in price
I expect a large pump through 1.618 after this current period of consolidation (falling wedge)
~500% or more

DOGE sell the breakdown.DOGEUSD - Intraday - We look to Sell a break of 0.2269 (stop at 0.2381)
Daily signals are bearish.
Trades with a bearish descending triangle formation.
The bias is to break to the downside.
The failure to sustain the break higher and subsequent dip, formed a bearish candle and is negative for short term sentiment.
A break of bespoke support at 0.2300, and the move lower is already underway.
Our outlook is bearish.
Our profit targets will be 0.1954 and 0.1904
Resistance: 0.2550 / 0.2700 / 0.2900
Support: 0.2400 / 0.2300 / 0.2150

DOGE W/ $1 & $2 FIB PROJECTIONSI created this chart using a fib retracement of DOGE lowest lows to most current highs to give comparison to DOGE with a fib retracement from lowest lows to both $1 and $2. I am self taught when it comes to charts so this could be a wrong way in doing things but given how the fib scale works, i dont see why we cant make charts with potential lines of support ie in this case, if we expect doge to inevitably (hopefully) get to $1, than we should be able to see the potential lines of support and resistance to get it there.

Dogecoin, shows same pattern that we traded in V.I.P communityDogecoin, shows same pattern that we traded in V.I.P community


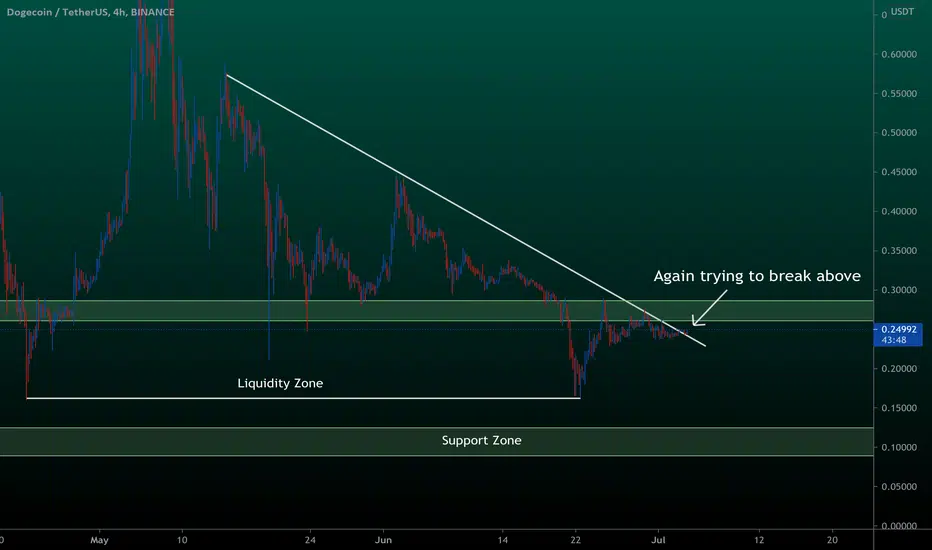
DOGECOINDOGE again trying to break the trendline, so far we price got rejected from its resistance and downtrend line. Currently, price again trying to break the downtrend line. There's a strong resistance just sitting above the resistance.
If you liked my idea, follow me for more.
DOGE - Going Up?DOGE pumped alongside Bitcoin? We don't see that happening everyday!
Since this JokeCoin built up its volume alongside BTC and it's fighting resistance right now, we can say that there's still room for a move up even if Bitcoin starts correcting its price!
Wait until the price closes a 4H candle above that resistance area so that we can make sure. Then open your long positions and aim for prices around that TP shown on chart.
Sell Volumes are showing up so be careful with your positions, we might see a bit of correction.
Current Market Price: 0.249
Good Luck
Tell me your ideas. Like and Share!
Follow for more updates.

DOGE USDT #DOGE #DOGEUSDT#DOGE PRICE IS ON THE IMPORTANT SUPPORT AREA IN THE W TIMEFRAME:
1- RSI TREND LINE
2- PRICE TREND LINE
ON THE OTHER HAND, WE SEE HAMMER CANDLE IN THE DOWN TREND AND IT CAN SHOW FINAL OF DOWNTREND AND START OF UPTREND IN THE FUTURE;)
I AM BULLISH ABOUT DOGE
