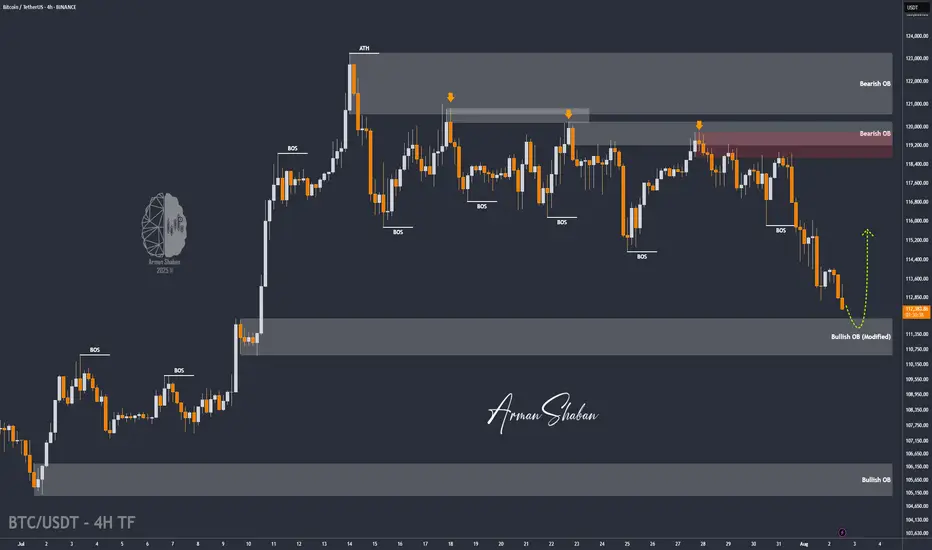
BTC/USDT | Bitcoin Eyes Rebound from $110K Support Zone! (READ)By analyzing the Bitcoin chart on the 4-hour timeframe, we can see that after reaching a new high at $123,218, the price began to pull back and has now corrected down to around $112,500. I expect the current volatility to ease soon. The next critical support zone lies between $110,500–$112,000 — watch price action closely here, as BTC could bounce from this area and push back toward $116,000+. Other key demand zones are located at $109,000, $107,900, and the $105,000–$106,000 range.
Please support me with your likes and comments to motivate me to share more analysis with you and share your opinion about the possible trend of this chart with me !
Best Regards , Arman Shaban
Dogecoin
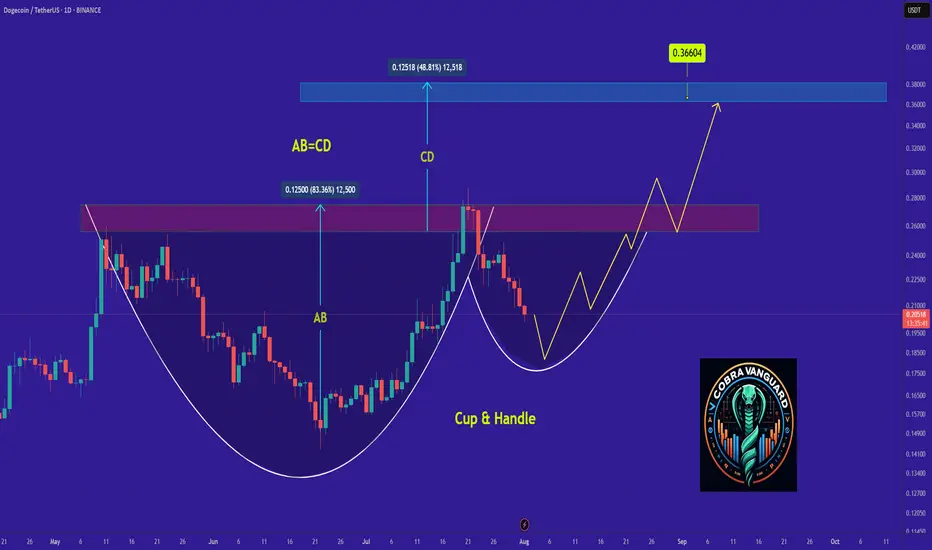
DOGE/USDT Trade Idea – Potential Cup & Handle Pattern Timeframe: Technical Analysis:
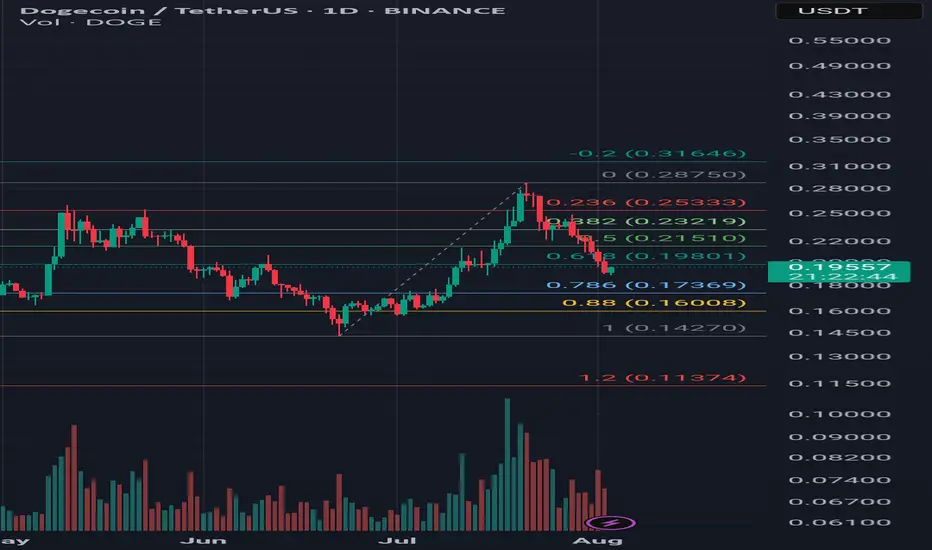
Price rallied from 0.142 to 0.287 and is currently forming the handle of a potential cup & handle pattern.
Price is sitting at the key 0.618 Fibonacci retracement level (0.198 USDT).
If this support holds and price breaks above resistance levels with strong volume, the cup & handle pattern may activate.
---
🎯 Targets:
1. First resistance: 0.215 USDT (50% Fib)
2. Second resistance: 0.232 USDT (38% Fib)
3. Key breakout level: 0.287 USDT
4. Classic pattern target: 0.432 USDT
---
🛡 Stop Loss:
Below 0.170 USDT (slightly under the 0.786 Fib & handle bottom)
---
✅ Entry Confirmation Criteria:
1. Hold above 0.198 support
2. Break and close above 0.215
3. Breakout above 0.287 with strong volume
---
💡 This analysis is for educational purposes only and is not financial advice. Always use proper risk management.
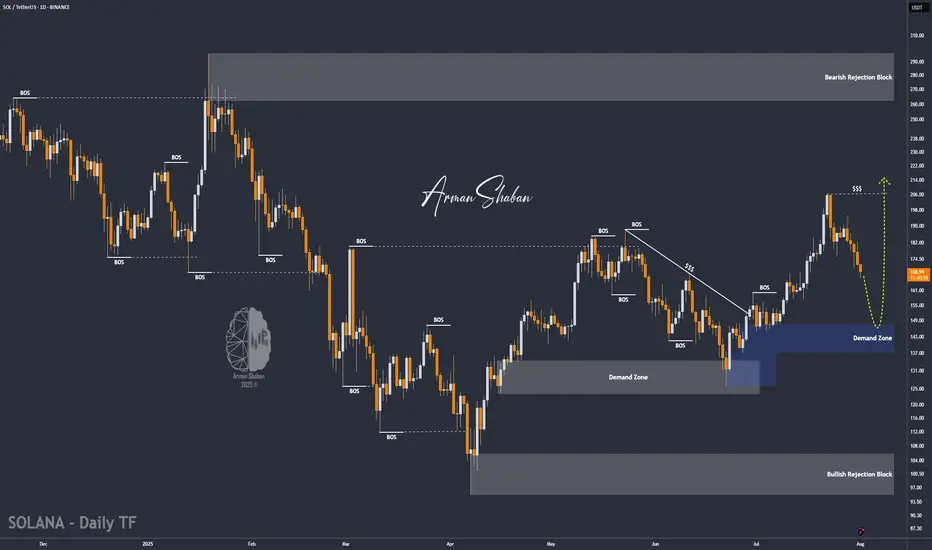
SOL/USDT | SOL Drops 25% – Approaching Key Buy Zone at $136–$148By analyzing the Solana chart on the daily timeframe, we can see that, like the rest of the market, it's undergoing a correction — dropping over 25% from the $206 area so far. Solana is now approaching a highly attractive buy zone between $136–$148, so be sure to closely monitor the price reaction in this range. Bullish targets will be announced soon — stay tuned!
Please support me with your likes and comments to motivate me to share more analysis with you and share your opinion about the possible trend of this chart with me !
Best Regards , Arman Shaban

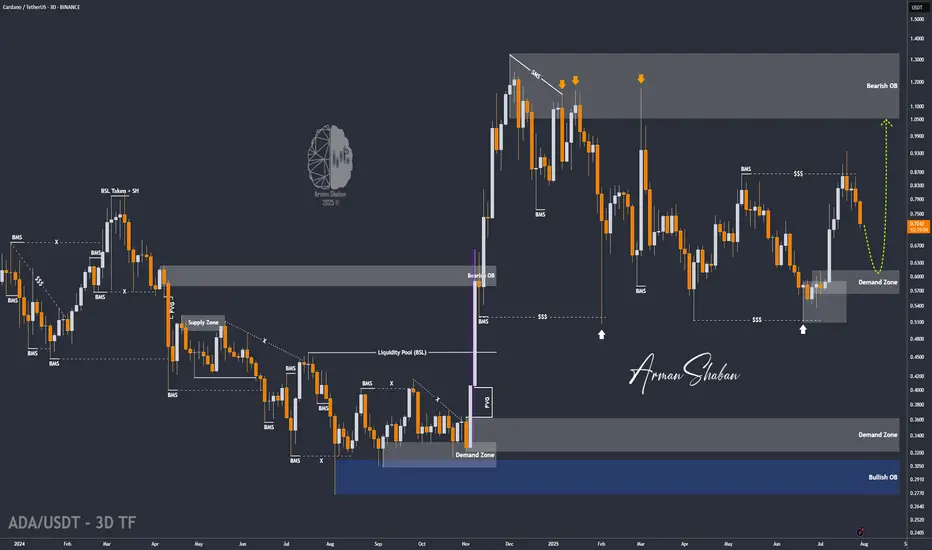
ADA/USDT | ADA Slips Below Support – Watching $0.61 for Support!By analyzing the Cardano chart on the 3-day timeframe, we can see that the price failed to hold above the $0.75 support and is currently trading around $0.72. Given the current momentum, a deeper correction for ADA seems likely. If the price fails to stabilize above $0.69, we could see a sharp drop toward the $0.61 zone. If ADA reaches this key support area, keep a close eye on it — a strong bullish reaction could lead to the next big upside move!
Please support me with your likes and comments to motivate me to share more analysis with you and share your opinion about the possible trend of this chart with me !
Best Regards , Arman Shaban
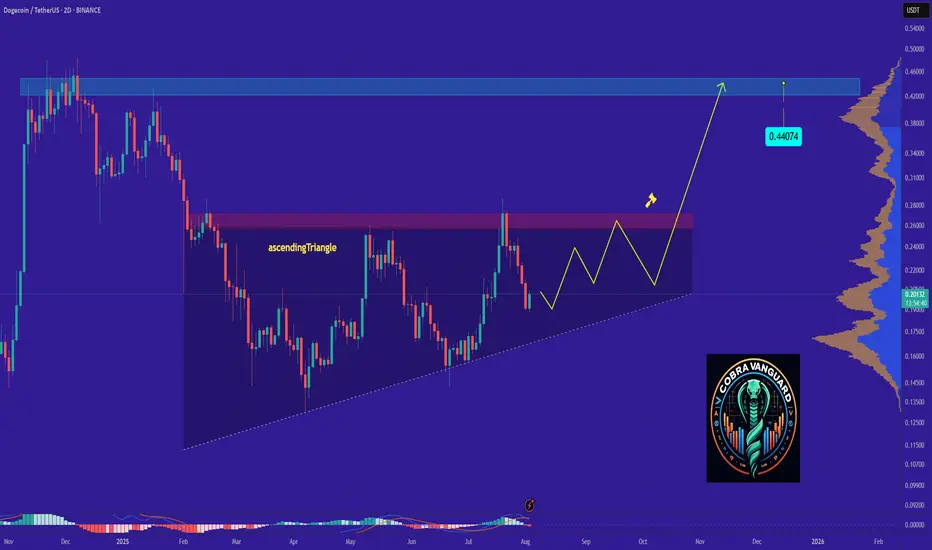
DOGE's Situation, A Comprehensive Analysis !!!The price on the 2d timeframe is within an ascending triangle, which can be promising. If the price breaks this pattern with bullish candles, it could easily rise by the distance of AB=CD .
Best regards CobraVanguard.💚
DOGE COIN made a bottom ? start of a new trend ?preferred counts
everything is on the chart , for this dogecoin if not holding then it will move down more
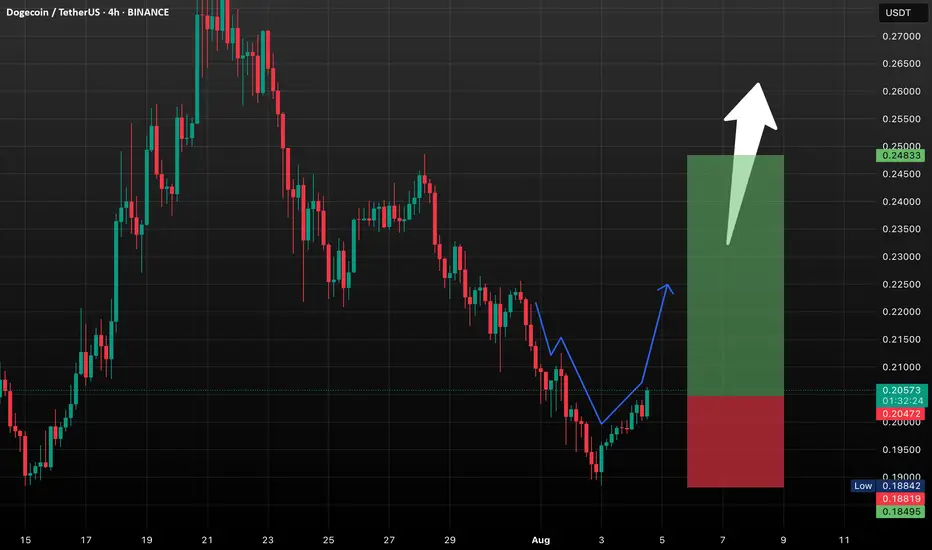
DOGE Setup Heating Up: These Levels Could Define the Next Move!Prediction for the Period Ahead (Next 1–2 Weeks):
*Base case: Holding support at $0.198–$0.200 → test $0.215.
*Bull trigger: Break above $0.215 with volume → possible move to $0.232 and higher.
*Downside risk: Falling below $0.182 could drag the price to $0.175 before any recovery.
DOGE is currently consolidating in a tight range with a neutral to slightly bearish technical bias. However, a breakout above $0.215, particularly supported by volume, could set the stage for further gains targeting $0.232–$0.287 zone. Conversely, a downturn past $0.182 opens the risk of a deeper test toward $0.175. In either scenario, the upcoming weeks seem pivotal...
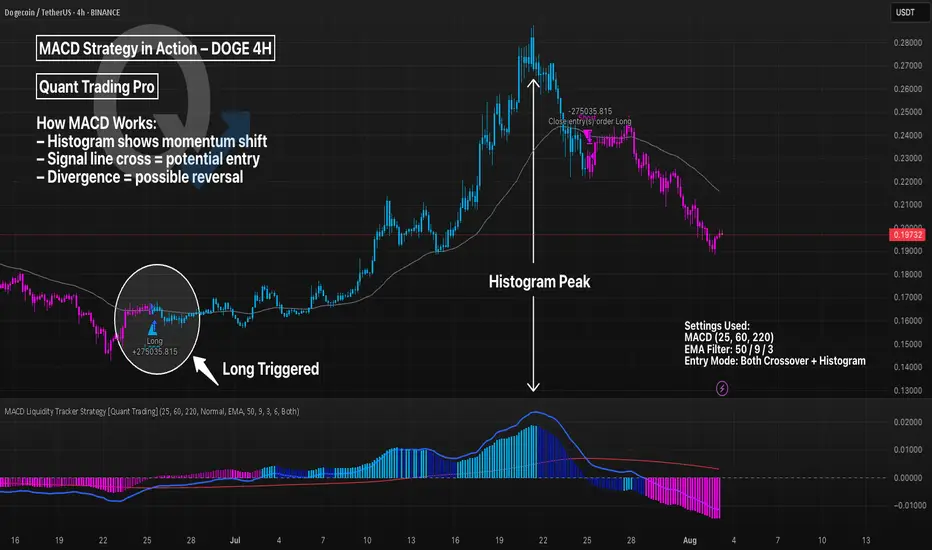
MACD Liquidity Strategy in Action – DOGE 4HThe MACD (Moving Average Convergence Divergence) is a trend-following momentum indicator. It uses two EMAs to generate signals via crossovers and histogram shifts.
This chart shows DOGE 4H with a long-only MACD Liquidity Tracker Strategy, using:
Fast EMA: 25
Slow EMA: 60
Signal Line: 220
These longer settings reduce noise and provide higher-conviction swing entries, though at the cost of late signals.
💡 Tweak Tip:
Lower values (e.g. 12/26/9) = more signals, better for scalping
Higher values (e.g. 25/60/220) = fewer signals, better trend filtering
Adjust the EMA filter (50/9/3 here) to match asset volatility
📊 Use MACD for:
Trend continuation confirmation
Exit timing via histogram fading
Divergence spotting (momentum vs price)
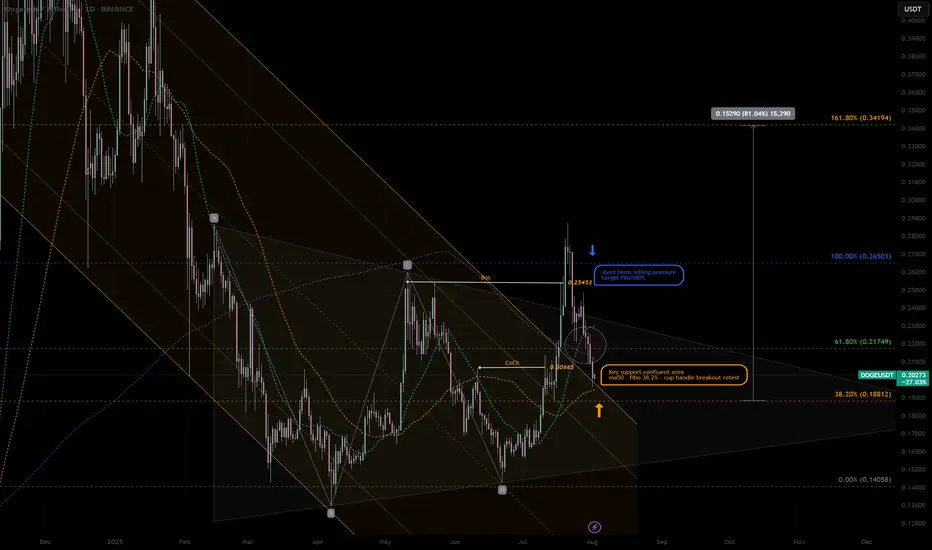
DOGEUSDT|Pullback Confluent Support -cup&handle next ext. +80%DOGE - retraced at the confluent support zone, high potential pullback buy position:
- SMA50 Dynamic support—often attracts mean-reversion buys.
- cup & handle support retest Price retested prior breakout zone—flips resistance to support.
- key 38% Fib “sweet spot” pullback level after corrective moves.
- Previous Change of Character marks shift from bearish to bullish structure—support confluence.
Potential Entry & Risk Management
Entry Zone
- Aggressive: immediate handle breakout support
- Conservative: Wait for liquidity pattern and re-bounce confirmation candle above SMA50
Stop-Loss
-Below Cup Handle low -10% larger position prior swing high RR:2.5/1
-Suggested SL: previous low -0.17 USDT - 5% below entry
Initial Targets
-Key resistance 61.8% Fib retracement — 0.217 USD
-100% Prior swing high — 0.26 USD
-162% Next extended target - 0.35 USD
Trade Rationale
-Mean-reversion into SMA50 and Fib 38.2% zone aligns multiple buyers.
-Pattern support: Cup & handle retest confirms breakout strength.
-Structure flip: CoCh zone indicates bullish regime shift.
Watch-Outs
-Rejection below 0.188 USD erodes support cluster—invalidates setup.
-Rising volume on bounce is crucial—low-volume lifts often fail.
-Beware broader market sell-offs impacting altcoins.
Next Steps:
-Monitor 4-hour candlestick close inside entry zone.
-Check volume spike on reversal candle.
-Adjust risk dynamically if price gravitates toward upper channel resistance.
Always trade with affordable risk and respect your stop..
SOL/USDT | NFP Volatility Could Trigger Drop Toward $154!By analyzing the Solana chart on the daily timeframe, we can see that the price is currently trading around $169. If it fails to hold above the $168 level, a deeper drop could follow. With the upcoming NFP data release, increased volatility is expected across the markets. If Solana begins to decline, the potential correction targets are $163, $157, and $154. Watch the $145–$154 zone closely for a possible bullish reaction and buy opportunity.
Please support me with your likes and comments to motivate me to share more analysis with you and share your opinion about the possible trend of this chart with me !
Best Regards , Arman Shaban
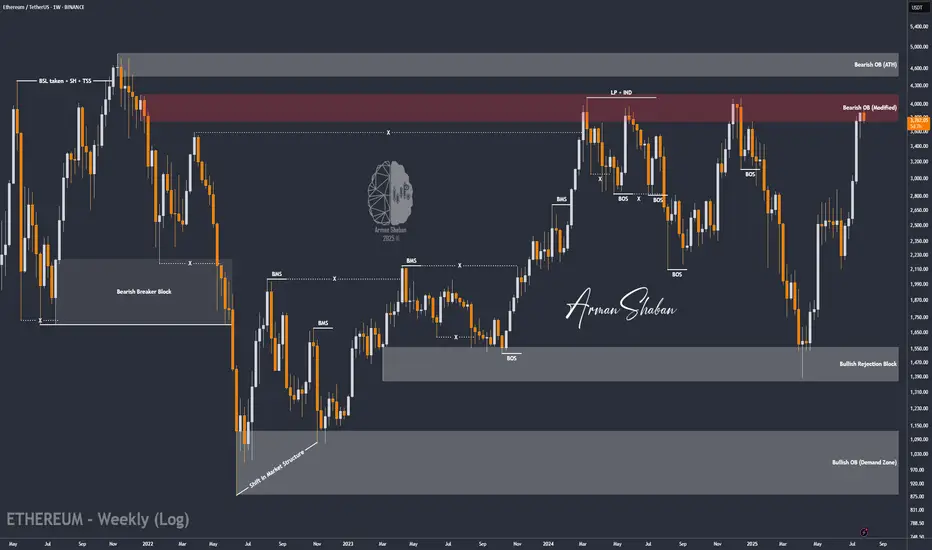
ETH/USDT | ETH Under Pressure – Watch $3500 Support!By analyzing the Ethereum chart on the weekly timeframe, we can see that after reaching the $3940 zone, ETH faced selling pressure and is now trading around $3540. If the price fails to hold the key $3500 support, a deeper decline is likely, with potential targets at $3040 first and possibly $2680 as the second bearish target.
Please support me with your likes and comments to motivate me to share more analysis with you and share your opinion about the possible trend of this chart with me !
Best Regards , Arman Shaban

Why DOGE Remains Bullish and Its Next Potential Move !It appears that the price is forming a cup and handle pattern, and if this occurs, it could push the price above $0.30.
Best regards CobraVanguard.💚
Bears Target $0.14 DOGE — Is the Trend Your Friend?DOGEUSDT has been in a clear downtrend since late July, printing consistent lower highs and lower lows. The current market structure shows sellers firmly in control, with every bullish bounce quickly fading. The recent rejection near $0.2244 and the inability to sustain above the $0.21 zone highlight persistent selling pressure.
At the moment, DOGE is hovering around $0.2043, just under a short-term resistance band between $0.2067 and $0.2090. This area has acted as a rejection point in the last few sessions, suggesting that unless bulls can break above it with strong volume, the path of least resistance remains downward. Below, the first major support sits at $0.1855. If that breaks, the selling could accelerate toward $0.1680, a level that aligns with a previous consolidation base from June. In an extended decline, $0.1427 comes into view as a long-term support level that previously acted as a strong demand zone.
The chart also shows an active short trade setup in play:
• Entry: $0.2043
• Stop-Loss: $0.2244
• Targets: TP1 at $0.1855, TP2 at $0.1680, and TP3 at $0.1427
From a risk-reward perspective, this setup remains attractive, especially if the price breaks below $0.1855. However, traders should watch for any bullish invalidation signs — a close above $0.2136 could challenge the short bias, while a sustained break above $0.2244 would signal a possible trend shift. Until then, the broader technical picture still favors the bears.

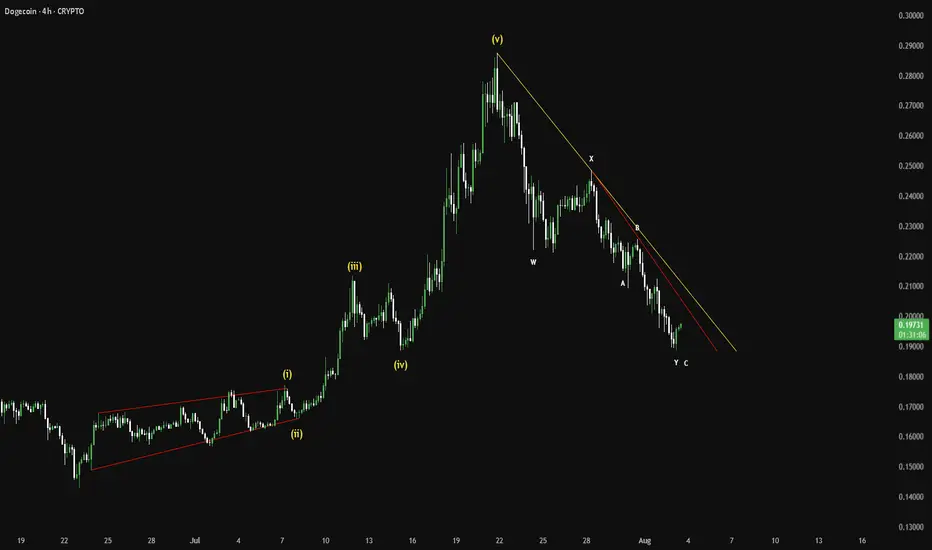
DOGE (Y25.P3.E1). More lows to come before a longHi traders,
My thoughts on taking a short trade on Doge
why?
confluence on … 200 D ema, Avwap , previous support, etc
All the best,
S.SAri.

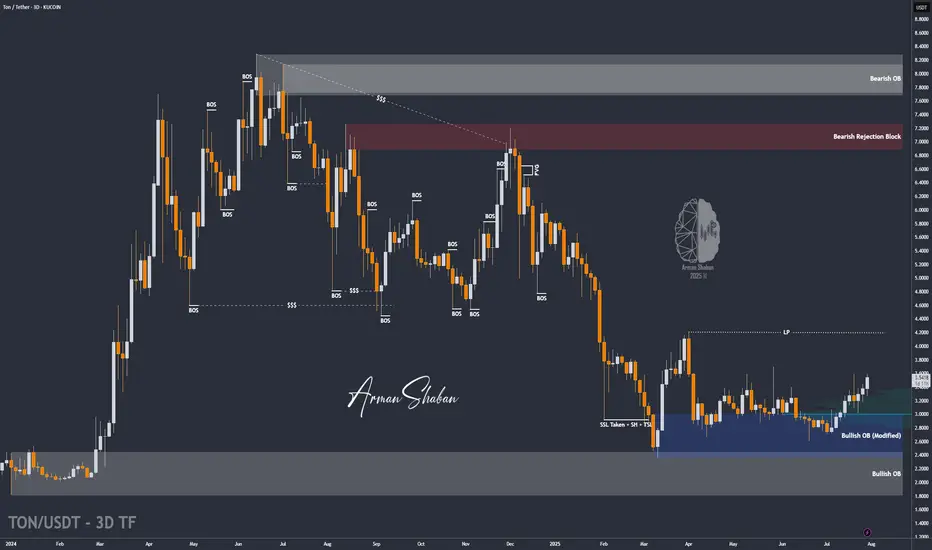
TON/USDT | Surges 18% – Eyes on $3.63, Then $4.20 and $4.68!By analyzing the Toncoin chart on the 3-day timeframe, we can see that after a pullback to the $3 area, strong demand kicked in, and within just one week, the price surged over 18%, reaching above $3.5. Toncoin is currently trading around $3.53, and I expect it to hit the $3.63 target soon. The next bullish targets after that are $4.20 and $4.68.
Please support me with your likes and comments to motivate me to share more analysis with you and share your opinion about the possible trend of this chart with me !
Best Regards , Arman Shaban
DOGE/USDT | Eyes Bounce from Key Support – Next Targets Ahead!By analyzing the Dogecoin chart on the daily timeframe, we can see that after reaching the $0.29 area, the price entered a correction and is now trading around $0.22. If DOGE dips into the key support zone between $0.19–$0.21, we could expect a strong bullish reaction. The next potential targets are $0.287, $0.32, $0.41, and $0.70.
Please support me with your likes and comments to motivate me to share more analysis with you and share your opinion about the possible trend of this chart with me !
Best Regards , Arman Shaban

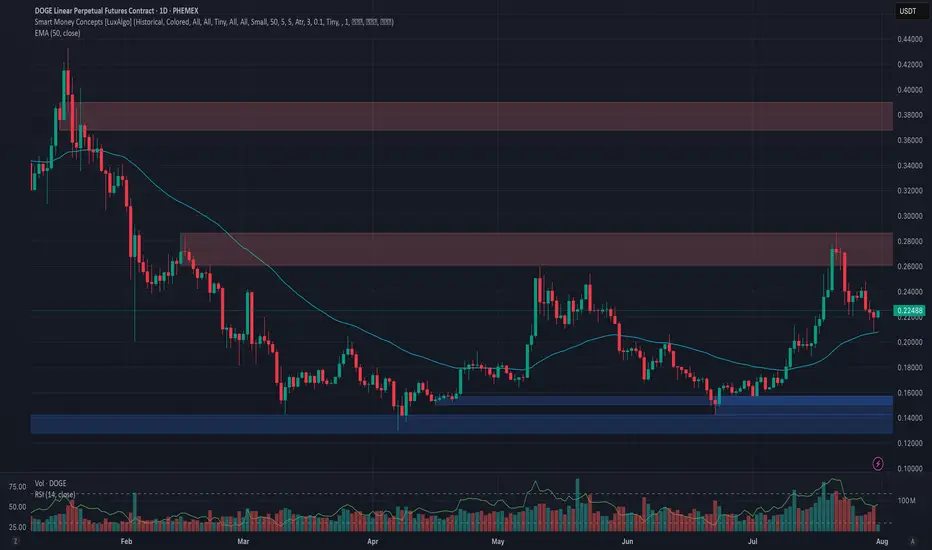
Phemex Analysis #101: Is Dogecoin (DOGE) Ready to Moon Again?Dogecoin ( PHEMEX:DOGEUSDT.P ), the original meme cryptocurrency, is once again capturing investor attention, fueled by impressive bullish movements. Currently trading around $0.2245, DOGE surged approximately 70% in July, decisively breaking the key resistance at $0.22 and challenging the next resistance level near $0.28.
With whale accumulation intensifying, renewed retail investor enthusiasm, and heightened speculation surrounding possible ETF approvals, Dogecoin appears poised to potentially sustain or even amplify its recent gains. But the key question remains: is DOGE truly ready to moon again, or is caution necessary following such rapid price movement?
Let’s carefully explore a few potential scenarios to inform your trading strategies:
Possible Scenarios
1. Bullish Continuation—Targeting Higher Levels
After successfully breaking above the crucial $0.22 resistance, Dogecoin could maintain its upward momentum if buying pressure remains strong. In this bullish scenario, DOGE might swiftly retest the immediate resistance at $0.25, then target higher levels near $0.28, and potentially surge toward the significant resistance at $0.39.
Pro Tips:
Entry Signals: Watch for a confirmed breakout above $0.25, especially if accompanied by rising trading volume, as a potential bullish entry point.
Profit-Taking: Strategically secure partial profits at resistance zones around $0.28 and $0.39.
Risk Management: Implement tight stop-loss orders just below the key support at $0.20 to guard against unexpected reversals.
2. Retest and Accumulation—Neutral Scenario
Given DOGE’s rapid price rise, a short-term pullback towards previous resistance-turned-support at $0.22 or even $0.20 is plausible. Such retracements, particularly on decreasing volume, might signal healthy consolidation, setting the stage for future bullish momentum.
Pro Tips:
Buying Opportunities: Look to accumulate DOGE if a low-volume pullback occurs toward support zones around $0.22 or $0.20.
Monitor Volume: Observe closely for decreasing trading volume during retracements, which typically indicates positive consolidation rather than a bearish reversal.
3. Bearish Scenario—Deeper Correction Possible
Should overall market sentiment shift negatively or DOGE fail to hold crucial support at $0.22, bearish pressure could escalate, potentially pushing Dogecoin down to deeper support levels around $0.198, and possibly as low as $0.15 or $0.13.
Pro Tips:
Risk Management: Consider reducing or exiting positions if DOGE decisively breaks below $0.22 on increased selling volume.
Long-Term Accumulation: Long-term holders may strategically accumulate DOGE at historically strong support levels ($0.15 or $0.13) once price stabilization occurs.
Conclusion
Dogecoin (DOGE) stands at a pivotal point, balancing bullish enthusiasm against the possibility of a correction. Traders should carefully monitor resistance at $0.25, the critical support at $0.22, and closely observe volume dynamics. By strategically aligning their trades with these outlined scenarios and employing disciplined risk management, traders can confidently navigate DOGE’s volatility and potentially capitalize on its next significant move.
🔥 Tips:
Armed Your Trading Arsenal with advanced tools like multiple watchlists, basket orders, and real-time strategy adjustments at Phemex. Our USDT-based scaled orders give you precise control over your risk, while iceberg orders provide stealthy execution.
Disclaimer: This is NOT financial or investment advice. Please conduct your own research (DYOR). Phemex is not responsible, directly or indirectly, for any damage or loss incurred or claimed to be caused by or in association with the use of or reliance on any content, goods, or services mentioned in this article.
DOGE 4H – Strong Support Test Before Alt-Season??DOGE is approaching a pivotal support zone on the 4H chart — the same area that acted as the breakout base in mid-July before price surged nearly 40% higher. This horizontal level is now being tested again, offering a potential opportunity for trend continuation if bulls can defend it.
The support zone also aligns with an ascending trendline that has been respected for nearly a month, creating a key confluence point. Combined with an oversold Stochastic RSI reading, the setup is beginning to show early signs of a potential reversal — but confirmation is still needed.
Price structure remains technically bullish unless this area breaks. A clean bounce here could trigger a new wave toward the prior high at $0.29. On the flip side, a breakdown of this confluence zone would invalidate the current trend structure and likely target the $0.19–0.20 region.
📊 What I’m Watching For:
– Bullish price action (e.g., hammer candle, engulfing) off this zone
– Higher low confirmation with volume
– Trendline retest and hold
– Momentum alignment with RSI/Stoch flip
DOGE remains one of the more technically clean charts among majors — but holding here is key. Watching closely.

Dogecoin - It is all totally expected!🐶Dogecoin ( CRYPTO:DOGEUSD ) will break out soon:
🔎Analysis summary:
Just this month, Dogecoin perfectly retested a significant confluence of support and is starting the expected rejection. With bullish momentum picking up, there is a very high chance that Dogecoin will break the all time high in the near future.
📝Levels to watch:
$0.5
🙏🏻#LONGTERMVISION
SwingTraderPhil

DOGE Looking Strong as Support HoldsDOGE Looking Strong as Support Holds
🔹 1. Support Zone Validated
The chart shows Dogecoin retested the lower boxed region around $0.221–$0.223, and bounced sharply from that zone. Given the heavy spike in volume during the retest, this suggests aggressive buying and accumulation—a hallmark of bullish conviction.
CryptoRank
The Tradable
🔹 2. Fibonacci 0.618 Support Bounce
On the 4‑hour timeframe, DOGE held firm above the critical Fibonacci 61.8% retracement level, and delivered a strong rebound—indicating technical significance and buyer interest at this level.
Blockchain News
🔹 3. Double-Bottom + Trendline Breakout
Analysts have identified a classic double-bottom formation, with price clearing the neckline (~$0.230–$0.231) and then retesting it successfully. Holding this retest confirms a breakout, suggesting more upside ahead.
Crypto Basic
🔹 4. Whale Activity & Accumulation
On-chain data shows $250 million in Dogecoin accumulation by whales, especially around the support zone—creating a structural demand base and reinforcing the bullish setup.
CoinCentral
🎯 Price Targets & Key Levels
Scenario Levels Rationale
Bullish continuation $0.239–$0.241 union resistance First resistance zone—price must reclaim to continue bullish momentum
$0.260–$0.280 Reclaiming $0.241 could open room toward mid‑channel resistance or prior highs
$0.300+ Potential target if momentum sustains and broader breakout occurs
Bearish invalidation $0.223 support Invalid break below suggests fading momentum—risk of correction to $0.215–$0.218
$0.215–$0.218 Secondary support zone if expansion of sell side continues
⚙️ Trade Setup for a Bullish Bias
Entry Focus: Consider entering long near $0.223 if price retests and holds, with a tight stop just below support.
Stop-Loss Zone: Slightly beneath $0.221 to account for volatility.
Targets: Scale out around $0.241, with larger targets at $0.260–$0.280, and possibly $0.30+ on sustained strength.
Confirmation: Watch for rising volume, break and close above resistance zones, and bullish indicator alignment.
⚡ Market Sentiment & Broader Themes
Momentum Shift: A bearish retrace reversed quickly amid accumulation, suggesting strong buyer commitment.
CryptoRank
The Tradable
AInvest
Double Bottom Status: Analyst commentary supports a reversal setup, with targets toward $0.310–$0.46 if the neckline holds.
Crypto Basic
AInvest
CryptoRank
Macro View: DOGE remains within a bullish channel; some forecasts project

ETH/USDT | at a Crossroads – Hold Above $3440 or Sharp Fall!By analyzing the Ethereum chart on the weekly timeframe, we can see that after reaching $3940 and touching the key supply zone, ETH entered a slight correction and is currently trading around $3756. The key question now is whether it can hold above $3440 by the end of the week and push past $4000. If it does, we can expect another bullish leg toward $4100 and $4470. However, if the $3440 support fails, a sharp decline may follow — so this level is critical.
Please support me with your likes and comments to motivate me to share more analysis with you and share your opinion about the possible trend of this chart with me !
Best Regards , Arman Shaban
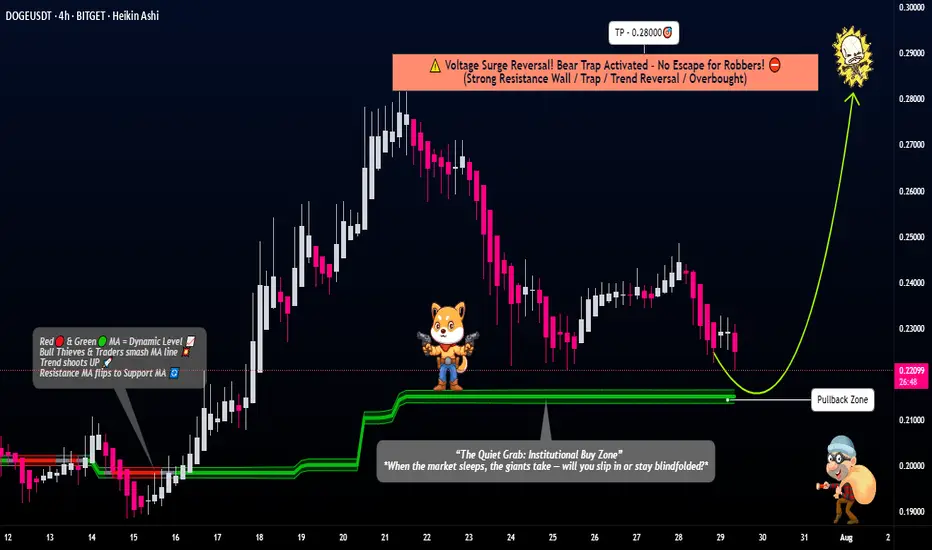
Thief Strategy Unlocked: DOGE/USDT Swing Robbery🐕💸 "DogeCoin Heist Plan: Swipe the Vault Before the Bark Bites!" 💥🔐
🌍 Hi! Hola! Ola! Bonjour! Hallo! Marhaba! 🌍
🎩 Welcome back, Money Makers & Market Robbers! 🏴☠️
💥 This is your DOGE/USDT (Dogecoin vs Tether) Crypto Market Heist Plan – fully loaded with Thief Trading Style tactics combining technical firepower 🔥 and macro intel 📊 for a high-voltage entry!
💣 Plan of Attack: The Robbery Blueprint 📈
🎯 Entry Point:
🟢 The vault's wide open! Enter LONG at any price—pullback is your sneak path in.
Set your BUY LIMIT orders using 15m or 30m timeframes at the recent swing zones.
Layer them like a pro 💹 with DCA (Dollar Cost Averaging) precision.
🛑 Stop Loss (SL):
👂 "Listen up!" Don’t slap a stop loss before the pullback confirms—it’s like triggering the alarm too early!
📍 Thief's SL placed only after pullback occurs—use the 4H swing low around 0.19000.
✍️ Adjust SL based on your risk appetite, lot size, and number of entries.
🏁 Target Zone:
🎯 Aim for 0.28000, or make a stealthy exit before the escape door shuts.
💰 Special Note for Scalpers:
Only go LONG—this market’s barking up, not down!
Big pockets? Straight in.
Smaller stack? Join the swing crew and rob with patience.
Use a trailing SL to secure the loot 🏆.
📊 Market Overview:
Currently bullish bias due to:
Macro inflows
Risk sentiment shift
Volume surge
On-chain support
Check 📡: Fundamentals | COT | Intermarket | Sentiment | Price Action.
⚠️ Heist Hazard - News Alert:
📰 Don’t enter new positions around high-impact news.
Set trailing SLs to guard your open trades during these volatile spikes.
💖💬 Robbers' Call to Action:
💥 Hit that BOOST Button on the idea 💥
Not just for likes—it fuels our squad’s energy and signals more Thief Heist Plans are coming 🐱👤💸
Let’s rob these charts—strategically, smartly, & silently.
📌 Stay Tuned for more explosive trade setups from the vault of Thief Trader.
🤑🛸 Trade smart. Trade bold. Trade like a Thief.
TradeCityPro | DOGE Faces Resistance with Altseason Tailwinds👋 Welcome to TradeCity Pro!
In this analysis, I want to review the DOGE coin for you. One of the first and most popular shitcoins in crypto, which managed to attract a very strong market cap during the previous bull run due to the hype around Elon Musk.
🔍 Currently, this coin has a market cap of $34.06 billion and ranks 8th on CoinMarketCap.
📅 Daily Timeframe
In the daily timeframe, this coin has created a very strong support level at 0.15190, and now after a bullish leg, it has formed a top at 0.27359.
📊 The buying volume increased nicely during this bullish leg, and the price moved up to the 0.27359 resistance.
✔️ Now, after the first touch, the price has started a slight correction and is moving downward. If further touches occur, we can open a long position after breaking the top.
📈 Breaking 0.27359 could be one of those positions that stays open all the way up to 0.46496, and we can buy this coin in spot using the profit from that trade. I will try to have a position open after breaking 0.27359, aiming for 0.46496.
💥 The next trigger we have is the break of 0.31222, but the price should first form some structure after reaching that area, and only after confirmation should we open a position. Just entering based on that break doesn’t seem logical to me.
🔽 If a correction and drop happen, as long as the price stays above 0.15190, there’s no problem for the trend to continue. But if the price stabilizes below that level, a trend reversal might occur.
📝 Final Thoughts
This analysis reflects our opinions and is not financial advice.
Share your thoughts in the comments, and don’t forget to share this analysis with your friends! ❤️
