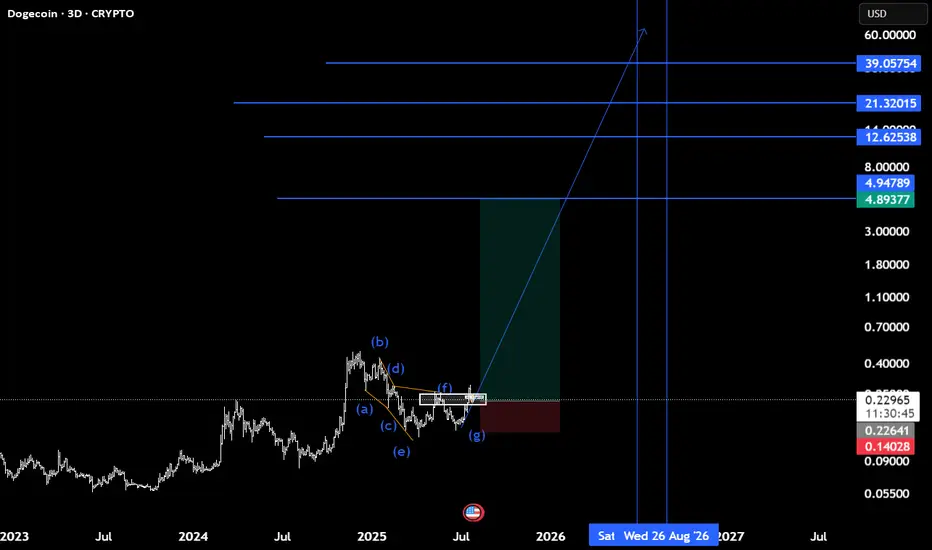
Doge(based on NEo wave)confirmation of finishing the E wave of triangle is here now.
it takes about 400 days for all targets to pass.
see the related last chart of doge.
Dogecoin
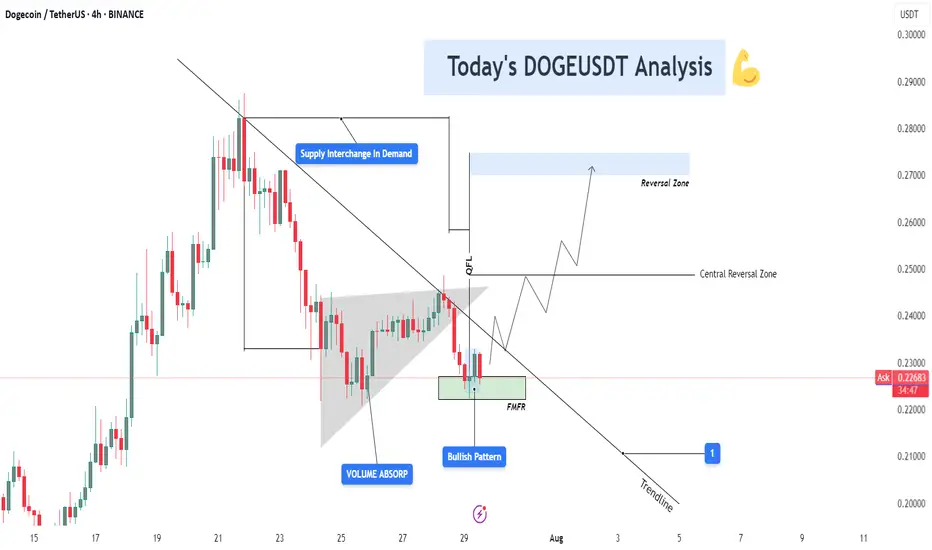
DOGEUSDT 4H – Bullish Reversal Building from FMFR Zone📊 Chart Context & Market Maker Concept Breakdown
DOGEUSDT on the 4H timeframe is setting up for a potential trend reversal, following a structured retracement into a strong demand zone that aligns with multiple smart money confirmations: QFL base, trendline break, volume absorption, and FMFR (Final Move Final Reaction). Let’s dive into the technical layers of this setup:
🔻 1. Downtrend Phase & Structure Setup
After peaking near $0.29, DOGE entered a controlled downtrend, respecting a descending trendline and forming a consistent lower-high structure.
Each rejection from the trendline reflects institutional distribution, gradually pushing price into lower demand levels where value buyers can step in.
🔄 2. Supply Flips into Demand (S/D Flip Zone)
A key level near $0.225 – $0.230 initially acted as a supply zone — but following QFL logic and smart money reaccumulation, it is now showing signs of demand activation.
The chart highlights “Supply Interchange in Demand”, which means that this zone has been repurposed — from distribution to accumulation — another MMC footprint.
📌 Interpretation: This is where large players flip their position bias and start loading for the next leg up.
🔵 3. Volume Absorption Confirmed
Prior to the current bounce, a strong volume absorption phase was detected within a falling wedge or triangular base, shown on the chart.
Despite sell-side pressure, buyers continued to absorb orders — a sign that selling is weakening, and accumulation is underway.
📌 Clue: Volume absorption often precedes an explosive breakout, especially when aligned with FMFR or QFL patterns.
🔁 4. Final Move Final Reaction (FMFR)
Price tapped into the green box zone one final time, marked as FMFR (Final Move Final Reaction) — a key MMC reversal signal.
This occurs when market makers fake a breakdown (creating panic) and then sharply reverse, trapping breakout sellers and scooping up liquidity.
A small bullish candle formation (Bullish Engulfing / Pin Bar) can be seen within this zone — the “Bullish Pattern” label marks this.
🧠 Smart Money Logic: Institutions want liquidity. FMFR fakes weakness to attract retail shorts, then reverses to ride liquidity to the upside.
🔗 5. QFL Base + Break of Structure Setup
A QFL (Quick Flip Level) pattern is forming. This represents a market structure flip, where price first drops from a base, reclaims it later, and continues in the opposite direction.
Breaking this base and confirming above it would mark a true reversal in structure.
🛠️ Technical Confluences at Work
Element Insight
🔹 QFL Structure Base level reclaim in play (structure shift)
🔹 Volume Absorption Smart money soaking up sell pressure
🔹 FMFR Reaction Final stop hunt before the rally begins
🔹 S/D Flip Supply turned to demand near $0.225 zone
🔹 Bullish Pattern Early confirmation of reversal
📈 Projection Path & Reversal Zones
Two projected zones are mapped for price behavior:
🔸 Central Reversal Zone (~$0.250):
First significant resistance where price may pause or react.
Ideal partial profit level or re-entry after pullback.
🔹 Main Reversal Zone (~$0.270–0.275):
Target area for a full liquidity sweep.
This was a previous high-volume supply zone.
If price reaches here, expect potential rejection or distribution unless momentum is strong.
🎯 Trade Setup Strategy (Based on Your Chart)
Entry Area: $0.225 – $0.229 (FMFR Reversal Zone)
Stop-Loss: Below $0.221 (beneath FMFR low)
Take Profit 1: $0.250 (central zone)
Take Profit 2: $0.270 – $0.275 (main reversal zone)
📐 Risk-to-Reward:
TP1: 1:2
TP2: 1:3+ depending on entry timing
🧠 Psychology Behind the Setup
This DOGE setup is engineered to trap emotional traders:
Retail sellers enter late near the bottom.
Smart money waits at FMFR zone, absorbing liquidity.
Volume builds quietly.
Market reverses explosively, catching retail off guard.
By recognizing this setup early, you’re aligned with Market Makers, not against them.
Dogecoin · Risk of Much Lower is MinimumWe start the process by looking at a few charts. We start with the big projects in order to gain a perspective of the bigger picture. After reviewing 10-20 charts, we start to get an idea, but we don't form any picture in our minds, we just continue reading; reading the articles and reading the charts.
After just 10 days, we have anywhere between 80 and 100 articles/charts. Now we have a better picture of the market. We know how each sector is doing and this further helps us develop our bigger picture, the one that will help us call the shots.
After we review 150 to 200 charts and trading pairs, we get the pulse of the market. Where the energy flows, our attention goes and sometimes our attention reaches before the energy and this gives us an entry prize.
It will continue to work in this way. If you look at the market daily, read open to accepting new information, accepting always that I can be wrong, we can continue to develop a sense of what is really happening.
Dogecoin is making a minor pause after weeks of sustained growth. It is normal, if the market is going to be growing for months, everything cannot happen in a day. Five steps forward, three steps back.
Namaste.
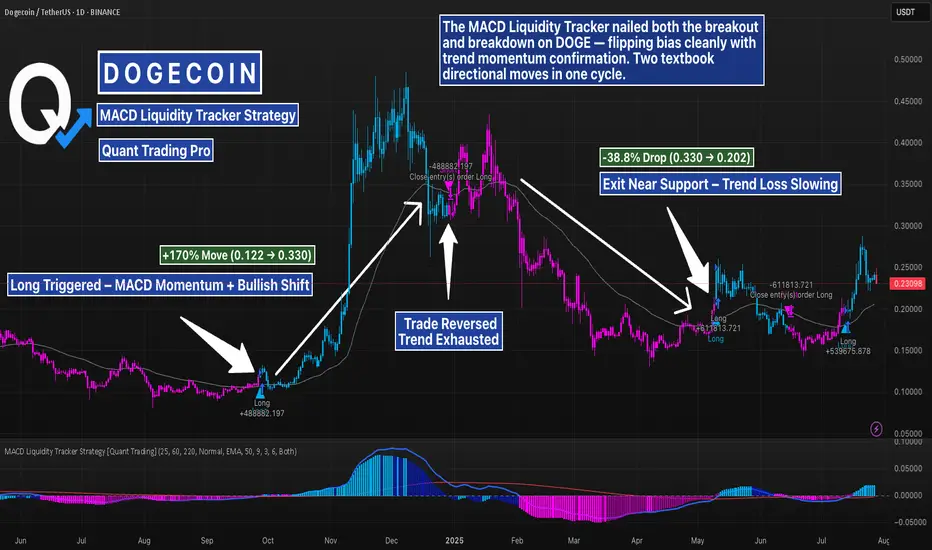
DOGE MACD Liquidity Tracker Strategy – Trend Flip & Breakdown 1DThis DOGE 1D chart highlights two key directional shifts caught by the MACD Liquidity Tracker Strategy — a bullish breakout near $0.12 and a clean reversal near $0.33. The system flipped long once MACD momentum aligned with trend structure, and later rotated bearish as the trend exhausted.
Both moves were captured without guessing — using dynamic trend coloring and a momentum-backed entry logic. Visual bias (blue/pink) helps contextualize the trend at a glance, and the EMA filters reduce chop during sideways conditions.
To explore this setup yourself, search for the strategy by name and run your own backtests to refine inputs per asset and timeframe.
📊 Strategy Name:
MACD Liquidity Tracker Strategy
This is one of several strategy visualizations — more incoming.
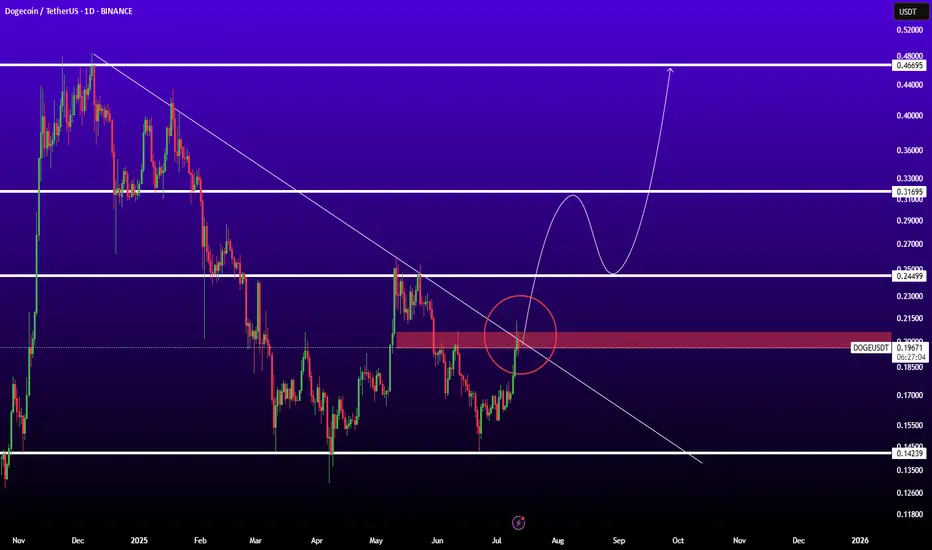
DOGEUSDTBINANCE:DOGEUSDT is in good level for pump because if breaked trendline and resistance 0.200$ ready for sharp movement to next levels.
Resistances: 0.25 - 0.32 - 0.45
Support: 0.15
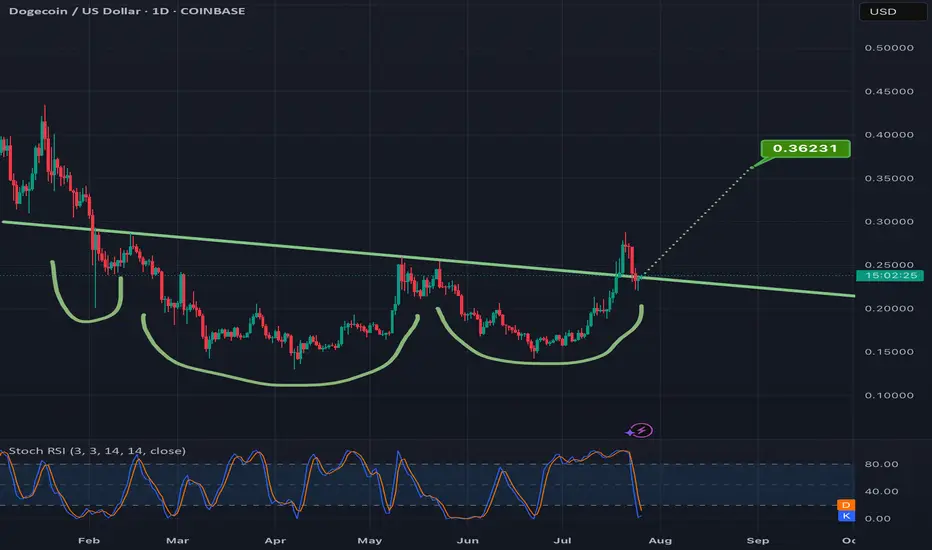
Confirming the breakout of this invh&s on doge can = 50% gainsAlready went above the neckline once and the current daily candle is currently back above the neckline for a second time. Hitting the full target would mean a good 50% gain from current price. *not financial advice*
DOGE 30m – Trendline Break + Bearish Divergence = Clean ReversalThis DOGE 30-minute chart offered a textbook reversal sequence:
Price was riding a clean ascending trendline with support from moving averages and strong bullish structure. But things shifted fast.
We saw:
– A clear MACD bearish divergence (momentum fading as price pushed higher)
– A trendline break and lower high, signaling loss of bullish control
– Former support flipped into resistance, confirming the structure shift
– Price now consolidating near the last major demand zone
If this zone breaks, expect continuation lower. If it holds, this could become a temporary bounce area — but momentum is clearly in the bears’ hands for now.
Zoom out for confluence and track price behavior around this zone for your next move.
#DOGE #CryptoTrading #TechnicalAnalysis #MACD #ReversalSetup #TrendlineBreak #SupportResistance #QuantTradingPro

#DOGE/USDT falling wedge#DOGE
The price is moving within a descending channel on the 1-hour frame and is expected to break and continue upward.
We have a trend to stabilize above the 100 Moving Average once again.
We have a bearish trend on the RSI indicator, supporting the upward break.
We have a support area at the lower boundary of the channel at 0.22270, acting as strong support from which the price can rebound.
We have a major support area in green that pushed the price upward at 0.21777.
Entry price: 0.2320
First target: 0.24210
Second target: 0.25380
Third target: 0.26920
To manage risk, don't forget stop loss and capital management.
When you reach the first target, save some profits and then change the stop order to an entry order.
For inquiries, please comment.
Thank you.

The Pullback Panic? Your Whole Plan Dies?!!!!!One red candle is all it takes to destroy your entire plan.
Why do we panic so fast? Why do we exit too early before a rally?
And worse: why do we FOMO back in at the worst possible time?
Hello✌️
Spend 3 minutes ⏰ reading this educational material.
🎯 Analytical Insight on Dogecoin:
BINANCE:DOGEUSDT is approaching the key psychological level of 0.20, which also aligns with a strong daily support and the final Fibonacci retracement zone 🧭. Despite recent volatility, it continues to hold its mid-range Fib level, suggesting potential accumulation. If this support holds, a rebound toward the 0.30 resistance — a move of around 27% remains on the table 🎯.
Now , let's dive into the educational section,
🧠 The Victim Mindset in Crypto Markets
Here’s the uncomfortable truth.
Most traders believe they’re making rational decisions but in reality, they’re reacting emotionally to past pain.
One bad experience during a correction makes us fear all pullbacks.
Missing one big rally creates constant FOMO.
We can’t handle drawdowns but we accept buying tops again and again.
It’s not just you. This is how most retail traders operate and whales know it.
🐳 How Whales Profit From Our Fear
Whales never buy during hype. They buy during fear.
Mini pullbacks, shakeouts and false breakdowns are designed for one thing.
To make you exit so they can enter.
A red candle, a small wick, maybe a fake support break.
We sell out of fear, they buy the dip.
We FOMO back in too late.
Pullbacks are not just price moves. They are psychological traps.
📈 How to Break This Cycle
You don’t need to predict the future. You need to understand yourself.
Ask if this correction is technical or emotional.
Use confirmation from volume, OI and divergence.
Enter after traps, not inside them.
Question your feelings before every move.
You are not trading the chart. You’re trading your mind reacting to the chart.
📊 TradingView Tools to Escape the Fear Greed Cycle
TradingView gives you access to several practical indicators that can help protect your capital from emotional decision-making.
🔹 Fear and Greed Index (Crypto)
Simple but powerful. When the index drops below 30, most traders are in panic mode. That is exactly where whales accumulate, while we run away.
🔹 Open Interest Heatmaps
When open interest rises but price stays flat, it often signals an upcoming shakeout. One scary-looking red candle and the weak hands are gone.
🔹 Volume Profile and VPVR
Perfect for distinguishing between healthy corrections and manipulative dumps. If price pulls back but buying volume remains strong, it's not a real sell-off. It’s a trap.
🔹 Divergence Indicators like MACD or RSI
If RSI rises during a pullback, there’s a hidden bullish divergence. Exiting may be the worst thing to do.
🔹 Liquidity Maps
These show where stop losses and liquidation clusters are located. Often before any major move up, the market takes a detour to liquidate these levels.
Use these tools to stop reacting emotionally and start trading rationally.
📍 Final Thoughts
Small corrections are not the enemy.
Your emotional reaction to them is the real threat.
Before you panic-exit, ask yourself if this fear is justified or just mental conditioning.
The market always gives second chances but we rarely wait for them.
✨ Need a little love!
We pour love into every post your support keeps us inspired! 💛 Don’t be shy, we’d love to hear from you on comments. Big thanks , Mad Whale 🐋
📜Please make sure to do your own research before investing, and review the disclaimer provided at the end of each post.

DOGECOIN : Should we expect an increase?Hello friends🙌
📈Given the decline we had, you can see that buyers entered at the specified support and formed a double bottom reversal pattern, which is a strong signal on support.
📉Considering the possible market correction, we placed two more buy levels lower so that we can buy there if the price corrects.
⚠Don't forget about capital and risk management, friends.
🔥Follow us for more signals🔥
*Trade safely with us*

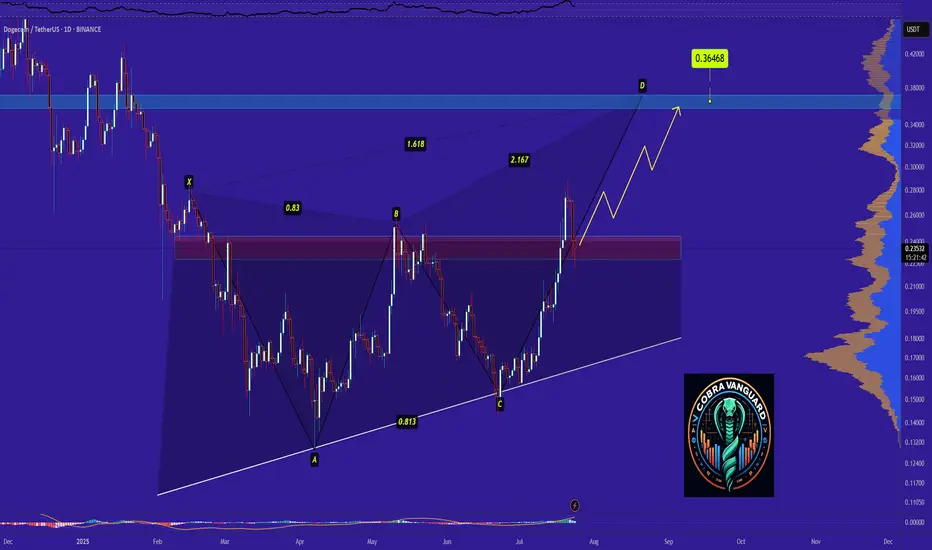
Dogecoin Ready for PUMP or what ?Dogecoin has completed and broken the ascending triangle in the daily timeframe, The price is currently supported well, which can increase the price. I expect the price to rise to around 0.36 .
Stay Awesome , CobraVanguard
DOGEUSDT | Bullish Cup & Handle Revisiting Target +500% (1 USD)?Price Action and Chart Pattern Analysis:
DOGE cup bottom happened around $0.05 with the rim around $0.48. That gives a depth of roughly $0.42. If the breakout occurs near the rim, the measured move target would be $0.90 zone.
This aligns with several analyst projections suggesting DOGE could reach $0.90 to $1.00 if the breakout confirms.
Another way to project this cup & handle is the fibonacci-based target. These levels suggest that if DOGE breaks above the handle and sustains momentum, $0.85–$1.00 is a realistic zone for profit-taking at 161.8% and 200% extension as 1-2-3 wave pattern.
Reliability of the Cup and Handle Pattern for DOGE
The cup and handle is a classic bullish continuation pattern, but when applied to Dogecoin, its reliability depends on several dynamic factors:
Strengths of the Pattern in DOGE’s Context
Historical Accuracy: DOGE has previously respected technical patterns like rounded bottoms or (THE CUP) and breakout channels (THE HANDLE), especially during alt coin rallies.
Current Setup: a well-formed cup and handle on DOGE’s weekly chart, with price rebounding from $0.14 and testing resistance at $0.2 zone which also the key resistance SMA50W and the downtrend channel (the handle)
WATCH OUT: still a possible throw-under pattern or a final bear trap liquidity below previous low!
Key Action: If breakout confirmed with volume > Follow BUY | if not, wait for retraced SMA20 or breakout support.
Always trade with affordable risk and respect your stop...
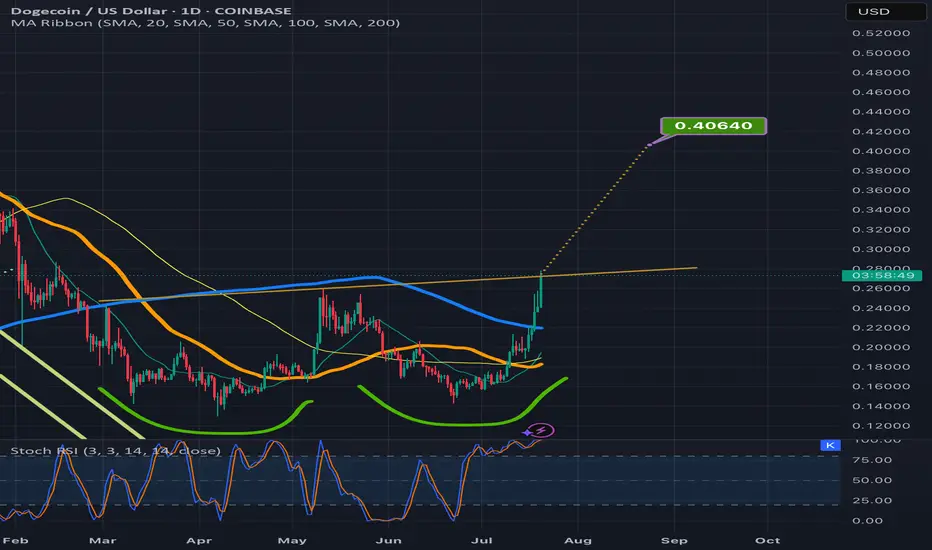
DOGE Strategy — Momentum Entry, MA Trend Hold, Pullback PhaseThis chart showcases how the MACD Liquidity Tracker Strategy performed on DOGE over the past several days. The strategy entered during a clear momentum breakout and trended cleanly above its MA filter for nearly 48 hours.
Let’s break it down:
🔹 First Signal: Early compression breakout long, but price stayed flat. This entry was managed with a tight close before the second impulse began.
🔹 Second Long: Clean breakout on rising momentum — confirmed by MACD histogram expansion and strong Stoch RSI crossover.
🔹 Trend Structure: MA support held multiple times during this move, reinforcing the uptrend. Dotted trendline shows price respecting structure cleanly.
🔹 Exit Trigger: Price began consolidating and histogram showed waning momentum. The strategy correctly exited before the full reversal began.
🔹 Current Action: Pullback in progress. MACD histogram flipping red, Stoch RSI resetting. This may just be a correction… or the trend might be breaking.
📊 This setup is a textbook use of trend filters, confluence, and exit logic — and a good reminder that the strategy isn’t just about entry… it’s about managing exits with discipline.
Whether this develops into a higher low continuation or rolls into full reversal, momentum confirmation is key before the next entry.
#DOGE #TradingStrategy #AlgoTrading #MACDStrategy #QuantTrading #CryptoTechnicalAnalysis #PriceAction #TrendFollowing #Backtesting #CryptoCharts

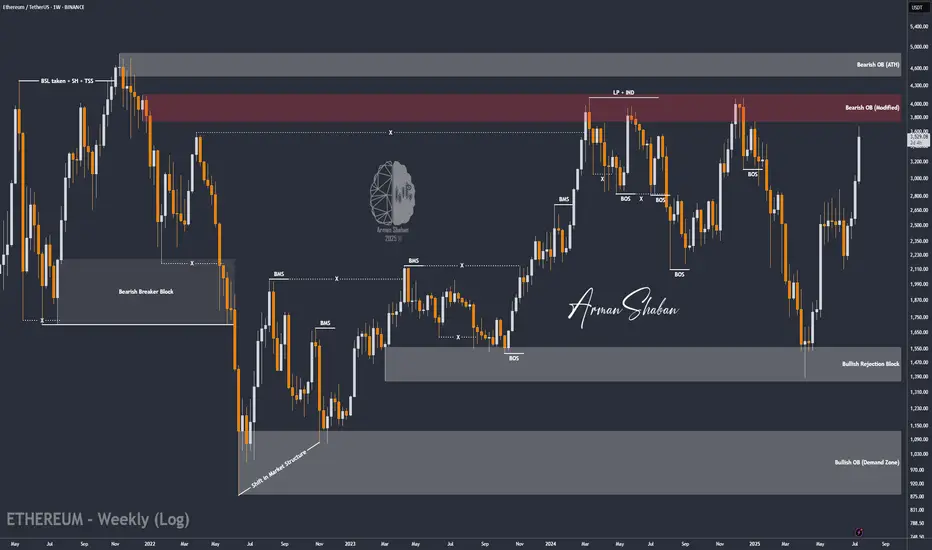
ETH/USDT | The Next Target is $4000 and it's Close! (READ)By analyzing the Ethereum chart on the weekly timeframe, we can see that this cryptocurrency remains one of the strongest major cryptos in the market, continuing its bullish rally despite the overall market correction. It has already hit the next target at $3500, and I believe we might see Ethereum reaching $4000 sooner than expected! Based on previous analyses, if this bullish momentum continues, the next targets will be $3740, $4100, and $4470.
Please support me with your likes and comments to motivate me to share more analysis with you and share your opinion about the possible trend of this chart with me !
Best Regards , Arman Shaban
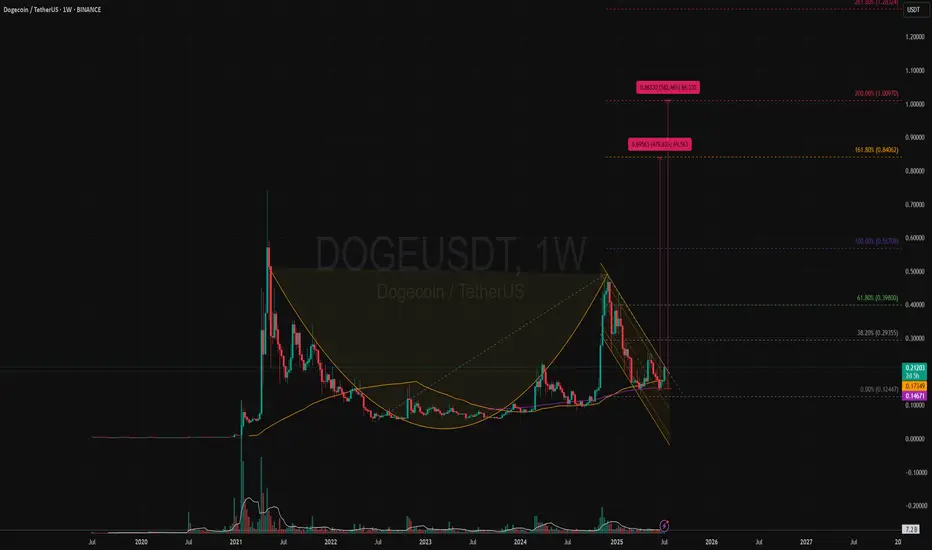
DOGEUSD Is that a textbook Livermore Cylinder to $1.5 ??Doge (DOGEUSD) has been trading within a Bullish Megaphone for the majority of its Bull Cycle since the October 09 2023 Low. We may technically claim that this has been so far one massive Accumulation Phase, along with the rest of the altcoin market.
A pattern that draws strong comparisons with that Megaphone has been 'Livermore's Accumulation Cylinder'. Jesse Livermore, an American stock trader, came with a revolutionary trading pattern a century ago, whose principles often apply perfectly to today's financial assets.
This is what we do on today's Dogecoin analysis, we apply this Accumulation Cyclinder on Doge's Bullish Megaphone. Even though not a perfect fit obviously, the main characteristics apply, with clearly visible Bullish and Bearish Legs.
Based on this model, the market is right now starting the aggressive break-out phase above the Cylinder. Technically the Accumulation is over and the price may pursue levels 8 and 9, which give price Targets of $1.50 and $12.00 respectively.
Now, even though $12.00 falls well after (6 months or so) the expected duration of the current Bull Cycle, $1.50 is well within its limits (October - November 2025) and exactly double the price of the previous Cycle High. This makes it a very attractive Top candidate.
So do you think Doge is inside a Livermore Cylinder that is about to break out parabolically?
-------------------------------------------------------------------------------
** Please LIKE 👍, FOLLOW ✅, SHARE 🙌 and COMMENT ✍ if you enjoy this idea! Also share your ideas and charts in the comments section below! This is best way to keep it relevant, support us, keep the content here free and allow the idea to reach as many people as possible. **
-------------------------------------------------------------------------------
💸💸💸💸💸💸
👇 👇 👇 👇 👇 👇

DOGEUSD Has reached it's (first?) targetAfter reaching the Centerline, price eitheradvances to the Upper Extreme (U-MLH), or it reverses and it's target is the L-MLH, the lower Extreme of the Fork.
An Open & Close below the Centerline would indicate further progress to the downside.
A stop above the last high with a target around 2 would be the trade I would take.

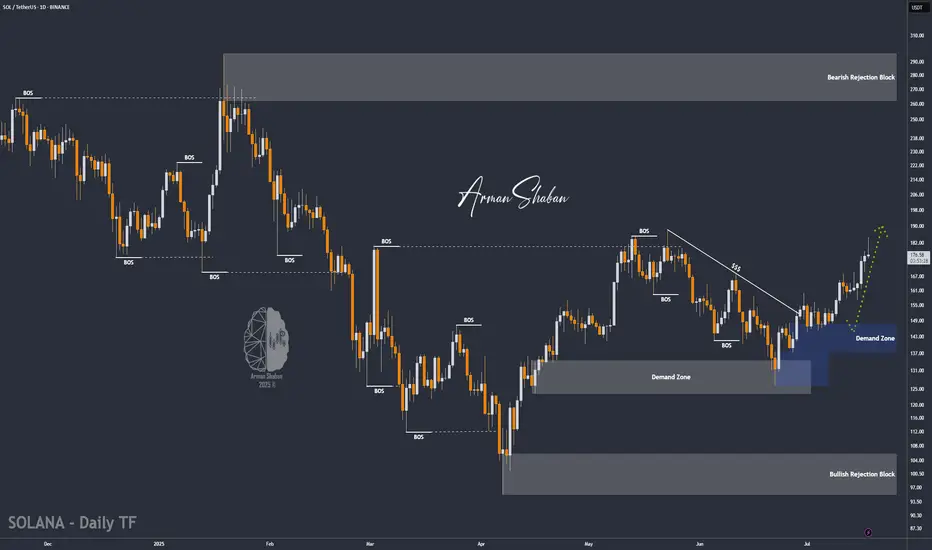
SOL/USDT | Next Bullish Leg Ahead if Key Support (READ)By analyzing the Solana chart on the daily timeframe, we can see that today the price climbed to $184, almost hitting the next target at $187, before facing a correction. It is currently trading around $176. If Solana manages to hold above the key support zone between $168 and $174, we can expect the next bullish leg to start, potentially extending up to $227. The previous analysis remains valid, with the next upside targets at $187, $220, and $263.
Please support me with your likes and comments to motivate me to share more analysis with you and share your opinion about the possible trend of this chart with me !
Best Regards , Arman Shaban
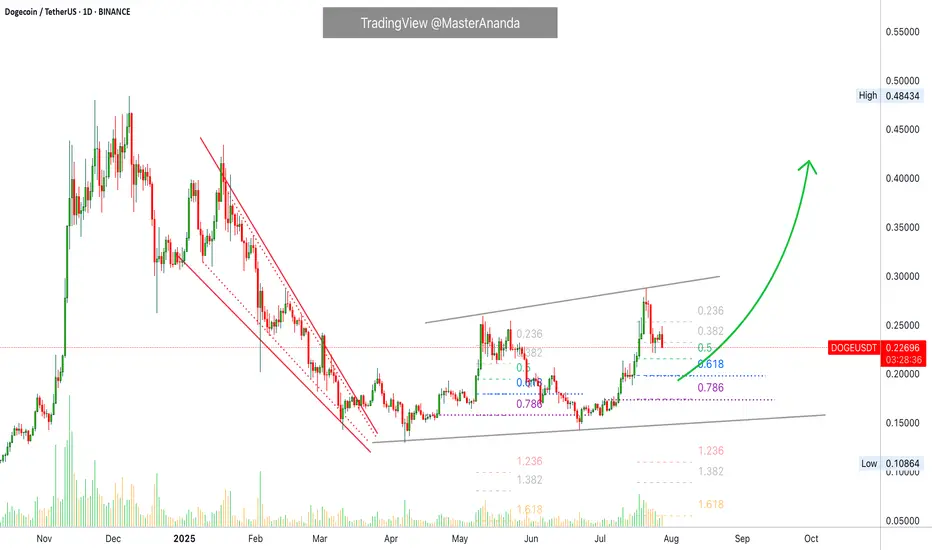
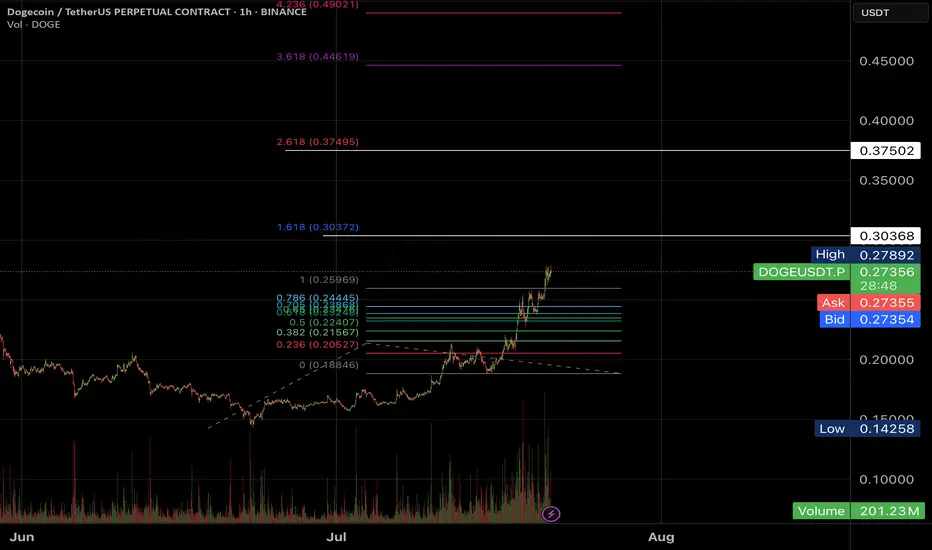
DOGE/USDT : eyes More Gains – Mid-Term Targets Up to $0.70! By analyzing the Dogecoin chart on the daily timeframe, we can see that since our last analysis around 7–8 months ago, the price started its rally from $0.10 and surged over 370% to reach $0.48. After that, it corrected back to around $0.13 and is currently trading near $0.27. If Dogecoin manages to hold above $0.25, we can expect further upside movement in the mid-term. The next targets are $0.287, $0.32, $0.41, and $0.70.
Please support me with your likes and comments to motivate me to share more analysis with you and share your opinion about the possible trend of this chart with me !
Best Regards , Arman Shaban

Are you looking for a short in #DogeHi Padawans,
BTC.D is dropping from 66% to 60%, and as expected, ALTs are starting to pump.
I’m keeping an eye on DOGE and will look to take some quick short scalps once it reaches the target levels.
Best regards,
CryptoObi
DOGE | Gearing up For a BIG MOVEDoge is looking mighty bullish after establishing a clear bottom.
Together with confirmation from BTC, we can safely say that altseason is yet ahead of us. BTC's recent increase show that the bullish impulse is still upon us. And after ETH increases, the rest of the altcoin market will follow suit as per usual.
DOGE is bullish because:
✅ Clear bottom
✅ Higher lows, daily looking to reclaim the moving averages:
✅ Altseason upon us after ETH increase
Ultimately, we need to wait for confirmation - if THIS major resistance zone is cleared (in other words if daily candles close ABOVE this zone) then we're full bull mode.
________________
BINANCE:DOGEUSDT

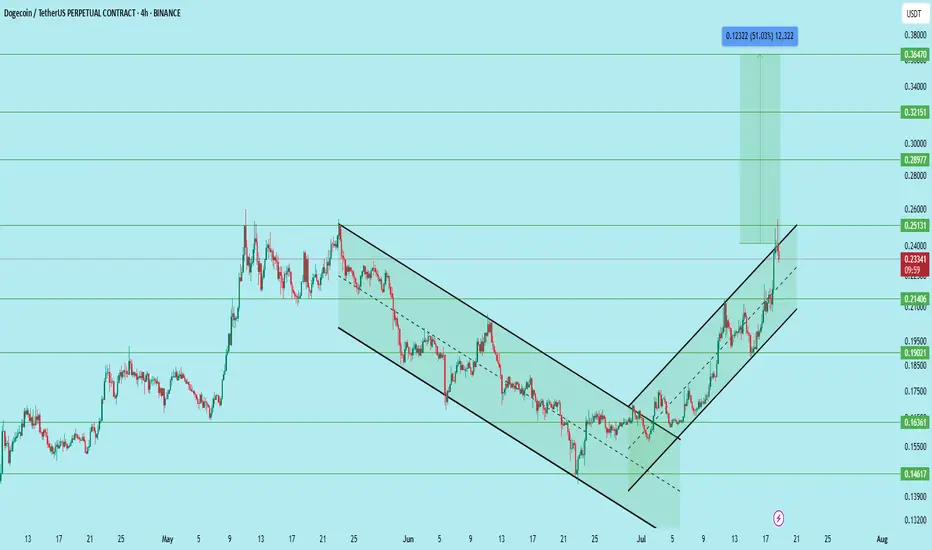
DOGE/USDT – Bullish Setup with Clear Channel BreakoutDogecoin has successfully broken out of a falling wedge and is now trending within a rising channel on the 4H timeframe. The price recently reclaimed the 0.214 support zone and is now showing continuation with strong volume and structure.
After the breakout and multiple retests, the pair offers a compelling long opportunity.
Setup Details:
Entry Zone: 0.208 to 0.214
Stop Loss: 0.186
Targets:
• 0.251 – First major resistance
• 0.289 – Mid-level breakout target
• 0.321 – Psychological round number
• 0.364 – Final target (approx. 51% move)
Technical Structure:
Breakout from falling wedge followed by bullish channel, Higher highs and higher lows clearly forming, Volume supports accumulation near breakout levels, Support holding above 0.214, confirming demand
Support Zones:
0.214 (reclaimed)
0.190 (intermediate)
0.163 (major demand zone)
Resistance Zones:
0.251
0.289
0.321
0.364
This setup offers a clean risk-reward ratio with confirmation on trend continuation. A rejection at 0.251 may present another opportunity to re-enter on a retest.
DYOR. Not financial advice.
Dogecoin flyinng soon!This is super speculative and I am positioned big on btc but I do have to admit I have been buying doge is the past bear market and I would like to see it close to 1 dollar or maybe more. This idea of doge gives a 1.36 top price

Doge inching above the double bottom necklineIt could easily dip back below the neckline a tie or two before it validates the breakout but definitely getting closer to doing so. Target is around 40-41cents. *not financial advice*