TON/USDT : Are you Bullish or Bearish? Let's Talk!By analyzing the #Toncoin chart on the 3-day timeframe, we observe that the price is still within the demand zone between $2.40 and $3.00.
If the price manages to break above the $3.10 level and hold within the next 7 days, we can expect further growth from this cryptocurrency.
The expected returns are approximately 20% in the short term, 40% to 55% in the mid-term, and up to 110% in the long term.
Please support me with your likes and comments to motivate me to share more analysis with you and share your opinion about the possible trend of this chart with me !
Best Regards , Arman Shaban
Dogecoin

ETH/USDT : Gearing Up for a Major Breakout? (READ)By analyzing the Ethereum chart on the weekly timeframe, we can see that the price has started rising just as expected and is now approaching the first target. For now, ETH faces major resistance in the $2,600–$2,900 zone.
If price breaks above this key area, I expect a strong bullish move from Ethereum!
Based on the main analysis, the short-term targets are $2,700 and $2,890, while the mid-term targets are $3,100 and $4,100.
Please support me with your likes and comments to motivate me to share more analysis with you and share your opinion about the possible trend of this chart with me !
Best Regards , Arman Shaban

BTC Weekly Analysis : Rise or Fall ? Let's SeeBy analyzing the #Bitcoin chart on the weekly timeframe, we can see that last week’s candle closed at $108,350, and BTC is currently trading around $107,500. If the price manages to hold above $105,700, we could expect further upside momentum. The next potential bullish targets are $111,700, $124,000, and $131,800.
So far, this analysis has yielded over 9% return, and we’ll be sharing more updates soon from lower timeframes!
🎥 If you enjoyed this video analysis and found it helpful, please show your support with a LIKE and COMMENT below!
These video-style breakdowns take time and effort, and I’ll only continue them with your support 🙌
Your engagement is my biggest motivation to keep going 💛
Thanks for being part of the journey!

Dogecoin $1.17 Next Target (591% Profits Potential)From its June 2022 bear market low, Dogecoin managed to grow more than 880% to its December 2024 peak price. The peak happened around the 0.618 Fib. extension level.
The next major level based on Fibonacci proportions in relation to the 2021 bull market/2022 bear market stands at $1.17, this would give us 591% profits potential from current price and a total of 2281% total growth coming from the June 2022 bottom. That would the total size of the bull market for Dogecoin if it peaks at $1.17, more than 23X.
Prices go up but they don't remain up. After a bullish wave there is always a correction. After a bull market there is always a bear market.
Dogecoin is now back at baseline levels but within a higher low. All the same resistance levels that were conquered in late 2024 will need to be challenged again. All these levels will break easily. The main resistance will be found at $0.59 followed by the previous, 2021, all-time high, around $0.74.
What other resistance levels are relevant if the market doesn't perform great?
I will give you the exact numbers. Below the last high $0.35 is a relevant level. Hitting new highs compared to December 2024 $0.70 needs to be watched. New ATH $1.05 and the rest of the numbers mentioned before and shown on the chart.
My guess? Above $1.00. There is no reason for the market to peak any lower.
Thanks a lot for your continued support.
Namaste.

DOGE, expanding upside pressure from 0.17 below. Targeting 0.4!DOGE had a good year last year 2024, going parabolic -- and reaching as high as 0.48.
Then as with any overheated price growth with the overall market, it went into extreme corrective mode -- trimming down as much more than 3x its price, tapping major lows at 0.14 area.
Now, based on its current long term metrics. We are now seeing some baselining action at the current price range at 0.17 area. Based on our diagram above, a hop signal has been spotted hinting of an expanding upside pressure on the present price zone.
DOGE has corrected to below bargain zone at 78.6 Fib levels. A no-brainer key area where buyers get the most discounted price. The MAJOR shift everyone is waiting for is currently transpiring this week.
Higher lows on long term momentum metrics has been registered as well -- conveying intense ascend pressure.
Ideal seed is at the current price and anything below 0.17 is a definite bargain.
Spotted at 0.169
Mid Target 0.5
Long term target 1.0
Trade safely. Market is still Market.
Not financial advice.
TAYOR.

DOGECOIN Eyes Major Breakout – Trend Channel in Controlhello guys!
doge seems potential now!
DOGECOIN has successfully broken out of a long-standing bearish trendline and is now respecting a well defined ascending channel structure.
After a clean retest of both the midline and the demand block around 0.1950–0.2150, the price is showing renewed bullish pressure. As long as price holds above this key support zone, we can expect further continuation to the upside.
what I see:
✅ Breakout of descending trendline confirmed
✅ Strong structure support from the demand block (0.1950–0.2150)
✅ Clean reaction from channel midline
✅ Momentum currently favors continuation of the bullish trend
🎯 Bullish Targets:
TP1: 0.2530 (recent swing high)
TP2: 0.2750 (channel upper boundary)
TP3: 0.3035 (major horizontal resistance zone)
🛑 Stop-loss idea: Below 0.1950 (invalidates bullish structure)

DOGE - IDEA index to my B/ september pumpWe have an instrument — DOGE — and I see a certain pattern. From one pump zone to the next, it's 14.4 cm, and this happens three times. From the high zone after these pumps, it's 15.5 cm, also three times. From the high at $0.74 to the high at $0.48, we get 40.7 cm. Similarly, from the very first DOGE pump where the mega rally began, there's also a 40.7 cm gap to the next strong pump.
After analyzing the old “Sparta” idea
I came to the conclusion that the price is being compressed within a specific range, and after some time, this range gets multiplied by a numerological coefficient. To get 444, you need to multiply 333 by 1.333. But another coefficient close to this value is 0.69 (zone) multiplied by 2, which equals 1.38.
On the chart, you can see that from the starting point we have 14.4 cm. If we apply the derived coefficient (0.69) — taken from the length of the circle — we get 20.9 cm. That is, our diameter is 14.4 cm. If we multiply it by Pi (3.14), we get the circumference: 45.2 cm. Then, we need to find the 0.69 zone, which equals 0.69π = 2.166. That means we divide 45.2 by 2.166 and get 20.9 cm. If we measure this from our first control point (from where we took the diameter), we arrive precisely at the bottom from which the trend reversal began.
Now, keeping in mind the coefficient that the cycle follows — 1.333 — if it moved exactly, it would be too obvious and there wouldn’t be the necessary chaos on the chart. Since we have more than one cycle, multiplying 0.69 × 2 = 1.38 gives us 28.8 cm, which precisely points to the high formed at $0.23.
You might not believe me or understand, but these are facts. I’ve provided you with the chart — you can verify everything yourself.
What does this give us?
This provides us with valuable information about how the trend develops after the strongest initial pump of the instrument, allowing us to capture all the movements by trading within a channel using complex percentages and taking massive % gains.
What do we need to do? Let’s repeat:
Study the distance from the lows before the pump to the next low right before the next pump (in cm).
Then we carry this same cycle backward to confirm its validity in the past and again forward — that will be the main one from which strong growth begins.
From the measured value (in cm), we take it as the diameter and multiply by Pi to get the circumference, which helps us understand what might come in the future.
We trade the 0.69 zone or 69%, whichever is easier for you. To find this zone, divide the circumference by 2.166.
Then multiply the result by the coefficient 1.333 or 1.38 — this will show us the final zone of growth or decline.
This math can also be applied not only to centimeters but to time bars. For example, if from one low to the next is 492 days, you can use the same formulas to extract valuable insights.
So, what’s next for DOGE?
If the zones I’ve already mentioned have occurred, how do we trade the future?
When we extend the diameter — that is, the 14.4 cm cycle in our case — we do this three times. Pi is 3.14, so obviously:
14.4 × 3 = 43.2
Our Pi value is 45.2.
That means 2 cm to the right will be the low before strong growth. This falls around September 1st, give or take — meaning sometime within the first two weeks of September a strong rally should begin, with acceleration in late September 2025.
I came to all these conclusions after 2 hours of work and recently developed this linear strategy — or more precisely, I had a breakthrough on it — so I expect a lot more will be added as I continue writing the book.
I also realized something else: remember the correlation between the highs and the strong pumps at 40.7 cm? We apply the same formula:
40.7 / 2.166 = 18.8
Which precisely points to the low before the pump.
Then we take:
(40.7 / 2.166) × 1.38 = 26 cm
Which also points to the same low as the 20.9 cm from the beginning of the 14.4 cm diameter.
An incredible mathematical correlation found using the formula I discovered.
To back up my words, I will index this idea and publish this excerpt on TradingView so it’s visible and verifiable. I hope the idea plays out, and that DOGE forms a local bottom in early September, followed by strong growth with acceleration at the end of September.
To be clear, I just described how the internal structure works — and it is only Pi that points directly to the strong September rally. Let's see what happens.

Complete Analysis of DOGE/USDT 4hComplete Analysis of DOGE/USDT 4h
The chart suggests a transition phase toward an uptrend.
Moving averages are beginning to slope upward, indicating a potential trend reversal. The MACD shows weakening selling pressure and is approaching a bullish crossover, which often precedes upward price movement.
Entry zones: Between 0.14452 and 0.15185 — favorable areas for position accumulation.
Price targets:
First target: 0.20455 (a key resistance zone).
Second target: 0.22942, where stronger selling pressure may emerge.
Risk management: A suggested stop-loss at 0.13561 to protect capital if the anticipated move fails.
If the price breaks and consolidates above 0.17, the market could gain momentum to reach the projected targets. Monitor volume during breakout candles to confirm the presence of buying flow.

DOGEUSD: $1.100 is the minimum target.Dogecoin is bearish on its 1D technical outlook (RSI = 37.555, MACD = -0.00967, ADX = 29.193), suggesting that it is heavily undervalued in relation to the position it has during the same stage of the previous Cycles. All Cycles have smashed through the top red Mayer Multiple Band before pricing the Top. This means that by the end of the year, we can expect at least $1.100 for Doge (current projection of the Top Mayer Band).
## If you like our free content follow our profile to get more daily ideas. ##
## Comments and likes are greatly appreciated. ##

#ETH Rebounds on Ceasefire News – Eyes Set on $3100 and Beyond!By analyzing the #Ethereum chart on the weekly (logarithmic) timeframe, we can see that after dropping to $2100, ETH started recovering strongly following the ceasefire announcement, and is currently trading around $2430. If Ethereum manages to close above $2700 by the end of the week, we could expect further upside.
The next potential bullish targets are $2890, $3100, and $4100.
Please support me with your likes and comments to motivate me to share more analysis with you and share your opinion about the possible trend of this chart with me !
Best Regards , Arman Shaban

Cardano Correction or Opportunity? (READ THE CAPTION)By analyzing the #Cardano chart on the 3-day timeframe, we can see that after reaching 73 cents and amid rising war tensions, the price started a correction along with the broader crypto market. This correction has now brought ADA to attractive zones for potential laddered buying and long-term investment. Cardano is currently trading around 54 cents, and if the conflict continues, it may drop further, possibly below 45 cents.
Key demand zones are at $0.36, $0.45, and $0.52.
Short-term targets are $0.61 and $0.76, while long-term bullish targets are $0.93, $1.05, and $1.33.
Please support me with your likes and comments to motivate me to share more analysis with you and share your opinion about the possible trend of this chart with me !
Best Regards , Arman Shaban

Gold Pullback Into Demand – Is Another Bullish Leg Coming?By analyzing the gold chart on the 4-hour timeframe, we can see that, as expected, price began to rise from the $3323 area and reached up to $3350. After this move, gold experienced a minor correction down to $3310, which aligns with a key demand zone.
Currently, gold is trading around $3322, and if price holds above $3313, we can expect another bullish move with $3333 as the first target and $3350 as the second.
This outlook will be invalidated if price closes below $3309.
Please support me with your likes and comments to motivate me to share more analysis with you and share your opinion about the possible trend of this chart with me !
Best Regards , Arman Shaban

It's disappointing !!!Do you think this will happen, or do you see DOGE below $0.14 in the future?
Best regards CobraVanguard.💚

DOGE ANALYSIS (12H)Based on the current available data, it appears that Dogecoin has entered a bullish phase after completing the diametric pattern marked on the chart. We are currently in wave B of this bullish phase.
Wave B may complete within the green zone, which is a key support area.
The targets for wave C have been marked on the chart.
A daily candle closing below the invalidation level would negate this outlook.
For risk management, please don't forget stop loss and capital management
Comment if you have any questions
Thank You

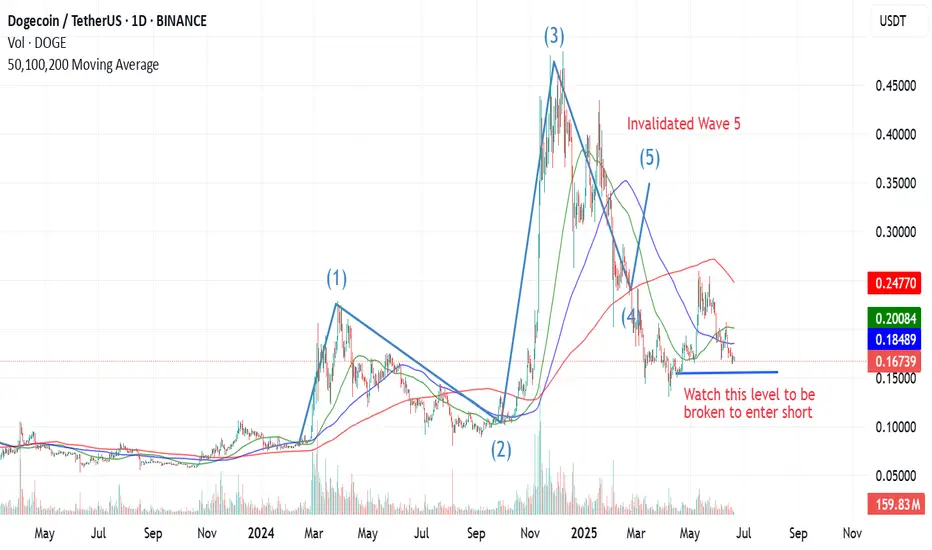
Elliot Wave Analysis for Doge - Bearish TrendLets analyse Doge on 1D timeframe since Feb 2024.
Wave 1 - It reached a high of 0.23 from a bottom price range of 0.084.
Wave 2 - Corrective wave take the prices back to 0.08 in Aug - Sep 24.
Wave 3 - As per theory should be the strongest and it proved to be one, taking the price to 4 year high of 0.4843.
Till now everything was fine and the next corrective Wave 4 started which as per classical Elliott Wave theory, should never enter the price territory of Wave 1.
Wave 1 high was 0.2288 however if we see the current price 0.168 (Wave 4), it already has invalidated the previous wave.
So now if we re-evaluate -
The run from 0.084 to 0.4843 was a Zigzag A-B-C Pattern with A marking as 0.2288, B as 0.08 and C = 0.4843. So seems we are in a complex correction phase and can see prices move down to previous lows or even lower.
So for now be patient and watch the prices between $0.168–0.182, if it reclaims $0.228–0.245, then we can consider entering a Long.
A breakdown below 0.154 can cause a lot of trouble for Bulls.
Trade Safely!
Thanks!
Where Most See Resistance, Smart Money Sees OpportunityDOGE is currently hovering around the 0.382–0.5 Fibonacci retracement zone after a reactive bounce from 0.618 (0.16784) — a critical discount level. Most traders panic at these levels, but experienced participants know this is the zone where price builds intention.
Here's the breakdown of the structure:
Price tapped into the 0.618 Fibonacci level (0.16784) and began showing signs of recovery — a typical Smart Money accumulation zone.
The next target is 0.17042, aligning with the 0.236 retracement level, followed by 0.17151, where previous supply might get mitigated.
Potential retracements are possible, but as long as price holds above 0.16670 (0.786), the bullish structure remains intact.
Execution strategy:
Entry (Accumulation Zone): Between 0.16784 and 0.16864
Invalidation: Break below 0.16600 would weaken the bullish case
Upside targets:
• TP1 → 0.17042
• TP2 → 0.17151
• Extension possibility beyond 0.17204
This move appears to be a classic premium-delivery setup — a structural reset, not a collapse. Smart Money steps in quietly when retail panic takes over. If you're trading DOGE like a pro, focus on levels, not emotions.
Let me know if you'd like this converted into a tweet format or turned into a technical newsletter paragraph.

Dogecoin: Small Move, Big Move, What Will You Do?All gains have been removed, most of them. Dogecoin hit yesterday the same level from 6-May. This level was the base that propelled prices to 0.26000. From this high point 11-May, we witnessed a correction lasting more than a month. Total drop amounts to 36.9% (-37%).
Size and duration
» From 6 to 11-May we have 5 days.
» From 7-April to 11-May we have 34 days (bullish).
» From 11-May to 17-June we have 37 days (bearish).
I am making the case that the correction is over. Follow me a little longer and you will be convinced. If you are not convinced by my analysis, you will be convinced when prices start to increase.
Drop vs rise
» The 7-April low was 0.12986.
» The 6-May and 17-June lows was around 0.16400.
While the drop is bigger than the rise, in time duration, the action did not produce new lows (a lower low). Instead, prices remain strong as a higher low.
The low 17-June (yesterday) is 26% higher compared to the low that was hit 7-April.
Now I will make my case stronger.
Past action
Dogecoin peaked 8-December 2024. After this peak, bearish action is really strong and every few weeks we see a new low. Total drop from top to bottom amounts to more than 73%. But here is the thing, the final low in 7-April is still higher compared to the low in early August 2024.
» What you are seeing now is a "small move," (1).
» What comes next is a "big move," (2).
Now you know what is coming to Dogecoin—the altcoins market—what will you do?
Namaste.

Dogecoin - Don't forget the dog now!Dogecoin - CRYPTO:DOGEUSD - still remains quite bullish:
(click chart above to see the in depth analysis👆🏻)
Basically during every major bullrun on Dogecoin, we always saw a correction of at least -60%. Therefore the recent drop of -70% was not a surprise at all but rather a natural all time high rejection. If Dogecoin manages to now create bullish confirmation, the bullrun will continue.
Levels to watch: $0.2. $0.5
Keep your long term vision!
Philip (BasicTrading)

BTC Dips After ATH – $100K Support in Focus Amid TensionsBy analyzing the #Bitcoin chart on the weekly timeframe, we can see that after rallying to $111,980 and printing a new all-time high, price faced a correction down to $100,000.
Currently, Bitcoin is trading around $105,700, and with geopolitical tensions escalating, particularly the risk of war, we could see further downside — potentially taking price as low as $90,000.
However, if BTC manages to hold above the $100,000 level, there’s a strong chance we’ll see a short-term rally toward $120,000.
This analysis will be updated as the situation evolves. Stay tuned!
Please support me with your likes and comments to motivate me to share more analysis with you and share your opinion about the possible trend of this chart with me !
Best Regards , Arman Shaban

DOGE Support Is Crumbling Here’s Why a Drop to $0.15 Is On CardsThe 4-hour chart for DOGEUSDT reveals a weakening structure, with price currently hovering just above a key support at $0.16863, which also aligns with the marked TP1/Daily Support level. Price action has been consistently rejected from the upper zone near $0.18500–$0.18756, confirming that supply is dominant at higher levels.
The Supertrend indicator remains firmly red and is trailing far above the current price — a strong confirmation that the trend bias is still bearish. Each attempt to retest or reclaim higher ground is quickly sold off, indicating a lack of bullish conviction.
From a structural perspective, DOGE recently formed a lower high followed by a breakdown beneath the local mid-range. This has pushed the price back into a distribution-to-breakdown zone, where the probability of further downside is increasing. If the current support at $0.16863 breaks with momentum, the next obvious liquidity pool is sitting near $0.15285, which is already marked as the Next Support/TP2. That level could serve as the next major bearish target.
Volume also supports a bearish narrative — despite brief surges, the recent volume profile shows no sustained buying pressure, and sellers remain in control around each resistance test. The failure to push above the $0.173–$0.175 region in the last bounce attempt further reinforces the weakening bullish effort.
While some buyers may attempt to defend the $0.168 level, the lack of follow-through on rebounds suggests this support is softening. A clean 4H close below $0.168 — especially on volume — would likely trigger stop-losses and lead to a swift drop toward $0.160 and then $0.152.
If you're looking to position with the bearish trend:
• A low-risk short entry could be placed on any failed bounce near $0.173–$0.175 (prior local supply zone).
• Ideal targets remain at $0.160 and $0.15285.
• Stop-loss can be positioned just above $0.177–$0.180, depending on your risk appetite.
Given the current structure, DOGE is making lower highs, testing support more frequently, and showing no bullish divergence in volume — all classic signs of a market preparing for a breakdown. Unless a sudden reversal in momentum occurs (which would require DOGE reclaiming at least $0.180), short setups are favored.

DOGE/USDTDogecoin is currently in a trading range and could enter a trend if it breaks the upper and lower lines. We'll have to wait and see what happens.

DOGE: A Reversal In Development?Im monitoring for something like this on DOGE with the plan to DCA as it takes SSL and comes into the range low and demand.
Looking a little weak here with signs on majors of weakness, i can see this going into the SSL and lower demand areas marked.
Still seeing this as a large range development and looking for a HTF bullish reversal to form in this region.
Although theres unmitigated demand in the discount below as marked around $0.11, i dont see this targeting that just yet and my main thesis and bias is this potential range and reversal region we are in here.
1D:
3D:
1W:
1M:

Dogecoin Weekly, Bullish Update —1,2,3,4,5 SequenceJust to make sure we have a little bit of everything, here we have Dogecoin sandwiched in-between EMA34 and MA200.
» XRP is trading above these two levels.
» ADA is trading below.
» ETH is trading above.
» BTC is mixed.
Seeing DOGE in-between can reveal a few things.
No drama, MA200 will hold.
MA200 sits at $0.13822.
Notice the drop between December 2024 and March 2025.
Big red candles; straight down.
Notice the more recent drop, between early May and early June.
Small candles and a curve is starting to show already.
What I am gathering from all these charts is that the retrace only has 1-2 weeks left. I say 1-3 weeks just to play it safe, but it seems to be almost over, the bearish action.
Look at this 1,2,3,4,5 sequence.
1) The last peak.
2) The main low.
3) Initial breakout.
4) Retrace and higher low.
5) The next peak.
We are currently at #4. This means that we are set to experience a new wave of growth, "the next peak."
Thanks a lot for your continued support.
Namaste.
