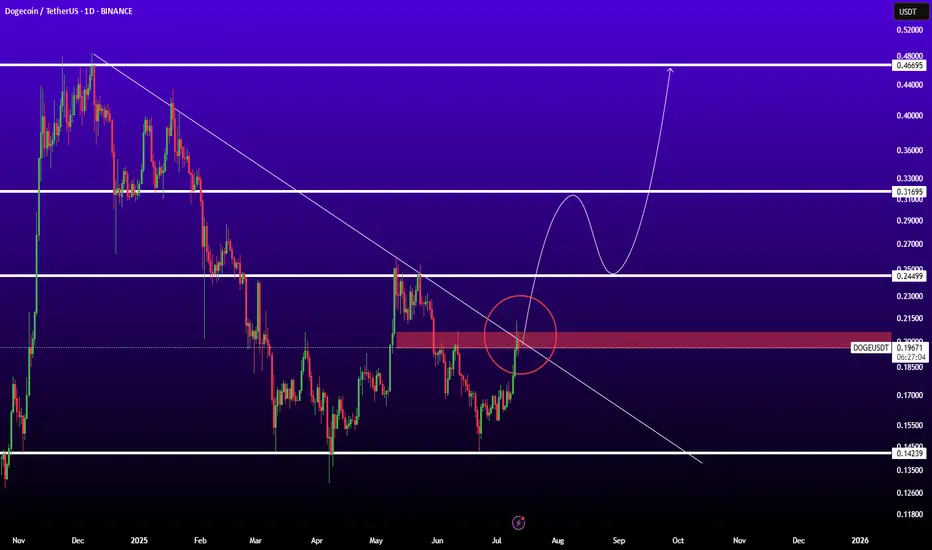
DOGECOIN : Should we expect an increase?Hello friends🙌
📈Given the decline we had, you can see that buyers entered at the specified support and formed a double bottom reversal pattern, which is a strong signal on support.
📉Considering the possible market correction, we placed two more buy levels lower so that we can buy there if the price corrects.
⚠Don't forget about capital and risk management, friends.
🔥Follow us for more signals🔥
*Trade safely with us*
Dogecoinanalysis

DOGEUSDTBINANCE:DOGEUSDT is in good level for pump because if breaked trendline and resistance 0.200$ ready for sharp movement to next levels.
Resistances: 0.25 - 0.32 - 0.45
Support: 0.15
Dogecoin - It is all totally expected!🐶Dogecoin ( CRYPTO:DOGEUSD ) will break out soon:
🔎Analysis summary:
Just this month, Dogecoin perfectly retested a significant confluence of support and is starting the expected rejection. With bullish momentum picking up, there is a very high chance that Dogecoin will break the all time high in the near future.
📝Levels to watch:
$0.5
🙏🏻#LONGTERMVISION
SwingTraderPhil

DOGE | Gearing up For a BIG MOVEDoge is looking mighty bullish after establishing a clear bottom.
Together with confirmation from BTC, we can safely say that altseason is yet ahead of us. BTC's recent increase show that the bullish impulse is still upon us. And after ETH increases, the rest of the altcoin market will follow suit as per usual.
DOGE is bullish because:
✅ Clear bottom
✅ Higher lows, daily looking to reclaim the moving averages:
✅ Altseason upon us after ETH increase
Ultimately, we need to wait for confirmation - if THIS major resistance zone is cleared (in other words if daily candles close ABOVE this zone) then we're full bull mode.
________________
BINANCE:DOGEUSDT

Dogecoin flyinng soon!This is super speculative and I am positioned big on btc but I do have to admit I have been buying doge is the past bear market and I would like to see it close to 1 dollar or maybe more. This idea of doge gives a 1.36 top price

DOGE/BTC: HTF Retest Complete — Reversal BrewingDiving into DOGE/BTC, we’re seeing strong bullish confluences that align well with the DOGE/USDT structure and support the idea that the macro low is in.
Looking back across all available data, DOGE/BTC has traded within a clear 7-year accumulation range dating back to 2014, bounded by a defined range high resistance and range low support. This long period of consolidation enabled massive accumulation, ultimately leading to the first breakout in 2021, which rejected at the highs, pulled back, and then exploded into a cycle ATH.
Since that 2021 high, DOGE/BTC has been in a 4-year downtrend, retracing back into discount pricing, right into the range high of that original accumulation zone — which now acts as a major HTF demand level and last point of support before the original breakout.
📉 What’s happened recently?
- Price swept 2024 swing lows (SSL)
- Tagged the HTF demand zone
- Retested the 2021 breakout level (accumulation range high)
- Coiling inside a descending wedge with contracting volatility
This entire region is a key reversal zone from both a structural and psychological standpoint. It’s where we typically see major trend shifts form, and the structure suggests we’re forming a HTF swing low and bottom from this area.
🧠 Add this to the confluence from DOGE/USDT — which also appears to have printed its bottom — and the case for a macro reversal gets even stronger.
As this wedge tightens and price continues to compress against long-term support, I’m anticipating an explosive breakout that kickstarts the next leg of the HTF uptrend — effectively a continuation of the original breakout from the 7-year range.
5D:

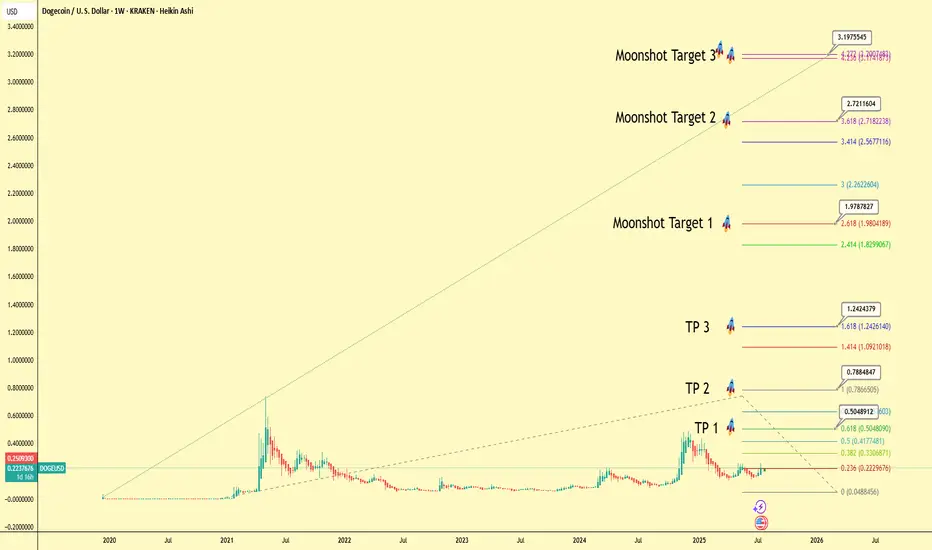
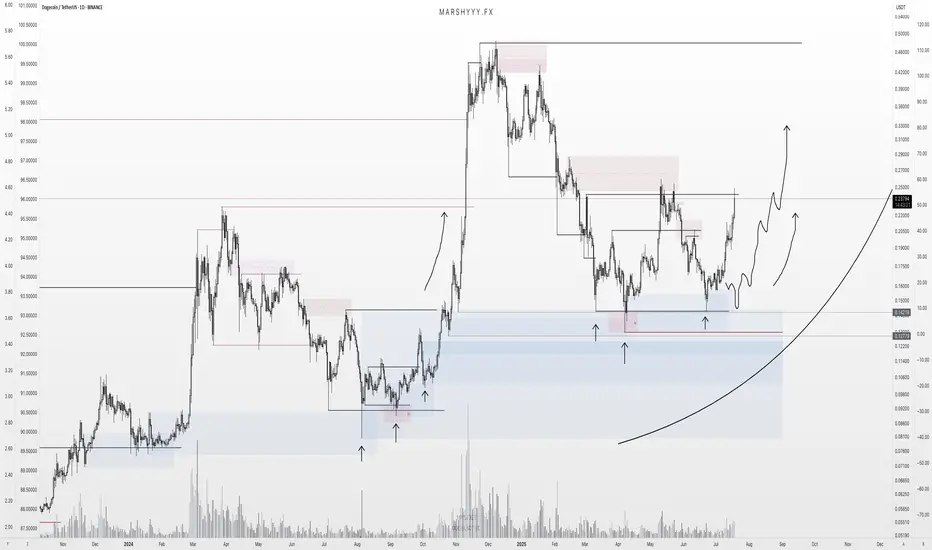
DOGE Macro Analysis: A Technical and Fundamental Blueprint to $3This analysis presents a long-term macro view for Dogecoin (DOGE/USD) using a daily Heikin Ashi chart to smooth out price action and better identify the underlying trend. The primary technical tool employed is a multi-year Fibonacci extension, a powerful instrument for projecting potential price targets in a trending market.
Based on the key swing low and high of the previous cycle, we have mapped out several conservative take-profit (TP) levels and more ambitious "Moonshot" targets.
The Technical Targets
The core of this projection lies in the Fibonacci extension levels. Assuming an entry or cost basis around the current consolidation level of $0.25, the potential targets are as follows:
TP 1 (0.618 Fib): $0.505 (+102% Profit)
TP 2 (1.000 Fib): $0.788 (+215% Profit)
TP 3 (1.618 Fib): $1.242 (+397% Profit)
Moonshot Targets
For longer-term holders, the upper Fibonacci levels suggest significant upside potential:
Moonshot Target 1 (2.618 Fib): $1.979 (+692% Profit)
Moonshot Target 2 (3.618 Fib): $2.721 (+988% Profit)
Moonshot Target 3 (4.236 Fib): $3.175 (+1170% Profit)
The Rationale: Why These Prices are Expected
This bullish outlook is supported by a combination of historical technical patterns and strengthening fundamental catalysts:
Historical Cycle Performance: In previous bull cycles, Dogecoin has shown a remarkable tendency to not just meet, but exceed standard Fibonacci targets, often running all the way to the 4.236 extension level. While past performance is not a guarantee, this historical precedent forms a strong basis for the "Moonshot Target 3" as a cycle peak objective.
Growing Institutional Legitimacy: The landscape for digital assets is maturing. Recent news about a major player filing with the SEC to list Dogecoin futures is a significant catalyst. Such a product would open the door for institutional capital, enhance liquidity, and provide a regulated pathway for investment, fundamentally increasing Dogecoin's legitimacy and market depth.
Renewed Investor Inflows: Dogecoin possesses one of the most resilient and loyal retail communities in cryptocurrency. As the market cycle progresses, the combination of re-energized retail interest and new institutional inflows could create a powerful demand-side shock, providing the fuel needed to reach these upper price targets.
Conclusion
This analysis outlines a clear, multi-stage roadmap for Dogecoin's potential path forward. The confluence of a historically reliable technical pattern (Fibonacci extension) and major fundamental catalysts (futures listing, broad investor interest) creates a compelling long-term thesis.
Disclaimer: This is a personal analysis and projection for educational purposes only. It is not financial advice. Always conduct your own research and manage your risk accordingly.
#Dogecoin #DOGE #Crypto #TechnicalAnalysis #Fibonacci #Altcoin #TradingView #ToTheMoon
$DOGE Double Bottom TargetIf this double bottom "W" pattern on CRYPTOCAP:DOGE plays out, the target is $0.47.
Two notes:
1. The double-bottom pattern has a 60-65% success rate (no guarantees).
2. The Alt market has been very strong, with new dollars entering the market. If we close above $0.25-0.26 and retest, I think this target is likely as it returns to the high for this cycle.

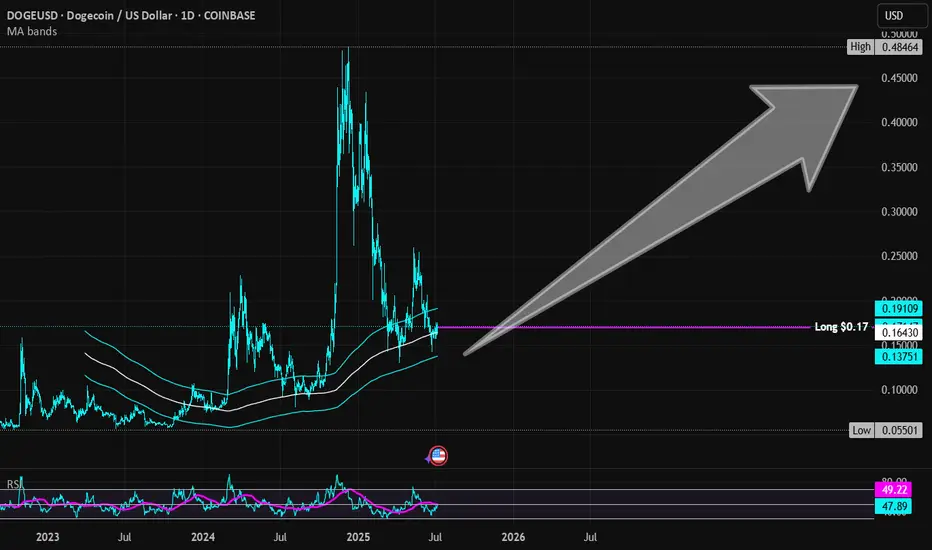
Dogecoin | DOGE | Long at $0.17Currently within my historical simple moving average area and consolidating. I suspect a move up is imminent, but 100% speculation. Crypto "bros" know more than I do.
Targets into 2028:
$0.25 (+47.1%)
$0.45 (+164.7%)
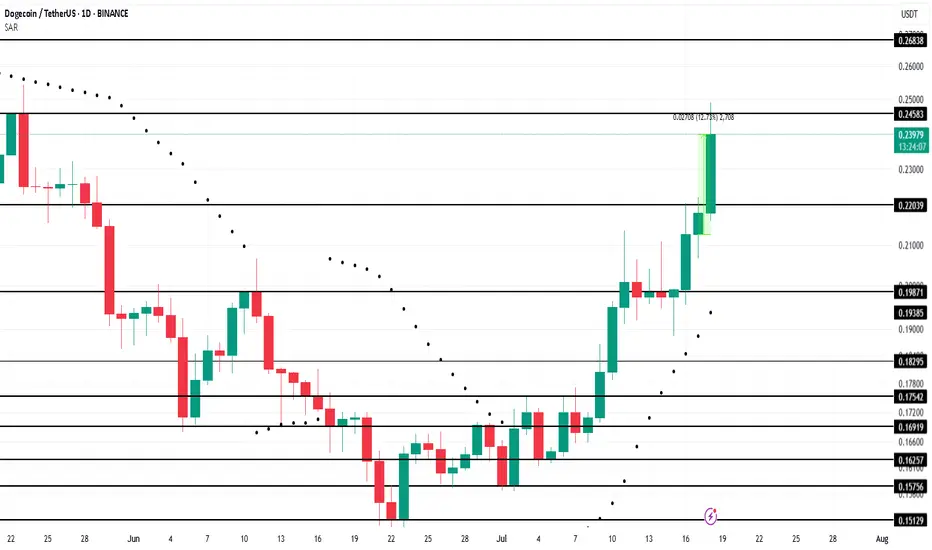
Dogecoin Leads Meme Coins With 12% Rally In 24 HoursBINANCE:DOGEUSDT , the leader of meme coins, surged 12% over the last 24 hours , reaching $0.239. This rally has positively impacted other meme tokens, showcasing DOGE’s influence within the market.
Currently facing resistance at $0.245, BINANCE:DOGEUSDT has reached a 2-month high . The Parabolic SAR below the candlesticks signals that DOGE is likely to maintain its upward trend in the coming days. If this support holds, the meme coin could continue pushing towards higher price levels, attracting more buyers and momentum.
However, meme coins are volatile. If BINANCE:DOGEUSDT holders decide to cash out their profits, the price could drop back down to $0.220 . Losing this support would invalidate the bullish outlook, signaling a possible downturn for the altcoin in the short term.
DOGE Update: Reversal Playing Out — $1+ in Sight?DOGE is playing out almost exactly as forecast back on June 14th, where I was monitoring for price to sweep the SSL and tap into range low demand within this larger HTF range.
Price did exactly that — pushing into discount, tagging the marked demand zone, and bottoming out right where I expected the reversal. I DCA’d hard at $0.165 after the initial low printed — just as planned.
Now sitting around +50% on those buys, and my plan remains to ride this out toward the ATH at $0.74 and potentially $1+.
The HTF closes forming here — across 3D, 4D, 5D, 6D candles — are showing clear strength. For me, the low is likely in, and I’m expecting new higher highs and ATHs from here. Now it’s just about letting the market do its thing, trailing stops, and taking profits into strength as alerts and targets get hit.
Zooming way out — I’m also watching DOGE’s 10-year uptrend channel. Price has once again tagged the lower bound of that channel, and historically, this has led to moves back to the channel highs.
🧠 Layer on a fib projection from the previous ATH to the bear market low, and we get:
1.272 Fib → ~$1.54
1.618 Fib → ~$3.92
Both of which align perfectly with the upper bounds of that long-term trend channel — giving us a key HTF reversal zone to monitor in the future.
In summary:
- Reversal from demand ✅
- DCA filled ✅
- HLs printing ✅
- Targets = ATH and beyond
- Watching HTF fibs + channel highs for eventual cycle top formation
DOGE is doing what DOGE does — don’t overcomplicate it.
1D:
3D:
1W:
1M:
$Doge Dogecoin about 60% retracement from all time high...CRYPTOCAP:DOGE dogecoin has retraced about 60% from an all time high of about 0.49
Current price: 0.20
Reasons why i am bullish on #Doge
CRYPTOCAP:DOGE price action has remained above the 200ema on the weekly timeframe ...bullish!
- $dogecoin has committed an over 60% retracement from all time high of 0.49
- It is currently at double bottom support seen in April
#dogecoin negative money flow is thinning out
- Sentiments are neutral : neither greedy for fearful
- Price action is exactly at point of control on the weekly time frame!
Resistances above to watch: 0.32, 0.42 up to 0.69

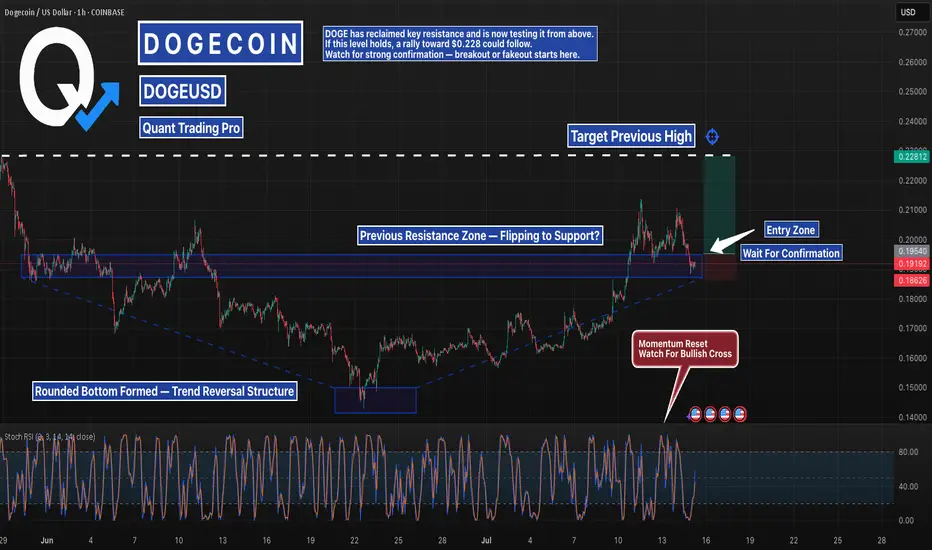
DOGE Retesting the Breakout: Bounce or Breakdown Coming SOON?DOGE has reclaimed key resistance and is now retesting it from above, following a textbook rounded bottom breakout. With Stoch RSI resetting and trend structure still intact, bulls are looking for confirmation before the next move.
If this zone holds, the path toward $0.228 opens up. But without a clean bounce, the setup weakens. Confirmation is everything — don’t front-run the signal.
#DOGEUSD #CryptoTrading #AltcoinSetups #BacktestYourEdge #QuantTradingPro #TradingView #BreakoutRetest
Dogecoin - This is the key structure!Dogecoin - CRYPTO:DOGEUSD - has to reverse now:
(click chart above to see the in depth analysis👆🏻)
A couple of months ago Dogecoin retested the previous all time high. We have been seeing a harsh correction of about -65% thereafter. However Dogecoin still remains in a bullish market with bullish structure. In order to validate this trend, a reversal must happen now.
Levels to watch: $0.15, $0.5
Keep your long term vision🙏🙏
Philip (BasicTrading)

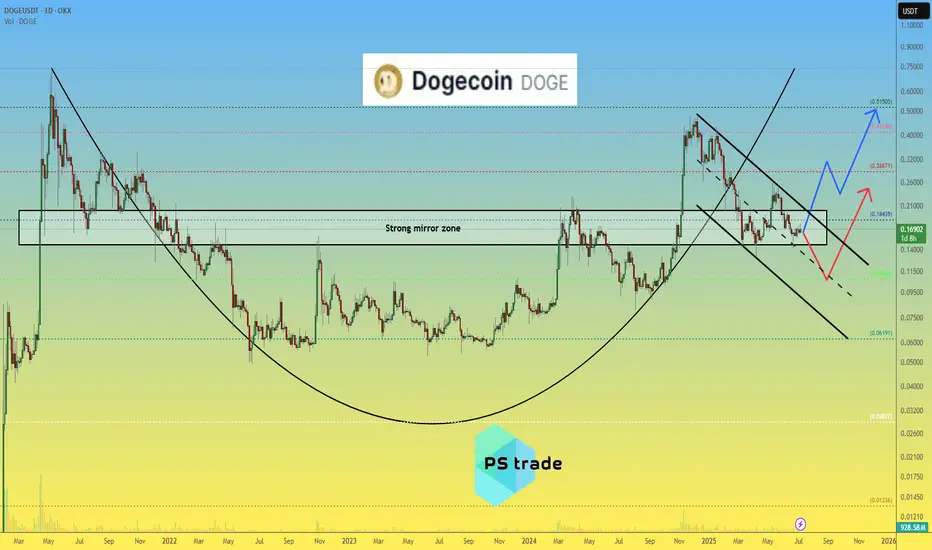
Dogecoin DOGE price analysisCRYPTOCAP:DOGE price is now in the middle of a strong mirror zone of $0.15-0.20
📈 It looks like the position is now accumulating, forming a "double bottom" and then, only a way for growth, to the highs in the region of $0.45-0.50
🐻 On the other hand, the scenario of another "leg" down fits perfectly into the TA canons. That is, it is very likely that if the price of OKX:DOGEUSDT drops below $0.15, then it is already fall to $0.10)
P.S.:
#Doge is an interesting asset, it is worth watching with one eye, and with the other eye, watch how the "battle" between Trump and Musk (who is the main influencer and "pumper" of #Dogecoin) will end.
💡 And then put the two pieces of information together and make a trading decision - "easy money" !)
_____________________
Did you like our analysis? Leave a comment, like, and follow to get more
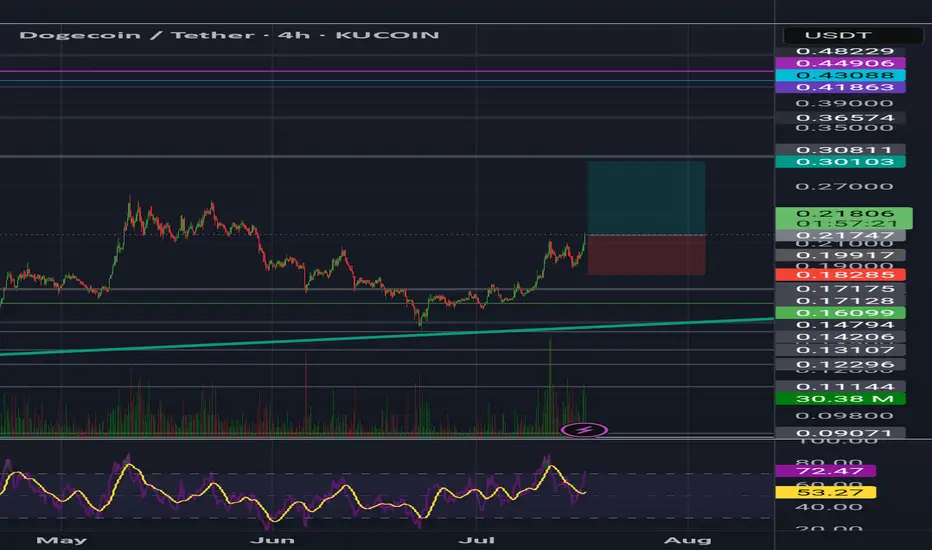
DOGEUSDT Buy Long SetupWait for entry, if the tp hits first, then ignore the trade, I will share new entry.

Doge Buy / Long SetupDoge has some Bullish Momentum, Invalidation if 4hrs closes below the mentioned point, then close on entry, otherwise wick doesn't matter. If tp achieved first then Cancel the trade.

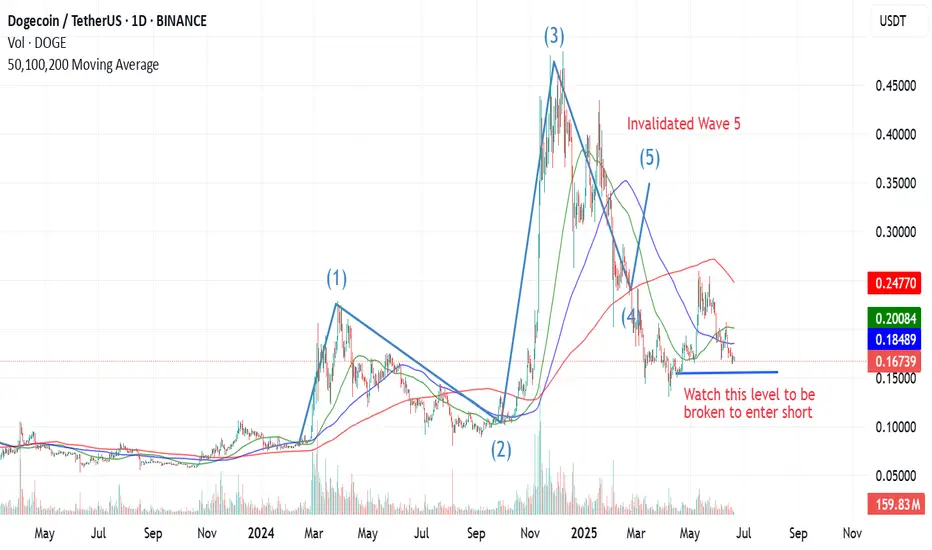
Elliot Wave Analysis for Doge - Bearish TrendLets analyse Doge on 1D timeframe since Feb 2024.
Wave 1 - It reached a high of 0.23 from a bottom price range of 0.084.
Wave 2 - Corrective wave take the prices back to 0.08 in Aug - Sep 24.
Wave 3 - As per theory should be the strongest and it proved to be one, taking the price to 4 year high of 0.4843.
Till now everything was fine and the next corrective Wave 4 started which as per classical Elliott Wave theory, should never enter the price territory of Wave 1.
Wave 1 high was 0.2288 however if we see the current price 0.168 (Wave 4), it already has invalidated the previous wave.
So now if we re-evaluate -
The run from 0.084 to 0.4843 was a Zigzag A-B-C Pattern with A marking as 0.2288, B as 0.08 and C = 0.4843. So seems we are in a complex correction phase and can see prices move down to previous lows or even lower.
So for now be patient and watch the prices between $0.168–0.182, if it reclaims $0.228–0.245, then we can consider entering a Long.
A breakdown below 0.154 can cause a lot of trouble for Bulls.
Trade Safely!
Thanks!
DOGE Support Is Crumbling Here’s Why a Drop to $0.15 Is On CardsThe 4-hour chart for DOGEUSDT reveals a weakening structure, with price currently hovering just above a key support at $0.16863, which also aligns with the marked TP1/Daily Support level. Price action has been consistently rejected from the upper zone near $0.18500–$0.18756, confirming that supply is dominant at higher levels.
The Supertrend indicator remains firmly red and is trailing far above the current price — a strong confirmation that the trend bias is still bearish. Each attempt to retest or reclaim higher ground is quickly sold off, indicating a lack of bullish conviction.
From a structural perspective, DOGE recently formed a lower high followed by a breakdown beneath the local mid-range. This has pushed the price back into a distribution-to-breakdown zone, where the probability of further downside is increasing. If the current support at $0.16863 breaks with momentum, the next obvious liquidity pool is sitting near $0.15285, which is already marked as the Next Support/TP2. That level could serve as the next major bearish target.
Volume also supports a bearish narrative — despite brief surges, the recent volume profile shows no sustained buying pressure, and sellers remain in control around each resistance test. The failure to push above the $0.173–$0.175 region in the last bounce attempt further reinforces the weakening bullish effort.
While some buyers may attempt to defend the $0.168 level, the lack of follow-through on rebounds suggests this support is softening. A clean 4H close below $0.168 — especially on volume — would likely trigger stop-losses and lead to a swift drop toward $0.160 and then $0.152.
If you're looking to position with the bearish trend:
• A low-risk short entry could be placed on any failed bounce near $0.173–$0.175 (prior local supply zone).
• Ideal targets remain at $0.160 and $0.15285.
• Stop-loss can be positioned just above $0.177–$0.180, depending on your risk appetite.
Given the current structure, DOGE is making lower highs, testing support more frequently, and showing no bullish divergence in volume — all classic signs of a market preparing for a breakdown. Unless a sudden reversal in momentum occurs (which would require DOGE reclaiming at least $0.180), short setups are favored.

DOGE: A Reversal In Development?Im monitoring for something like this on DOGE with the plan to DCA as it takes SSL and comes into the range low and demand.
Looking a little weak here with signs on majors of weakness, i can see this going into the SSL and lower demand areas marked.
Still seeing this as a large range development and looking for a HTF bullish reversal to form in this region.
Although theres unmitigated demand in the discount below as marked around $0.11, i dont see this targeting that just yet and my main thesis and bias is this potential range and reversal region we are in here.
1D:
3D:
1W:
1M:

DOGEUSDT BINANCE:DOGEUSDT Price is ranging between 0.18200 and 0.18650 dollars after a sharp rise from 0.17000. A break above 0.186 triggers a buy, targeting 0.19450 and 0.19950 dollars. A break below 0.182 triggers a sell, with supports at 0.17650 and 0.17000 dollars.
Trigger Levels:
Buy Trigger: 0.186
Sell Trigger: 0.182
⚠️Contorl Risk management for trades.

DOGE | BULLISH Pattern | +100%DOGE is seemingly ready for more upside as we start to see a pattern resembling an inverse head and shoulders pattern:
✅Usually, the Inverse H&S plays out something like this:
📢But the pattern is not quite confirmed just yet. We'd need to see a close ABOVE the current resistance zone to validate the pattern:
If we can see that, it's likely that there can be BIG gains on DOGE. It will especially help if ETH makes more increases, showing that the general alt market is heading in the right direction.
____________________
BINANCE:DOGEUSDT
