Doge H4 | Overlap resistance at 50% Fibonacci retracementDoge (DOGE/USD) is rising towards an overlap resistance and could potentially reverse off this level to drop lower.
Sell entry is at 0.1726 which is an overlap resistance that aligns closely with the 50% Fibonacci retracement.
Stop loss is at 0.1930 which is a level that sits above a pullback resistance.
Take profit is at 0.1494 which is a swing-low support.
High Risk Investment Warning
Trading Forex/CFDs on margin carries a high level of risk and may not be suitable for all investors. Leverage can work against you.
Stratos Markets Limited (tradu.com ):
CFDs are complex instruments and come with a high risk of losing money rapidly due to leverage. 63% of retail investor accounts lose money when trading CFDs with this provider. You should consider whether you understand how CFDs work and whether you can afford to take the high risk of losing your money.
Stratos Europe Ltd (tradu.com ):
CFDs are complex instruments and come with a high risk of losing money rapidly due to leverage. 63% of retail investor accounts lose money when trading CFDs with this provider. You should consider whether you understand how CFDs work and whether you can afford to take the high risk of losing your money.
Stratos Global LLC (tradu.com ):
Losses can exceed deposits.
Please be advised that the information presented on TradingView is provided to Tradu (‘Company’, ‘we’) by a third-party provider (‘TFA Global Pte Ltd’). Please be reminded that you are solely responsible for the trading decisions on your account. There is a very high degree of risk involved in trading. Any information and/or content is intended entirely for research, educational and informational purposes only and does not constitute investment or consultation advice or investment strategy. The information is not tailored to the investment needs of any specific person and therefore does not involve a consideration of any of the investment objectives, financial situation or needs of any viewer that may receive it. Kindly also note that past performance is not a reliable indicator of future results. Actual results may differ materially from those anticipated in forward-looking or past performance statements. We assume no liability as to the accuracy or completeness of any of the information and/or content provided herein and the Company cannot be held responsible for any omission, mistake nor for any loss or damage including without limitation to any loss of profit which may arise from reliance on any information supplied by TFA Global Pte Ltd.
The speaker(s) is neither an employee, agent nor representative of Tradu and is therefore acting independently. The opinions given are their own, constitute general market commentary, and do not constitute the opinion or advice of Tradu or any form of personal or investment advice. Tradu neither endorses nor guarantees offerings of third-party speakers, nor is Tradu responsible for the content, veracity or opinions of third-party speakers, presenters or participants.
Dogeusd

DOGE ANALYSIS (12H)Based on the current available data, it appears that Dogecoin has entered a bullish phase after completing the diametric pattern marked on the chart. We are currently in wave B of this bullish phase.
Wave B may complete within the green zone, which is a key support area.
The targets for wave C have been marked on the chart.
A daily candle closing below the invalidation level would negate this outlook.
For risk management, please don't forget stop loss and capital management
Comment if you have any questions
Thank You

Dogecoin - Don't forget the dog now!Dogecoin - CRYPTO:DOGEUSD - still remains quite bullish:
(click chart above to see the in depth analysis👆🏻)
Basically during every major bullrun on Dogecoin, we always saw a correction of at least -60%. Therefore the recent drop of -70% was not a surprise at all but rather a natural all time high rejection. If Dogecoin manages to now create bullish confirmation, the bullrun will continue.
Levels to watch: $0.2. $0.5
Keep your long term vision!
Philip (BasicTrading)

DOGEUSDT 1D AnalysisDOGE ~ 1D Analysis
#DOGE Buy back gradually from here with a short term target of at least 15%+, Long term target $0.5

DOGE/USD 1H Short-term1. General situation on the chart
Trend: The last few dozen candles show a sideways movement with a stronger upward impulse, which was quickly corrected. We are currently seeing declines after the previous upward wave.
Current price: Approx. 0.1847 USDT.
Last structure: After the upward movement (peak around 0.205), the price dropped quite a bit, now consolidating below 0.19.
2. Formations and structures
Formation:
No clear classic formation (e.g. head-and-shoulders, triangle, flags) on the last candles.
However, something like a local peak ("double top") is visible around 0.203–0.205 — the price touched these areas twice and fell off, which suggests that this is a strong resistance.
Support and resistance:
Support: 0.1800–0.1820 — here is the last local low and the area where the price stopped before the previous upward movement.
Next support: 0.1740–0.1750 — the next low from the previous movements.
Resistance: 0.1900–0.1910 — here was the last consolidation, and then a sharp decline.
Strong resistance: 0.2030–0.2050 (recent highs).
3. Indicators
RSI:
RSI value close to 40 and is heading slightly down, but it is not oversold yet. This may suggest that there is potentially room for further decline.
MACD:
Histogram below the 0 line, MACD line below the signal, the bearish signal is still maintained.
4. Signals and potential scenarios
Base scenario (downside):
If the price breaks below 0.1820, the next target is around 0.1750.
Stop loss in this scenario: above the last resistance, e.g. 0.1910.
Alternative scenario (rebound):
If the price does not break 0.1820, and a demand reaction occurs - we may see an attempt to return to 0.1900, or even to the peaks in the area of 0.2000–0.2050.
Stop loss below 0.1800 (in the case of a long play).
5. Potential targets (by price action):
Short:
TP1: 0.1820 (nearest support, you can take some profit)
TP2: 0.1750 (next low, main target)
Long:
TP1: 0.1900 (nearest resistance)
TP2: 0.2000–0.2050 (highs, if the movement is strong)
Summary
Currently, the chart suggests a bearish scenario.
This is confirmed by the candlestick pattern, negative dynamics and indicators (RSI, MACD).
Key level to watch: 0.1820 – if it falls, we will probably go down to 0.1750.
If there is strong demand for 0.1820, a rebound to 0.19+ is possible.

DOGEUSDT BINANCE:DOGEUSDT Price is ranging between 0.18200 and 0.18650 dollars after a sharp rise from 0.17000. A break above 0.186 triggers a buy, targeting 0.19450 and 0.19950 dollars. A break below 0.182 triggers a sell, with supports at 0.17650 and 0.17000 dollars.
Trigger Levels:
Buy Trigger: 0.186
Sell Trigger: 0.182
⚠️Contorl Risk management for trades.

DOGE | BULLISH Pattern | +100%DOGE is seemingly ready for more upside as we start to see a pattern resembling an inverse head and shoulders pattern:
✅Usually, the Inverse H&S plays out something like this:
📢But the pattern is not quite confirmed just yet. We'd need to see a close ABOVE the current resistance zone to validate the pattern:
If we can see that, it's likely that there can be BIG gains on DOGE. It will especially help if ETH makes more increases, showing that the general alt market is heading in the right direction.
____________________
BINANCE:DOGEUSDT

Doge H1 | Pullback support at 38.2% Fibonacci retracementDoge (DOGE/USD) is falling towards a pullback support and could potentially bounce off this level to climb higher.
Buy entry is at 0.1857 which is a pullback support that aligns with the 38.2% Fibonacci retracement.
Stop loss is at 0.1770 which is a level that lies underneath a swing-low support and the 61.8% Fibonacci retracement.
Take profit is at 0.1990 which is a swing-high resistance that aligns close to the 50.0% Fibonacci retracement.
High Risk Investment Warning
Trading Forex/CFDs on margin carries a high level of risk and may not be suitable for all investors. Leverage can work against you.
Stratos Markets Limited (tradu.com ):
CFDs are complex instruments and come with a high risk of losing money rapidly due to leverage. 63% of retail investor accounts lose money when trading CFDs with this provider. You should consider whether you understand how CFDs work and whether you can afford to take the high risk of losing your money.
Stratos Europe Ltd (tradu.com ):
CFDs are complex instruments and come with a high risk of losing money rapidly due to leverage. 63% of retail investor accounts lose money when trading CFDs with this provider. You should consider whether you understand how CFDs work and whether you can afford to take the high risk of losing your money.
Stratos Global LLC (tradu.com ):
Losses can exceed deposits.
Please be advised that the information presented on TradingView is provided to Tradu (‘Company’, ‘we’) by a third-party provider (‘TFA Global Pte Ltd’). Please be reminded that you are solely responsible for the trading decisions on your account. There is a very high degree of risk involved in trading. Any information and/or content is intended entirely for research, educational and informational purposes only and does not constitute investment or consultation advice or investment strategy. The information is not tailored to the investment needs of any specific person and therefore does not involve a consideration of any of the investment objectives, financial situation or needs of any viewer that may receive it. Kindly also note that past performance is not a reliable indicator of future results. Actual results may differ materially from those anticipated in forward-looking or past performance statements. We assume no liability as to the accuracy or completeness of any of the information and/or content provided herein and the Company cannot be held responsible for any omission, mistake nor for any loss or damage including without limitation to any loss of profit which may arise from reliance on any information supplied by TFA Global Pte Ltd.
The speaker(s) is neither an employee, agent nor representative of Tradu and is therefore acting independently. The opinions given are their own, constitute general market commentary, and do not constitute the opinion or advice of Tradu or any form of personal or investment advice. Tradu neither endorses nor guarantees offerings of third-party speakers, nor is Tradu responsible for the content, veracity or opinions of third-party speakers, presenters or participants.

#DOGE/USDT#DOGE
The price is moving within a descending channel on the 1-hour frame and is expected to break and continue upward.
We have a trend to stabilize above the 100 moving average once again.
We have a downtrend on the RSI indicator, which supports the upward move by breaking it upward.
We have a support area at the lower limit of the channel at 0.1800, acting as strong support from which the price can rebound.
Entry price: 0.1838
First target: 0.1886
Second target: 0.1928
Third target: 0.1972

I positioned here — while others waited for confirmation.This was a textbook setup. Clean structure, high-probability narrative, and the kind of zone that doesn’t ask for your belief — it commands it.
Breakdown:
Price delivered a sharp move into a 1H OB confluence with an untouched 60min FVG sitting just below. That OB wasn’t noise — it was a true origin point, the last down candle before a major rally.
As price retraced, it swept short-term liquidity and tapped into that OB with precision. I watched volume spike on the drop — not retail fear, but Smart Money engineering the entry.
The 0.1795 zone wasn’t random. It was deliberate. A key equilibrium between displacement and rebalancing. And if this holds, the next logical draw is above 0.1860 — into the unmitigated FVG and resting buy-side liquidity.
Expectation:
From this 1H OB / FVG stack, I’m looking for:
Entry: ~0.1795
SL: Just under the 1.0 fib — under 0.1777
TP1: Mid FVG at 0.1831 (0.5)
TP2: Full inefficiency fill at 0.1887
I’m not forcing anything. If the market wants lower, there’s another FVG just below to absorb it — but structure still favors premium re-pricing.
Final note:
I don’t chase breakouts. I trap Smart Money setups, wait in silence — and strike when the chart gives me the story.
“The market doesn’t move by chance. It moves by design. And I design my trades the same way.”

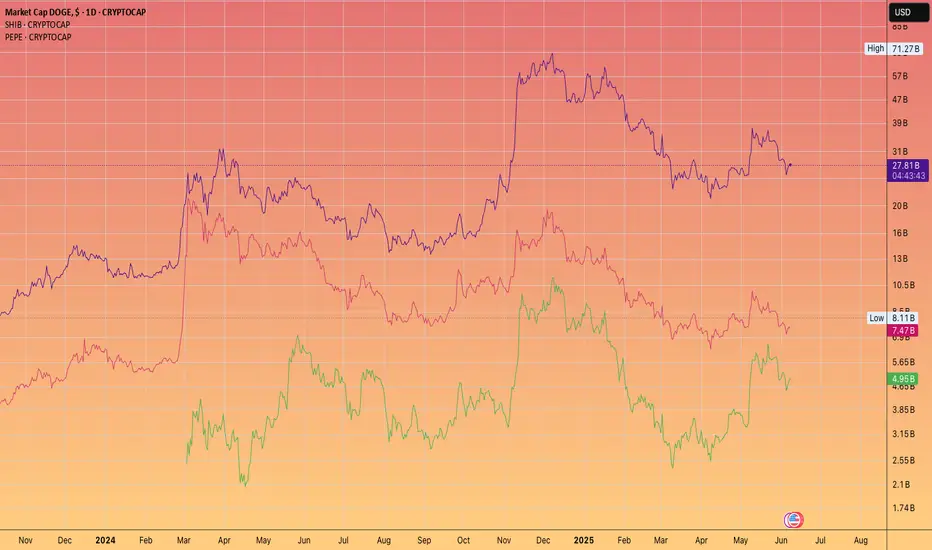
Pepe is going flip SHIB. But can it catch Dogecoin?If Ethereum were to smash $10k
Then it has a genuine chance IMHO
We shall be watching and tracking this as the cycle reaches it's mania phase!
DOGEUSDT 1D Analysis DOGE ~ 1D Analysis
#DOGE Buy back gradually from here with a short term target of at least 15%+ from here.

They see relief. I see rebalancing.BINANCE:DOGEUSDT.P isn't bullish — it's rebalancing. What we’re witnessing now is price doing what it always does after manipulation: return to efficiency before delivering its next displacement.
Here’s the setup:
Price tapped into the 4H discount zone — a structural STB
We’re now reacting from the 0.618 (0.1940) and pushing up toward the 4H OB at 0.20403
That OB is perfectly nested just above the 0.5 fib (0.20190), and below the 0.382 (0.20970) — prime for internal liquidity collection
If price fails to break structure above that 4H OB, the move is complete. This isn’t bullish continuation — it’s cleanup. From there, I’m watching closely for signs of rejection and displacement back toward the OB + BTS zone near 0.16884.
This is where real risk is priced in — and where Smart Money actually loads up.
Execution mindset:
Let price reach into 0.204–0.209
Watch for rejection — that’s the trigger
Downside target: 0.18299 → 0.16884
If we impulsively break 0.2097 and reclaim it, the bearish thesis is invalidated and I’ll re-evaluate
This isn’t trading a bounce. It’s reading the cleanup.
You want real entries, real invalidations, real structure? Check the profile description. The trades speak louder than the noise.

DOGEUSD Fibonacci Channel shows minimum $1 Target end of year.Dogecoin (DOGEUSD) has held perfectly its 1W MA200 (orange trend-line) on the April 07 bottom, rebounded and is now consolidating around its 1W MA50 (blue trend-line). This consolidation shouldn't last for too long as based on the previous Cycles, this 1W MA200 test was the new bottom that should kick-start the final year rally.
As you can see, DOGE's historic pattern since its first trading day has been a Channel Up, which with the added element of the Fibonacci lines, only broke during the 2021 Top formation on its 1.5 Fib extension.
A key characteristic of the final year of each Bull Cycle is that after a 1W Golden Cross is formed, the price has always first hit the Mayer Multiple Bands (MMB) 2SD above (thin orange trend-line) and shortly after the MMB 3SD above (thin red trend-line).
So far the current Cycle has only hit the MMB 2SD because as the pace of this Cycle naturally slowed down (the higher the cap the slower the pace), it didn't go straight for a MMB 3SD test.
Despite the delay, the Fibonacci Channel along with the MMB give, in our opinion, two Target levels for this final year of the Cycle, a fair one and an optimistic. The fair one is at $1.00, which would make a perfect test of both the MMB 3SD and the 1.0 Fib ext at the top of the Channel Up. The optimistic is at $3.5 (potentially even higher), which would be exactly on the 1.618 horizontal Fibonacci extension (still below the 1.5 Channel Fib), which was the January 2018 Cycle Top and of course was greatly exceeded during the May 2021 Cycle Top.
-------------------------------------------------------------------------------
** Please LIKE 👍, FOLLOW ✅, SHARE 🙌 and COMMENT ✍ if you enjoy this idea! Also share your ideas and charts in the comments section below! This is best way to keep it relevant, support us, keep the content here free and allow the idea to reach as many people as possible. **
-------------------------------------------------------------------------------
💸💸💸💸💸💸
👇 👇 👇 👇 👇 👇

Price tapped the discount — now it’s time to test premium.This setup on DOGE/USDT was mechanical. Not emotional.
I’ve seen this formation enough to know what comes next. The chart has already spoken.
After a clean markdown into the 4H OB, price hit the 0.786 retracement level — right inside a prior imbalance zone. That wasn’t a random drop. That was engineered. Liquidity was swept, sentiment reset, and now we have structure ready to reverse.
Notice this:
We’re sitting in a 4H demand OB with confluence from the FVG just above.
The Fibonacci levels are aligning with Smart Money delivery: 0.5 sits right at the base of the new rally expectation.
The 0.20928 level is the first key reaction point — I expect a stall or consolidation there.
But the real test comes higher: the 0.22094 OB, which also aligns with the 0.382 fib level — the market’s threshold between discount and premium.
I’ll be watching price closely on its approach into that 0.209–0.22094 region. If it delivers clean displacement through FVG, the next liquidity grab sets up a premium continuation model.
If we reject early — that tells me distribution is starting, and I’ll prep for a secondary sweep below 0.18 to retest the deeper 4H OB near 0.16387.
This setup didn’t require a confirmation signal.
It required understanding why price dropped — and where it’s designed to go.
I don’t need to guess. I just need to be aligned.

The key is whether it can find support at 0.18951 and go up
Hello, traders.
If you "Follow", you can always get new information quickly.
Have a nice day today.
-------------------------------------
(DOGEUSDT 1D chart)
It touched the A section, which was the previous breakout trading section, again.
That is, if it is supported and rises near 0.18951, it is a time to buy.
If not, it will fall below the M-Signal indicator of the 1M chart, so caution is required when trading.
This is because in order to continue the upward trend in the medium to long term, the price must be maintained above the M-Signal indicator of the 1M chart.
Therefore, a short and quick response is required when trading below the M-Signal indicator of the 1M chart.
-
The channel of the High Line ~ Low Line of the OBV indicator is showing signs of turning into a downward channel.
Therefore, you should check whether the OBV shows signs of rising above the High Line.
-
The basic trading strategy is to buy near the HA-Low indicator and sell near the HA-High indicator.
It currently meets the HA-High indicator and falls to meet the HA-Low indicator.
Therefore, this wave should be interpreted as closed.
Therefore, a new wave will start from the HA-Low indicator that we met this time.
If it falls from the HA-Low indicator, it is likely to show a stepwise downtrend, and if it rises from the HA-High indicator, it is likely to show a stepwise uptrend.
Therefore, we need to check whether the HA-Low indicator supports the new wave to see if it is a downtrend or an uptrend.
-
Thank you for reading to the end.
I hope you have a successful trade.
--------------------------------------------------
- This is an explanation of the big picture.
(3-year bull market, 1-year bear market pattern)
I will explain more details when the bear market starts.
------------------------------------------------------

#DOGEUSDT: Swing Buy Coming Up, Get Ready Dear Traders,
Price of Dogecoin has dropped similarly to the other crypto pairs, price is on the way to fill the void area and then we can see price reversal. Wait for price to drop a bit more than you can enter a buy entry, taking price to a new level.

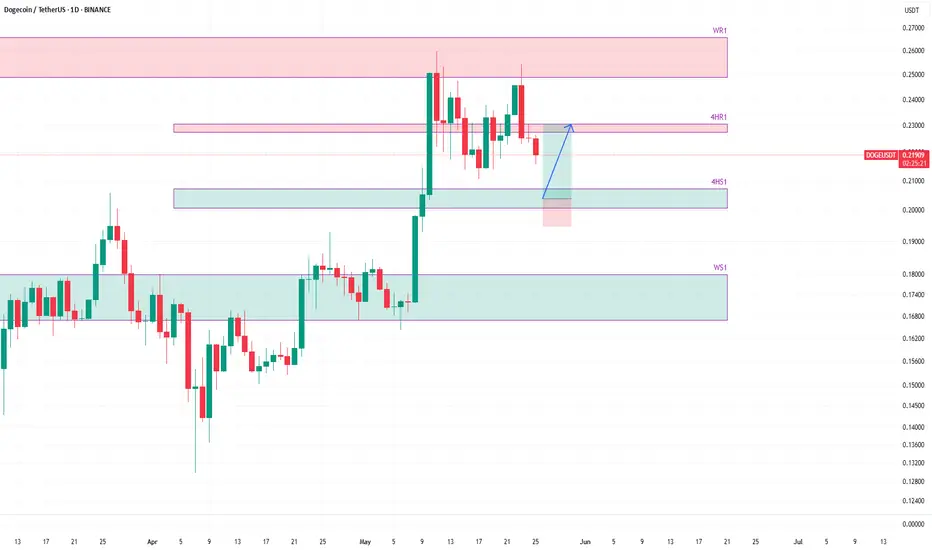
DOGEUSDT to drop to 4h support before bounceHere is analysis of DOGEUSDT support and resistances.
The price was rejected from weekly resistance zone WR1 two time. The price is currently on downward move. An next support on the way is 4h support 4HS1 and the next one is weekly support WS1.
The price is likely to bounce from 4h support 4HS1. This will provide a long opportunity from 4HS1 towards the 4h resistance 4HR1.
The possibility that the price may touch WS1 again on this current downward move, beyond some bounces which we are planning to exploit for long setups, is real.
Lets wait and watch while we take the given trade and review the price reaction on touching 4HR1 on the expected bounce from 4HS1.
DOGE can be worth many DOLLAR'SGrok, the AI supercomputer interface on Elon Musk’s X platform, predicts that Dogecoin might hit $10 between 2029 and 2040.
While I remain hopeful, I believe that a more realistic target could be around 3-5 dollars by the end of this decade. This could potentially trigger a significant blowoff top, leading to an extended bear market for cryptocurrencies.
When you examine this chart, it’s hard not to appreciate its beauty, comparable to Bitcoin, as it showcases a well-defined uptrend and follows cyclical rises and falls. This has resulted in Dogecoin creating numerous millionaires. The pressing question is whether those investors who currently hold 250,000 coins will become the next wave of millionaires in just a few years?

DOGE/USD "DogeCoin vs U.S Dollar" Crypto Heist Plan (Day/Swing)🌟Hi! Hola! Ola! Bonjour! Hallo! Marhaba!🌟
Dear Money Makers & Robbers, 🤑 💰💸✈️
Based on 🔥Thief Trading style technical and fundamental analysis🔥, here is our master plan to heist the DOGE/USD "DogeCoin vs U.S Dollar" Crypto Market. Please adhere to the strategy I've outlined in the chart, which emphasizes long entry. Our aim is to escape near the high-risk ATR Line Zone. Risky level, overbought market, consolidation, trend reversal, trap at the level where traders and bearish robbers are stronger. 🏆💸"Take profit and treat yourself, traders. You deserve it!💪🏆🎉
Entry 📈 : "The heist is on! Wait for the MA breakout (0.19000) then make your move - Bullish profits await!"
however I advise to Place Buy stop orders above the Moving average (or) Place buy limit orders within a 15 or 30 minute timeframe most recent or swing, low or high level for Pullback entries.
📌I strongly advise you to set an "alert (Alarm)" on your chart so you can see when the breakout entry occurs.
Stop Loss 🛑: "🔊 Yo, listen up! 🗣️ If you're lookin' to get in on a buy stop order, don't even think about settin' that stop loss till after the breakout 🚀. You feel me? Now, if you're smart, you'll place that stop loss where I told you to 📍, but if you're a rebel, you can put it wherever you like 🤪 - just don't say I didn't warn you ⚠️. You're playin' with fire 🔥, and it's your risk, not mine 👊."
📍 Thief SL placed at the nearest/swing low level Using the 1H timeframe (0.16800) Day / Swing trade basis.
📍 SL is based on your risk of the trade, lot size and how many multiple orders you have to take.
🏴☠️Target 🎯: 0.21100 (or) Escape Before the Target
🧲Scalpers, take note 👀 : only scalp on the Long side. If you have a lot of money, you can go straight away; if not, you can join swing traders and carry out the robbery plan. Use trailing SL to safeguard your money 💰.
💰💵💸DOGE/USD "DogeCoin vs U.S Dollar" Crypto Market Heist Plan (Scalping/Day) is currently experiencing a bullishness,., driven by several key factors. .☝☝☝
📰🗞️Get & Read the Fundamental, Macro, COT Report, On Chain Analysis, Sentimental Outlook, Intermarket Analysis, Future trend targets... go ahead to check 👉👉👉🔗🔗🔗
⚠️Trading Alert : News Releases and Position Management 📰🗞️🚫🚏
As a reminder, news releases can have a significant impact on market prices and volatility. To minimize potential losses and protect your running positions,
we recommend the following:
Avoid taking new trades during news releases
Use trailing stop-loss orders to protect your running positions and lock in profits
💖Supporting our robbery plan 💥Hit the Boost Button💥 will enable us to effortlessly make and steal money 💰💵. Boost the strength of our robbery team. Every day in this market make money with ease by using the Thief Trading Style.🏆💪🤝❤️🎉🚀
I'll see you soon with another heist plan, so stay tuned 🤑🐱👤🤗🤩

DOGE Analysis (4H)It appears that Dogecoin's correction has started from the point where we placed the red arrow on the chart. This correction seems to be a flat pattern, with the first two parts forming a diametric and a triangle.
If the price reaches the green zone | which is a key area | we can start looking for buy/long positions.
Targets : 0.23092 _ 0.25283 _ 0.29426 _ 0.32217
A daily candle closing below the invalidation level will invalidate this analysis.
For risk management, please don't forget stop loss and capital management
Comment if you have any questions
Thank You

Next Breakout Trading Zone: 0.26850
Hello, traders.
If you "Follow", you can always get new information quickly.
Have a nice day today.
-------------------------------------
(DOGEUSDT 1D chart)
It is expected that a breakout trade will be possible when the B zone breaks upward.
Conditions for a breakout trade:
1. OBV must show an upward trend. If possible, it is good to see an upward breakout of the High Line.
2. It should show that the StochRSI indicator maintains the K > D status. If possible, it is good if K does not enter the overbought zone.
If it rises above 0.24651, you should check if the OBV and StochRSI indicators meet the breakout trading conditions.
If it fails to rise, you should check if it is supported around 0.21409-0.22958.
If the price maintains above the M-Signal indicator on the 1M chart, it is likely to continue the upward trend.
-
Thank you for reading to the end.
I wish you successful trading.
--------------------------------------------------
- This is an explanation of the big picture.
(3-year bull market, 1-year bear market pattern)
(3-year bull market, 1-year bear market pattern)
I will explain more details when the bear market starts.
------------------------------------------------------

DOGECOIN (FREE SIGNAL)Hello friends
Given the good growth we had, the price has corrected and now is a good time to buy step by step and with capital management...
We have specified the purchase steps for you and the target is also specified...
*Trade safely with us*
