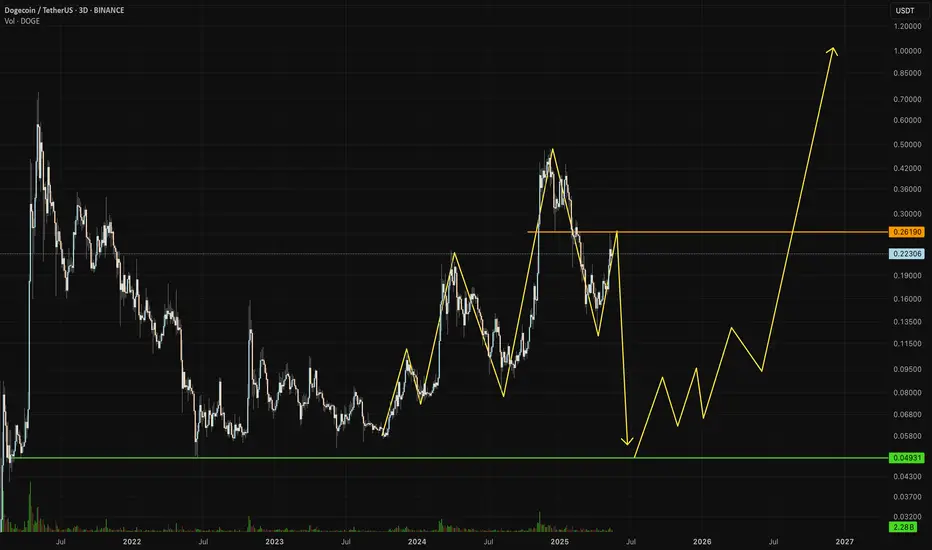
DOGE LONG TERMMy scenario is like this.
* The purpose of my graphic drawings is purely educational.
* What i write here is not an investment advice. Please do your own research before investing in any asset.
* Never take my personal opinions as investment advice, you may lose your money.
Dogeusd

DOGE Awakens: Breakout from Descending Channel!!BINANCE:DOGEUSDT has finally broken free from its long-term descending channel, signaling a potential trend reversal after months of consolidation. What makes this move significant is the current retest of the previous local breakout level. A classic bullish setup that often leads to strong upward continuation if the retest holds.
The price action is also showing early signs of strength, forming a series of higher highs, which further confirms the bullish structure. This technical development, combined with CRYPTOCAP:DOGE ’s passionate fanbase and historical tendency to pump hard when momentum kicks in, could make this a high-potential setup.
As always, proper risk management is key. While the chart looks promising, it’s crucial to place a stop loss to protect against invalidation. If the support holds, CRYPTOCAP:DOGE could be preparing for a big move — possibly one of those signature rallies that only CRYPTOCAP:DOGE knows how to deliver.
BINANCE:DOGEUSDT Currently trading at $0.181
Buy level : Above $0.17
Stop loss : Below $0.141
Target : $0.435
Max leverage 3x
Always keep stop loss
Follow Our Tradingview Account for More Technical Analysis Updates, | Like, Share and Comment Your thoughts

"DOGE - Time to buy again!" (Update)So if you pay attention to the doge chart you can see that the price has formed a Ascending FLAG or wedge which means it is expected to price move as equal as the measured price movement.( AB=CD )
NOTE: wait for break of the FLAG .
Give me some energy !!
✨We spend hours finding potential opportunities and writing useful ideas, we would be happy if you support us.
Best regards CobraVanguard.💚
_ _ _ _ __ _ _ _ _ _ _ _ _ _ _ _ _ _ _ _ _ _ _ _ _ _ _ _ _ _ _ _
✅Thank you, and for more ideas, hit ❤️Like❤️ and 🌟Follow🌟!
⚠️Things can change...
The markets are always changing and even with all these signals, the market changes tend to be strong and fast!!

DOGE monthly grows is hereIf we check Dogecoin on monthly timeframe and compare that to the previous cycle:
1) 20 & 50 MA on monthly held the price
2) The RSI level is too low and has a lot of room to growth to about 80 level
3) The support held
4) Six months growth gives October 2025
5) June & July most be pretty bullish

DOGEUSDT 1D Analysis DOGE ~ 1D Analysis
#DOGE Buy after successfully breaking this resistance line with a short term target of at least 10%+ from here.

DOGE About to Explode? Key Levels to Watch!Yello, Paradisers! Are you watching #DOGE closely? Because a breakout is forming right in front of our eyes, and most traders won’t be ready for it.
💎After completing a clean ABC correction, DOGE formed an inverse head and shoulders pattern which is a classic bottom structure that has already initiated its breakout with a strong first push from the bulls. This was a major shift in sentiment, and momentum is clearly shifting in favor of buyers.
💎#DOGEUSDT is currently forming a bullish flag patten, a consolidation pattern that signals continuation rather than exhaustion. This ongoing flag has held firm over the past few days, and price is now coiling tighter, indicating that a fresh breakout is nearing. If the bulls maintain control, the next leg higher is about to be triggered.
💎The critical level to watch is $0.2325. A clean break above this resistance would activate the next impulse move, opening the door toward $0.250 as the first target, followed by $0.2620. That is where some profit-taking is likely to occur, but as long as bulls hold momentum, the rally is unlikely to stop there.
💎The full target of the bull flag formation extends into the $0.300–$0.3200 region. This area is not just a technical objective rather it’s also a strong horizontal resistance zone and aligns with the 61.8% Fibonacci retracement level from the previous move down. This convergence makes it a high-risk, high-reward area and a critical decision point for the market.
💎DOGE remains technically supported at the $0.2100 level, which has proven resilient during short-term pullbacks. Below that, both the EMA-200 and EMA-50 are providing additional support. These two moving averages are on the verge of forming a golden cross — one of the strongest signals in trend continuation analysis, reinforcing the medium-term bullish outlook.
Paradisers, strive for consistency, not quick profits. Treat the market as a businessman, not as a gambler.
MyCryptoParadise
iFeel the success🌴

DOGEUSDT - Worth to Take Some RisksBINANCE:DOGEUSDT — Buyer Stepping in After the Sweep?
BINANCE:DOGEUSDT just pulled a textbook move I’ve seen play out hundreds of times — swept a key low, triggered stops, then snapped back up. That’s never accidental.
I’ve been watching this carefully, and I believe we just entered an area with a real buyer behind it.
🔵 Blue Box: Hidden Demand Zone
Price made a new local low, then quickly reversed, printing a bullish engulfing candle on high volume — but here’s what matters more:
On the drop, CDV didn’t follow. That’s a subtle but powerful divergence that shows aggressive selling wasn't truly present — just a liquidity sweep.
Now price is hovering above that zone. This blue box is where I believe the real position was built. If we come back down and test it with weak selling and small-bodied candles, I’m looking for an entry.
🔁 Game Plan
If price pulls back into the blue box and shows buyer defense on the 1m/5m, I’ll enter long. Simple.
If we break lower again but reclaim the box with force and retest it cleanly, I’ll also long that reclaim.
No long if the zone breaks cleanly and volume confirms the breakdown — I’ll reassess for shorts only if it retests from below.
I will not insist on my long idea.
If this level gives way and doesn’t reclaim with conviction, I’ll step aside.
But if it reclaims and gives me confirmation, I’ll take it.
📊 Order Flow & Volume
This entire sweep was followed by a volume spike into the low and a delta absorption pattern — price moved down, but aggressive buyers were filling in. That’s never retail.
Now we’re seeing low effort in pushes downward. That’s when traps get set. Don’t be surprised if we see a sharp move upward in the next sessions.
🧠 Final Word
Most traders will only see a “double bottom” if this plays out. They won’t realize the liquidity grab has already happened.
If you ignore this level, you might regret it.
This is how the big moves start — quietly, after the sweep, before the crowd even notices.
And these are the setups that have built my high win rate.
📌I keep my charts clean and simple because I believe clarity leads to better decisions.
📌My approach is built on years of experience and a solid track record. I don’t claim to know it all but I’m confident in my ability to spot high-probability setups.
📌If you would like to learn how to use the heatmap, cumulative volume delta and volume footprint techniques that I use below to determine very accurate demand regions, you can send me a private message. I help anyone who wants it completely free of charge.
🔑I have a long list of my proven technique below:
🎯 ZENUSDT.P: Patience & Profitability | %230 Reaction from the Sniper Entry
🐶 DOGEUSDT.P: Next Move
🎨 RENDERUSDT.P: Opportunity of the Month
💎 ETHUSDT.P: Where to Retrace
🟢 BNBUSDT.P: Potential Surge
📊 BTC Dominance: Reaction Zone
🌊 WAVESUSDT.P: Demand Zone Potential
🟣 UNIUSDT.P: Long-Term Trade
🔵 XRPUSDT.P: Entry Zones
🔗 LINKUSDT.P: Follow The River
📈 BTCUSDT.P: Two Key Demand Zones
🟩 POLUSDT: Bullish Momentum
🌟 PENDLEUSDT.P: Where Opportunity Meets Precision
🔥 BTCUSDT.P: Liquidation of Highly Leveraged Longs
🌊 SOLUSDT.P: SOL's Dip - Your Opportunity
🐸 1000PEPEUSDT.P: Prime Bounce Zone Unlocked
🚀 ETHUSDT.P: Set to Explode - Don't Miss This Game Changer
🤖 IQUSDT: Smart Plan
⚡️ PONDUSDT: A Trade Not Taken Is Better Than a Losing One
💼 STMXUSDT: 2 Buying Areas
🐢 TURBOUSDT: Buy Zones and Buyer Presence
🌍 ICPUSDT.P: Massive Upside Potential | Check the Trade Update For Seeing Results
🟠 IDEXUSDT: Spot Buy Area | %26 Profit if You Trade with MSB
📌 USUALUSDT: Buyers Are Active + %70 Profit in Total
🌟 FORTHUSDT: Sniper Entry +%26 Reaction
🐳 QKCUSDT: Sniper Entry +%57 Reaction
📊 BTC.D: Retest of Key Area Highly Likely
📊 XNOUSDT %80 Reaction with a Simple Blue Box!
📊 BELUSDT Amazing %120 Reaction!
📊 Simple Red Box, Extraordinary Results
I stopped adding to the list because it's kinda tiring to add 5-10 charts in every move but you can check my profile and see that it goes on..

DOGE going homeDOGE to revisit 0.049 - 0.050 zone in the coming flush crash then riding the bullrun wave
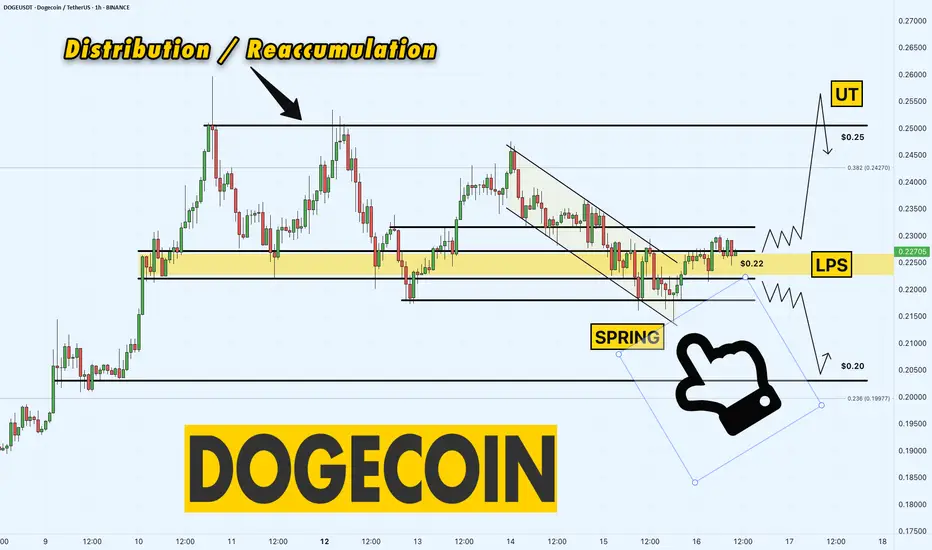
DOGE/USDT 1-Hour Chart – Distribution or Reaccumulation?Dogecoin is at a critical juncture on the 1-hour chart!
We’re seeing signs of a Distribution/Reaccumulation phase, with the price action teasing a potential move. After a possible Spring shakeout at $0.215, DOGE has climbed into the Last Point of Support (LPS) range between $0.22 and $0.23. This could be a launching pad for a bullish move!
I’m watching for a push toward $0.25, where we might see a UT (Upthrust) structure form — a solid target for this setup. However, if the price fails to hold, a breakdown below $0.22 could send us toward the $0.20 level, a key support to watch. The $0.22-$0.23 zone is critical right now — will bulls take control, or will bears strike back? Let’s find out!
Key Levels to Watch:
Support: $0.22 (LPS range), $0.20 (breakdown target)
Resistance: $0.23 (upper LPS range)
Target: $0.25 (potential UT structure)
What’s your call, traders? Are we heading for $0.25, or will $0.20 come into play ? Drop your thoughts below!
Dogecoin (DOGE) OverboughtI have been trading for a long time using the DCA strategy indicator that I have developed and I have recently published the indicator on my Tradingview page.
According to this indicator, I have been buying DOGEs at support levels with more money than I would have thrown away so far. This support level is generally seen at $0.056. In addition, I dumped some of my DOGE at $0.2285, but then bought again at $0.107. I have already shared this analysis.
I think that DOGE, which has broken through two resistances, will advance at least up to $0.75 (potential 89% return). But for this progress, I think that it must first find support at the $0.2285 level, which was broken again. This is because the indicator also gives an overbought signal. Therefore, I will tailor my portfolio accordingly. But I wouldn't be surprised if it continues relentlessly.
As long as Elon Musk remains in government, I think this cryptocurrency will be on a continuous upward trend.

Dogecoin Buy Signal: Will the Channel Break Today?Hello friends
Given the good growth we had, you can see that the price has taken a break, which can be used as a buying opportunity.
We have identified the buying steps for you to buy in steps and move to the specified goals.
*Trade safely with us*

DOGEUSD Massive Bull Flag targets $0.40 like late 2024!Dogecoin (DOGEUSD) is posting a Bull Flag pattern on the 4H time-frame, being supported by the 4H MA50 (blue trend-line).
A similar Bull Flag was formed at the start of its previous major rally in October 2024, which made the price jump to the 2.0 Fibonacci extension, in as much time as it took for the price to reach the Bull Flag's start from the bottom.
As a result, we expect DOGE's next short-term Target to be $0.40.
-------------------------------------------------------------------------------
** Please LIKE 👍, FOLLOW ✅, SHARE 🙌 and COMMENT ✍ if you enjoy this idea! Also share your ideas and charts in the comments section below! This is best way to keep it relevant, support us, keep the content here free and allow the idea to reach as many people as possible. **
-------------------------------------------------------------------------------
💸💸💸💸💸💸
👇 👇 👇 👇 👇 👇

"DOGE - Time to buy again!" (Update)Finally, this pattern was broken and had a positive impact, leading to significant growth. Now, with a slight price correction, higher price levels can be reached.
PREVIOUS ANALYSIS
Stay Awesome , CobraVanguard

#DOGE/USDT#DOGE
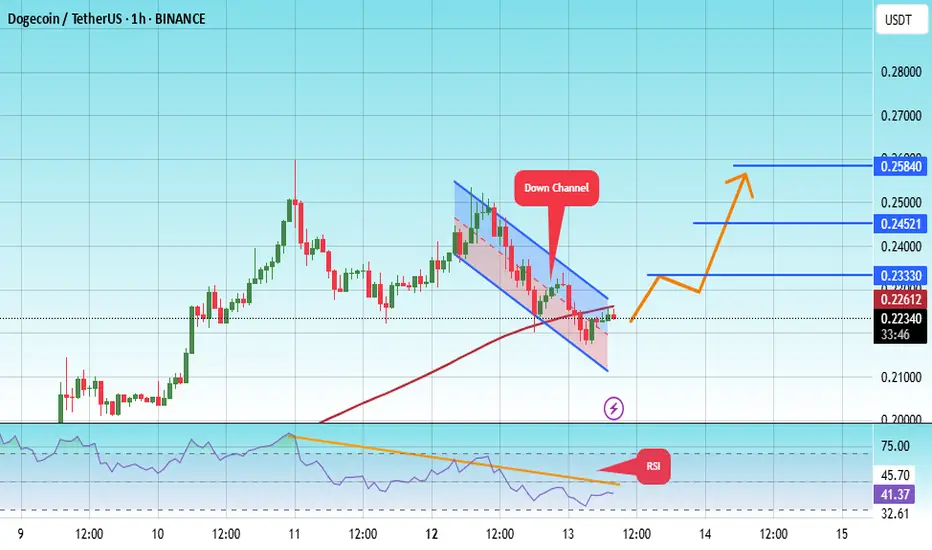
The price is moving within a descending channel on the 1-hour frame, adhering well to it, and is on its way to breaking it strongly upwards and retesting it.
We are seeing a bounce from the lower boundary of the descending channel, this support at 0.2136.
We have a downtrend on the RSI indicator that is about to break and retest, supporting the upward trend.
We are looking for stability above the 100 Moving Average.
Entry price: 0.21390
First target: 0.23330
Second target: 0.24521
Third target: 0.25840
"DogeCoin" Crypto Heist - Bullish Breakout Plan!🌍 DOGEUSDT Crypto Heist Plan: Unleash the Thief Trading Style! 🤑💸🚀
Dear Market Mavericks & Crypto Bandits, 🏴☠️
Get ready to pull off the ultimate DOGEUSDT market heist with our Thief Trading Style, blending razor-sharp technical analysis and cunning fundamental insights! 📊🔥 Our mission? Storm the market, grab those bullish profits, and escape before the Dangerous Red Zone traps us in overbought chaos, consolidation, or a bearish reversal. 💥 Let’s outsmart the market and cash out like legends! 🏆🎉
📈 The Heist Blueprint: Long Entry Strategy
Entry Point 🚪:
The breakout is your signal! Wait for DOGEUSDT to smash through the Moving Average (MA) at 0.28000—that’s your green light for bullish glory! 🌟
Pro Tip:
Set Buy Stop Orders just above the MA for breakout confirmation.
OR place Buy Limit Orders at the most recent 15M/30M swing low/high for pullback entries.
Set an ALERT on your chart to catch the breakout in action! 🔔
Stop Loss (SL) 🛑:
Breakout traders: Hold off on setting your SL until the breakout confirms. Place it at the recent 1D swing low (0.2000) for swing/day trades.
Risk Management: Adjust SL based on your lot size, risk tolerance, and multiple orders. Play it smart—this is your safety net! ⚠️
Rebels beware: If you stray from the plan, you’re dancing with fire. Own the risk! 🔥
Take Profit (TP) 🎯:
Aim for 0.42000 — our golden exit.
Escape Plan: If the market screams overbought or shows reversal signs, get out early! Don’t get caught in the Red Zone trap. 🚨
🧲 Scalpers’ Corner 👀
Scalp LONG only—ride the bullish waves! 🌊
Got big capital? Dive in now. Smaller stack? Join the swing traders for the full heist.
Use Trailing Stop-Loss to lock in gains and protect your loot. 💰
📡 Market Pulse: Why DOGEUSDT?
The DOGEUSDT market is in a neutral trend with a high probability of bullish momentum. Here’s the intel driving our heist:
Fundamentals: Dive into macroeconomic data, COT reports, geopolitical events, and news sentiment.
Intermarket Analysis: Watch correlated assets for clues.
Seasonal & Positioning Trends: Align with the market’s rhythm.
Future Targets: Check the Overall Score for a full breakdown! 👉🌏🔗
⚠️ Trading Alert: News & Risk Management 📰
News releases can flip the market like a switch! Protect your positions:
Avoid new trades during high-impact news.
Use Trailing SL to secure profits and minimize losses.
Stay sharp—volatility is our friend, but only if we’re prepared!
💪 Join the Heist & Boost the Plan!
Hit the Boost Button to supercharge our Thief Trading Style and make this heist legendary! 🚀 Every boost strengthens our crew, helping us plunder profits daily with ease. 💥 Let’s dominate the DOGEUSDT market together! 🤝
Stay tuned for the next heist plan! 🐱👤 Keep your charts locked, your alerts set, and your trading spirit wild. See you in the profits, bandits! 🤑🎉
#ThiefTrading #DOGEUSD #CryptoHeist #TradingView #MakeMoney

DOGE to new ATHDOGE has been sleeping since the ATH in 2024. But has now woken up. The interest in this coin of freedom between people has again started to spike. On 21D chart there's a giant Cup & Holder with the promise of taken this coin to a minimum of $0.72 !

Is It "GO" Time for $DOGE Dominance to Flippen BTC?Been talking about this for a while.
Early, but not wrong.
Remember: nothing ever moves in a straight line except c0caine- and even then, only if you're a degenerate.
But enough about my theory- this market is breaking a lot of old "ObViOuS" patterns, because they never repeat perfectly.
What do YOU think is going on here?
Is it actually GO time?

DOGE - 1$ NextDoge is getting ready for the next wave. Based on the previous trend we are looking at the next target around 1.1$.
Doge can break 1$ easily based on the current trend and overall interested in DOGE.
Entry: 0.1766
TP1: 0.22086
TP2: 0.30439
TP3: 0.40104
TP4: 0.53436
TP5: 1.13587
Stop Loss: 0.1143
Follow us for more such ideas.
Cheers
GreenCrypto

DOGEUSD Started its final rally and can hit $1.300Dogecoin (DOGEUSD) just broke above its 1W MA50 (blue trend-line) again for the first time since March 24 2025 and is doing so after a clear rebound on its 1W MA100 (green trend-line). This is a technical bottom formation, that resembles the one on September 11 2017, right before that Cycle's final rally was initiated.
The 1W RSI has already broken above its MA trend-line (yellow) and every time that took place since October 16 2023, DOGE posted a strong rally. As you can see, the similarities between the two fractals are remarkable, both unfolding a structured bullish pattern on similar stages, with a 1W MA50/100 Bullish Cross leading to the massive Bull Flag (green) that bottomed on the 1W MA100 and initiating the parabolic rally.
In 2017 it topped on the 1.786 Fibonacci extension, so if it continues to replicate that fractal, we expect this run to hit $1.300 by the end of the year and make the Cycle's Top.
-------------------------------------------------------------------------------
** Please LIKE 👍, FOLLOW ✅, SHARE 🙌 and COMMENT ✍ if you enjoy this idea! Also share your ideas and charts in the comments section below! This is best way to keep it relevant, support us, keep the content here free and allow the idea to reach as many people as possible. **
-------------------------------------------------------------------------------
💸💸💸💸💸💸
👇 👇 👇 👇 👇 👇

DOGE/USDT: Descending Triangle Breakout with Bullish PotentialA weekly chart of DOGE/USDT on Binance, spanning from 2017 to early 2025 shows a clear descending triangle pattern that has formed over several years, characterized by a flat support base around $0.0030-$0.0040 (2017-2020) and a downward-sloping resistance trendline connecting lower highs over time. The price has recently broken out of this pattern and is showing signs of bullish momentum.
Descending Triangle Pattern:
- A descending triangle is typically a continuation pattern, but in this case, it acted as a reversal pattern after a prolonged downtrend. The flat base of the triangle (around $0.0030-$0.0040) served as strong support, with the price bouncing off this level multiple times between 2017 and 2020.
- The upper trendline of the triangle, which slopes downward, connected key lower highs at approximately $0.069 (2018), $0.018 (2019), and $0.010 (2020). This trendline was tested multiple times, showing consistent selling pressure at these levels.
- In early 2021, the price broke above this trendline with a strong bullish candle, accompanied by a significant spike in volume (visible at the bottom of the chart). This breakout confirmed the end of the consolidation phase and the start of a new uptrend.
Post-Breakout Price Action:
- After the breakout, DOGE/USDT surged dramatically, reaching a high of $0.737 in 2021, driven by market hype and increased adoption. However, the price then entered a corrective phase, pulling back to retest the breakout level around $0.169 in 2023. This retest is a common occurrence after a breakout, as it confirms the previous resistance as new support.
- The price has since consolidated in a range between $0.130 and $0.237, forming a rectangular consolidation zone (highlighted in yellow on the chart). This range indicates indecision in the market, with buyers and sellers battling for control.
- Recently, the price has approached the upper boundary of this range at $0.237, and the current candle (as of early 2025) shows a push towards this resistance. A breakout above this level would signal the continuation of the bullish trend.
Key Levels to Watch:
- Support Zone ($0.130-$0.150): This area has acted as a strong support during the consolidation phase. If the price fails to break above $0.237, it may pull back to this zone for another retest. A break below $0.130 would invalidate the bullish setup and could lead to a deeper correction towards $0.069.
- Resistance Zone ($0.237): This is the immediate hurdle for DOGE/USDT. A confirmed break above this level, especially with strong volume, would confirm the continuation of the uptrend.
- Next Resistance ($0.400-$0.450): The measured move of the descending triangle can be calculated by taking the height of the triangle (from the base at $0.003 to the highest point at $0.069, roughly $0.066) and adding it to the breakout point (around $0.169). This gives a target range of $0.235-$0.400. However, considering the momentum and historical price action, the price could extend towards $0.450 if bullish sentiment persists.
Volume Analysis:
- Volume spiked significantly during the breakout in 2021, confirming the strength of the move. However, during the consolidation phase (2023-2025), volume has been relatively low, indicating a lack of strong directional momentum.
- For the breakout above $0.237 to be valid, we would ideally want to see an increase in volume, signaling renewed buying interest. Without this, the breakout could be a false move, leading to a rejection and pullback.
Market Context and Risks:
- DOGE/USDT is known for its volatility, often driven by market sentiment, social media hype, and news events. While the technical setup looks bullish, external factors could impact the price. For example, a broader market downturn or negative news could lead to a rejection at $0.237.
- The weekly timeframe suggests a long-term perspective, so traders should be prepared for potential short-term volatility. Using a stop loss below $0.169 helps manage risk in case the setup fails.

Doge H4 | Overlap support at 38.2% Fibonacci retracementDoge (DOGE/USD) is falling towards an overlap support and could potentially bounce off this level to climb higher.
Buy entry is at 0.1667 which is an overlap support that aligns close to the 38.2% Fibonacci retracement.
Stop loss is at 0.1460 which is a level that lies underneath an overlap support and the 61.8% Fibonacci retracement.
Take profit is at 0.2028 which is a swing-high resistance.
High Risk Investment Warning
Trading Forex/CFDs on margin carries a high level of risk and may not be suitable for all investors. Leverage can work against you.
Stratos Markets Limited (tradu.com):
CFDs are complex instruments and come with a high risk of losing money rapidly due to leverage. 63% of retail investor accounts lose money when trading CFDs with this provider. You should consider whether you understand how CFDs work and whether you can afford to take the high risk of losing your money.
Stratos Europe Ltd (tradu.com):
CFDs are complex instruments and come with a high risk of losing money rapidly due to leverage. 63% of retail investor accounts lose money when trading CFDs with this provider. You should consider whether you understand how CFDs work and whether you can afford to take the high risk of losing your money.
Stratos Global LLC (tradu.com):
Losses can exceed deposits.
Please be advised that the information presented on TradingView is provided to Tradu (‘Company’, ‘we’) by a third-party provider (‘TFA Global Pte Ltd’). Please be reminded that you are solely responsible for the trading decisions on your account. There is a very high degree of risk involved in trading. Any information and/or content is intended entirely for research, educational and informational purposes only and does not constitute investment or consultation advice or investment strategy. The information is not tailored to the investment needs of any specific person and therefore does not involve a consideration of any of the investment objectives, financial situation or needs of any viewer that may receive it. Kindly also note that past performance is not a reliable indicator of future results. Actual results may differ materially from those anticipated in forward-looking or past performance statements. We assume no liability as to the accuracy or completeness of any of the information and/or content provided herein and the Company cannot be held responsible for any omission, mistake nor for any loss or damage including without limitation to any loss of profit which may arise from reliance on any information supplied by TFA Global Pte Ltd.
The speaker(s) is neither an employee, agent nor representative of Tradu and is therefore acting independently. The opinions given are their own, constitute general market commentary, and do not constitute the opinion or advice of Tradu or any form of personal or investment advice. Tradu neither endorses nor guarantees offerings of third-party speakers, nor is Tradu responsible for the content, veracity or opinions of third-party speakers, presenters or participants.

DOGECOIN BUY LIMIT...Hello friends✌
Given the good price growth and the arrival of buyers, now that the price is correcting, it is the best time to buy.
🙏If you like it, support it with a ✔like✔ and ✔comment✔.
*Trade safely with us*

Doge H4 | Potential bullish bounceDoge (DOGE/USD) is falling towards a pullback support and could potentially bounce off this level to climb higher.
Buy entry is at 0.1667 which is a pullback support that aligns close to the 38.2% Fibonacci retracement.
Stop loss is at 0.1460 which is a level that lies underneath a multi-swing-low support and the 61.8% Fibonacci retracement.
Take profit is at 0.2028 which is a swing-high resistance.
High Risk Investment Warning
Trading Forex/CFDs on margin carries a high level of risk and may not be suitable for all investors. Leverage can work against you.
Stratos Markets Limited (tradu.com):
CFDs are complex instruments and come with a high risk of losing money rapidly due to leverage. 63% of retail investor accounts lose money when trading CFDs with this provider. You should consider whether you understand how CFDs work and whether you can afford to take the high risk of losing your money.
Stratos Europe Ltd (tradu.com):
CFDs are complex instruments and come with a high risk of losing money rapidly due to leverage. 63% of retail investor accounts lose money when trading CFDs with this provider. You should consider whether you understand how CFDs work and whether you can afford to take the high risk of losing your money.
Stratos Global LLC (tradu.com):
Losses can exceed deposits.
Please be advised that the information presented on TradingView is provided to Tradu (‘Company’, ‘we’) by a third-party provider (‘TFA Global Pte Ltd’). Please be reminded that you are solely responsible for the trading decisions on your account. There is a very high degree of risk involved in trading. Any information and/or content is intended entirely for research, educational and informational purposes only and does not constitute investment or consultation advice or investment strategy. The information is not tailored to the investment needs of any specific person and therefore does not involve a consideration of any of the investment objectives, financial situation or needs of any viewer that may receive it. Kindly also note that past performance is not a reliable indicator of future results. Actual results may differ materially from those anticipated in forward-looking or past performance statements. We assume no liability as to the accuracy or completeness of any of the information and/or content provided herein and the Company cannot be held responsible for any omission, mistake nor for any loss or damage including without limitation to any loss of profit which may arise from reliance on any information supplied by TFA Global Pte Ltd.
The speaker(s) is neither an employee, agent nor representative of Tradu and is therefore acting independently. The opinions given are their own, constitute general market commentary, and do not constitute the opinion or advice of Tradu or any form of personal or investment advice. Tradu neither endorses nor guarantees offerings of third-party speakers, nor is Tradu responsible for the content, veracity or opinions of third-party speakers, presenters or participants.
