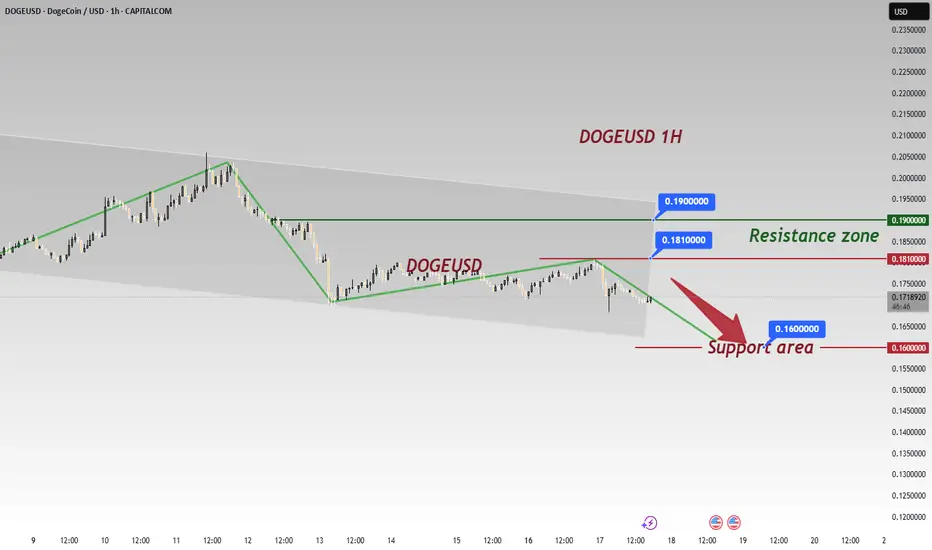
DOGEUSD 1H Technical AnalysisTrend & Key Levels 🎯
DOGEUSD is in a downtrend after breaking the short - term uptrend line.
Resistance: 0.1810 - 0.1900 zone (previous suppression, 👀 watch for pullback risks if price rebounds here).
Support: 0.1600 (critical level; a break could deepen declines 💣).
Signals 📡
Trend Break: The broken uptrend line confirms bearish control 🐻; failing to reclaim it on a rebound keeps the downtrend.
Price Action: Dominant bearish candles (with implied heavy selling 💰💨) show strong downside momentum.
Range Play: Price is testing 0.1600 support. A hold may spark a bounce 🚀; a break opens further downside (check larger timeframes for prior lows 🔍).
⚡️⚡️⚡️ BTCUSD ⚡️⚡️⚡️
🚀 Sell@ 0.17500 - 0.17000
🚀 TP 0.16500 - 0.16000
Accurate signals are updated every day 📈 If you encounter any problems during trading, these signals can serve as your reliable guide 🧭 Feel free to refer to them! I sincerely hope they'll be of great help to you 🌟 👇
Dogeusdshort
DOGE/USD – Supply Zone Rejection in Play! Is a Pullback ImminentDogecoin just tapped into a strong supply zone between $0.16624 – $0.16800 and showed immediate signs of rejection. Price action is slowing, and early sellers are stepping in—this could be the beginning of a short-term pullback.
---
Key Levels to Watch:
Resistance (Supply): $0.16624 – $0.16800
Support 1: $0.16227
Support 2: $0.15740
Demand Zone: $0.15600–$0.15750
---
Bearish Setup Alert:
Clean test of supply with rejection candle
Short-term bearish structure forming
Volume fading near the top—indicates buyer exhaustion
Next potential drop targets are $0.162 and $0.157
---
Scalper’s Setup:
Short Entry: Near $0.16650–$0.16750
TP1: $0.162
TP2: $0.15750
SL: Above $0.16850
Risk/Reward: 1:2+
---
What's Your Take?
Do you expect a bounce from support or deeper retracement to the demand zone?
Drop your thoughts below & like if you caught this move early!
#DOGE #Dogecoin #CryptoAnalysis #LuxAlgo #TechnicalAnalysis #Scalping #DayTrading #SupplyAndDemand #TradingView


Dogecoin analysis* Dogecoin in 1H time frame forms a Symmetrical triangle.
* Symmetrical triangle occurs when the price consolidates between two trend-lines (ascending trend-line and descending trend-line) sloping towards each other, the price is forced to break either side of the pattern.
* If Dogecoin breaks either side of the pattern we can see a healthy move.


DOGEUSD Short So much support and resistance are there. Risk reward is high in this position. Try short position

Dogeusd analysis= 1D + 4H inside a strong bullish price channel.
1H = the top of an uptrend
_________
Expectations:
First: Buy (low probability)
Exceeding 0.66570 goes to 0.75812
Second: Selling (strong possibility)
A break of 0.57303 goes to 0.53053--0.48087--0.40732
__________
Personal opinion sale
