DOGEUSD Is that a textbook Livermore Cylinder to $1.5 ??Doge (DOGEUSD) has been trading within a Bullish Megaphone for the majority of its Bull Cycle since the October 09 2023 Low. We may technically claim that this has been so far one massive Accumulation Phase, along with the rest of the altcoin market.
A pattern that draws strong comparisons with that Megaphone has been 'Livermore's Accumulation Cylinder'. Jesse Livermore, an American stock trader, came with a revolutionary trading pattern a century ago, whose principles often apply perfectly to today's financial assets.
This is what we do on today's Dogecoin analysis, we apply this Accumulation Cyclinder on Doge's Bullish Megaphone. Even though not a perfect fit obviously, the main characteristics apply, with clearly visible Bullish and Bearish Legs.
Based on this model, the market is right now starting the aggressive break-out phase above the Cylinder. Technically the Accumulation is over and the price may pursue levels 8 and 9, which give price Targets of $1.50 and $12.00 respectively.
Now, even though $12.00 falls well after (6 months or so) the expected duration of the current Bull Cycle, $1.50 is well within its limits (October - November 2025) and exactly double the price of the previous Cycle High. This makes it a very attractive Top candidate.
So do you think Doge is inside a Livermore Cylinder that is about to break out parabolically?
-------------------------------------------------------------------------------
** Please LIKE 👍, FOLLOW ✅, SHARE 🙌 and COMMENT ✍ if you enjoy this idea! Also share your ideas and charts in the comments section below! This is best way to keep it relevant, support us, keep the content here free and allow the idea to reach as many people as possible. **
-------------------------------------------------------------------------------
💸💸💸💸💸💸
👇 👇 👇 👇 👇 👇
Dogeusdsignals

Dogecoin - It is all totally expected!🐶Dogecoin ( CRYPTO:DOGEUSD ) will break out soon:
🔎Analysis summary:
Just this month, Dogecoin perfectly retested a significant confluence of support and is starting the expected rejection. With bullish momentum picking up, there is a very high chance that Dogecoin will break the all time high in the near future.
📝Levels to watch:
$0.5
🙏🏻#LONGTERMVISION
SwingTraderPhil

DOGE/USDT Breakout Theft Plan| Smart Entry + Exit| Bullish Bias🐶💰 DOGE/USDT Master Heist Plan – The Bullish Breakout Robbery! 💸🔓
(Thief Trading Style – Steal Profits, Not Dreams)
🌟Hello, Hola, Ola, Bonjour, Hallo, Marhaba!🌟
To all the fearless Market Movers & Silent Operators out there – welcome to another strategic DOGE raid guided by technical precision and macro-level insight! 📈🧠
🔐 The Game Plan – Let’s Break the Bank!
This chart outlines our long-entry mission for DOGE/USDT, based on a unique Thief Trading Style strategy. The market currently shows bullish momentum, setting the stage for an upside breakout—but not without traps! Stay sharp.
💥 Key Concepts at Play:
Pullback Zones = Entry Points (Mark the lows, grab the loot)
ATR Line Zone = High-Risk Area (Time to plan your exit)
Reversal & Consolidation Zones = Watch for fakes & traps
News Events = Potential market detonators – keep your stop-loss close
📍Entry Point – "The Vault’s Open!"
💰 Plan A: Instant execution for those already prepped.
📉 Plan B: Place Buy Limit Orders near recent 15–30 min swing lows for a stealthier entry during pullbacks.
🚨Stop-Loss Setup – Safety First, Always
📍 Recommended SL: Near the 2H swing low (around 0.15500)
🛡️ Adjust based on your personal risk, account size, and trade volume. Thieves plan smart—never go in blind.
🎯Target – Clean the House and Vanish
🎯 Primary Target: 0.18500
⚠️ Exit early if market conditions shift. The first rule of the game? Don’t get greedy.
⚡Scalpers’ Mode – Hit & Run
Only trade LONG setups. Whether you’re a heavy hitter or playing it safe, stick with the bulls. Use trailing SL to protect the bag.
📊Why This Heist Works – Under the Hood
The DOGE/USDT setup is driven by:
✅ Bullish sentiment
✅ Fundamental trends
✅ Macro drivers
✅ On-chain activity & intermarket signals
✅ COT Reports & future momentum indicators
(For full breakdown, check linkkied data 👉🔗🔍)
📡News & Risk Management Reminder
🚫 Avoid opening fresh trades during high-volatility news events.
📉 Always trail your stop to secure profits during live positions.
Adapt fast – the market changes in a blink.
❤️Support The Plan
💥 Smash the Boost button to help spread the Thief Trading Style across the platform! Let’s make smart money together, one chart at a time. Every like, comment, and follow powers the next move. 💪💵🚀
🔔 More Heist Plans Coming Soon – Stay connected, stay dangerous... and stay profitable.
🐱👤Until then – Trade Smart. Trade Thief. Make Your Mark. 💸

DOGE started its final rally. Don't miss it.Dogecoin (DOGEUSD) has been trading on a Bullish Megaphone pattern within a Channel Up. The recent (June 16 2025) rebound on the 1W MA200 (orange trend-line) is a Higher Low at the bottom of both patterns.
With the 1W RSI also rebounding on its long-term Support Zone, Doge is most likely at the start of the new Bullish Leg, which could be the final rally that will shape this Cycle's Top.
As the previous two Bullish Legs peaked on the 3.618 Fibonacci extension of the last decline, Doge is technically targeting $1.2500. If you (naturally) wish to pursue a Target within the Channel Up though, you can settle for $0.800.
-------------------------------------------------------------------------------
** Please LIKE 👍, FOLLOW ✅, SHARE 🙌 and COMMENT ✍ if you enjoy this idea! Also share your ideas and charts in the comments section below! This is best way to keep it relevant, support us, keep the content here free and allow the idea to reach as many people as possible. **
-------------------------------------------------------------------------------
💸💸💸💸💸💸
👇 👇 👇 👇 👇 👇

Doge Buy / Long SetupDoge has some Bullish Momentum, Invalidation if 4hrs closes below the mentioned point, then close on entry, otherwise wick doesn't matter. If tp achieved first then Cancel the trade.

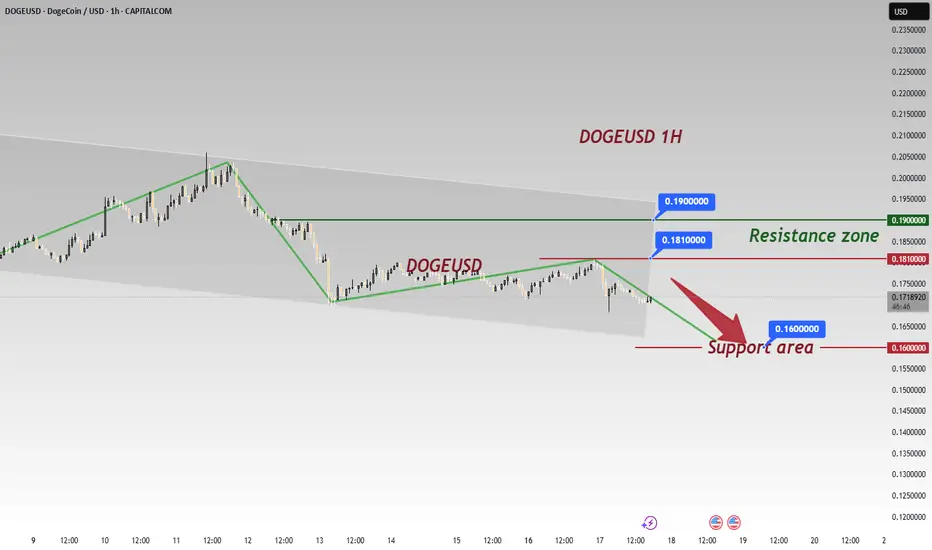
DOGEUSD 1H Technical AnalysisTrend & Key Levels 🎯
DOGEUSD is in a downtrend after breaking the short - term uptrend line.
Resistance: 0.1810 - 0.1900 zone (previous suppression, 👀 watch for pullback risks if price rebounds here).
Support: 0.1600 (critical level; a break could deepen declines 💣).
Signals 📡
Trend Break: The broken uptrend line confirms bearish control 🐻; failing to reclaim it on a rebound keeps the downtrend.
Price Action: Dominant bearish candles (with implied heavy selling 💰💨) show strong downside momentum.
Range Play: Price is testing 0.1600 support. A hold may spark a bounce 🚀; a break opens further downside (check larger timeframes for prior lows 🔍).
⚡️⚡️⚡️ BTCUSD ⚡️⚡️⚡️
🚀 Sell@ 0.17500 - 0.17000
🚀 TP 0.16500 - 0.16000
Accurate signals are updated every day 📈 If you encounter any problems during trading, these signals can serve as your reliable guide 🧭 Feel free to refer to them! I sincerely hope they'll be of great help to you 🌟 👇
DOGEUSD Fibonacci Channel shows minimum $1 Target end of year.Dogecoin (DOGEUSD) has held perfectly its 1W MA200 (orange trend-line) on the April 07 bottom, rebounded and is now consolidating around its 1W MA50 (blue trend-line). This consolidation shouldn't last for too long as based on the previous Cycles, this 1W MA200 test was the new bottom that should kick-start the final year rally.
As you can see, DOGE's historic pattern since its first trading day has been a Channel Up, which with the added element of the Fibonacci lines, only broke during the 2021 Top formation on its 1.5 Fib extension.
A key characteristic of the final year of each Bull Cycle is that after a 1W Golden Cross is formed, the price has always first hit the Mayer Multiple Bands (MMB) 2SD above (thin orange trend-line) and shortly after the MMB 3SD above (thin red trend-line).
So far the current Cycle has only hit the MMB 2SD because as the pace of this Cycle naturally slowed down (the higher the cap the slower the pace), it didn't go straight for a MMB 3SD test.
Despite the delay, the Fibonacci Channel along with the MMB give, in our opinion, two Target levels for this final year of the Cycle, a fair one and an optimistic. The fair one is at $1.00, which would make a perfect test of both the MMB 3SD and the 1.0 Fib ext at the top of the Channel Up. The optimistic is at $3.5 (potentially even higher), which would be exactly on the 1.618 horizontal Fibonacci extension (still below the 1.5 Channel Fib), which was the January 2018 Cycle Top and of course was greatly exceeded during the May 2021 Cycle Top.
-------------------------------------------------------------------------------
** Please LIKE 👍, FOLLOW ✅, SHARE 🙌 and COMMENT ✍ if you enjoy this idea! Also share your ideas and charts in the comments section below! This is best way to keep it relevant, support us, keep the content here free and allow the idea to reach as many people as possible. **
-------------------------------------------------------------------------------
💸💸💸💸💸💸
👇 👇 👇 👇 👇 👇

DOGEUSD Massive Bull Flag targets $0.40 like late 2024!Dogecoin (DOGEUSD) is posting a Bull Flag pattern on the 4H time-frame, being supported by the 4H MA50 (blue trend-line).
A similar Bull Flag was formed at the start of its previous major rally in October 2024, which made the price jump to the 2.0 Fibonacci extension, in as much time as it took for the price to reach the Bull Flag's start from the bottom.
As a result, we expect DOGE's next short-term Target to be $0.40.
-------------------------------------------------------------------------------
** Please LIKE 👍, FOLLOW ✅, SHARE 🙌 and COMMENT ✍ if you enjoy this idea! Also share your ideas and charts in the comments section below! This is best way to keep it relevant, support us, keep the content here free and allow the idea to reach as many people as possible. **
-------------------------------------------------------------------------------
💸💸💸💸💸💸
👇 👇 👇 👇 👇 👇

DOGEUSD Started its final rally and can hit $1.300Dogecoin (DOGEUSD) just broke above its 1W MA50 (blue trend-line) again for the first time since March 24 2025 and is doing so after a clear rebound on its 1W MA100 (green trend-line). This is a technical bottom formation, that resembles the one on September 11 2017, right before that Cycle's final rally was initiated.
The 1W RSI has already broken above its MA trend-line (yellow) and every time that took place since October 16 2023, DOGE posted a strong rally. As you can see, the similarities between the two fractals are remarkable, both unfolding a structured bullish pattern on similar stages, with a 1W MA50/100 Bullish Cross leading to the massive Bull Flag (green) that bottomed on the 1W MA100 and initiating the parabolic rally.
In 2017 it topped on the 1.786 Fibonacci extension, so if it continues to replicate that fractal, we expect this run to hit $1.300 by the end of the year and make the Cycle's Top.
-------------------------------------------------------------------------------
** Please LIKE 👍, FOLLOW ✅, SHARE 🙌 and COMMENT ✍ if you enjoy this idea! Also share your ideas and charts in the comments section below! This is best way to keep it relevant, support us, keep the content here free and allow the idea to reach as many people as possible. **
-------------------------------------------------------------------------------
💸💸💸💸💸💸
👇 👇 👇 👇 👇 👇

DOGE The 1D MA50 that starts historic rallies happened.Dogecoin (DOGEUSD) broke and closed 2 days ago above its 1D MA50 (blue trend-line) for the first time in 3 months (since January 18 2025) and basically the start of the Trade War fueled correction. This was achieved after the price hit and rebounded on the 2-year Higher Lows Zone.
This is a major bullish development as every time DOGE closed above its 1D MA50 following a Higher Lows Zone test, it started a major Bullish Leg of the current Bull Cycle. At the same time, the 1D RSI signaled a huge Bullish Divergence on that bottom, consistent with all previous bottoms within that 2 year span.
As for how high this new expected rally can get, we expect at least a test of the 1.5 Fibonacci extension, which is still lower that all rallies before it. Conservative long-term Target at $0.9000.
-------------------------------------------------------------------------------
** Please LIKE 👍, FOLLOW ✅, SHARE 🙌 and COMMENT ✍ if you enjoy this idea! Also share your ideas and charts in the comments section below! This is best way to keep it relevant, support us, keep the content here free and allow the idea to reach as many people as possible. **
-------------------------------------------------------------------------------
💸💸💸💸💸💸
👇 👇 👇 👇 👇 👇

DOGE/USD – Supply Zone Rejection in Play! Is a Pullback ImminentDogecoin just tapped into a strong supply zone between $0.16624 – $0.16800 and showed immediate signs of rejection. Price action is slowing, and early sellers are stepping in—this could be the beginning of a short-term pullback.
---
Key Levels to Watch:
Resistance (Supply): $0.16624 – $0.16800
Support 1: $0.16227
Support 2: $0.15740
Demand Zone: $0.15600–$0.15750
---
Bearish Setup Alert:
Clean test of supply with rejection candle
Short-term bearish structure forming
Volume fading near the top—indicates buyer exhaustion
Next potential drop targets are $0.162 and $0.157
---
Scalper’s Setup:
Short Entry: Near $0.16650–$0.16750
TP1: $0.162
TP2: $0.15750
SL: Above $0.16850
Risk/Reward: 1:2+
---
What's Your Take?
Do you expect a bounce from support or deeper retracement to the demand zone?
Drop your thoughts below & like if you caught this move early!
#DOGE #Dogecoin #CryptoAnalysis #LuxAlgo #TechnicalAnalysis #Scalping #DayTrading #SupplyAndDemand #TradingView

DOGEUSD making a huge bullish break-out. Eyes 0.800.Dogecoin (DOGEUSD) broke today above the Lower Highs trend-line that started 2 months ago (on the January 18 High).
The natural Resistance remains of course technically the 1D MA50 (blue trend-line) but with the 1D RSI already trending upwards and the price rebounding from the recent low at the bottom of the 1-year Channel Up, we can already claim that the new Bullish Leg has already started.
If it makes just a simple repeat of the previous Bullish Leg (which during Bull Cycles every rally is generally more aggressive than the previous), it can top the Channel Up and make a Higher High at $0.800.
-------------------------------------------------------------------------------
** Please LIKE 👍, FOLLOW ✅, SHARE 🙌 and COMMENT ✍ if you enjoy this idea! Also share your ideas and charts in the comments section below! This is best way to keep it relevant, support us, keep the content here free and allow the idea to reach as many people as possible. **
-------------------------------------------------------------------------------
💸💸💸💸💸💸
👇 👇 👇 👇 👇 👇

DOGEUSD Fibonacci Channel 'guarantees' rally to at least $1.Dogecoin (DOGEUSD) has held perfectly its 1W MA50 two weeks ago, rebounded and is now consolidating. This consolidation shouldn't last for too long as based on the previous Cycles, this 1W MA50 test was the new bottom the should lead to the final year (2025) rally.
As you can see, DOGE's historic pattern since its first trading day has been a Channel Up, which with the added element of the Fibonacci lines, only broke during the 2021 Top formation on its 1.5 Fib extension.
A key characteristic of the final year of each Bull Cycle is that after a 1W Golden Cross is formed, the price has always first hit the Mayer Multiple Bands (MMB) 2SD above (thin orange trend-line) and shortly after the MMB 3SD above (thin red trend-line).
So far the current Cycle had hit the MMB 2SD on its December High and based on the pace with which this Cycle is unfolding (the higher the cap the slower the pace), it is unlikely to see a MMB 3SD test shortly.
However the Fibonacci Channel along with the MMB gives in our opinion two Target levels for this final year of the Cycle, a fair one and an optimistic. The fair one is at $1.00, which would make a perfect test of both the MMB 3SD and the 1.0 Fib ext at the top of the Channel Up. The optimistic is at $3.5 (potentially even higher), which would be exactly on the 1.618 horizontal Fibonacci extension (still below the 1.5 Channel Fib), which was the January 2018 Cycle Top and of course was greatly exceeded during the May 2021 Cycle Top.
-------------------------------------------------------------------------------
** Please LIKE 👍, FOLLOW ✅, SHARE 🙌 and COMMENT ✍ if you enjoy this idea! Also share your ideas and charts in the comments section below! This is best way to keep it relevant, support us, keep the content here free and allow the idea to reach as many people as possible. **
-------------------------------------------------------------------------------
💸💸💸💸💸💸
👇 👇 👇 👇 👇 👇

DOGE/USD "Dogecoin vs US Dollar" Altcoin Market Heist Plan🌟Hi! Hola! Ola! Bonjour! Hallo!🌟
Dear Money Makers & Thieves, 🤑 💰🐱👤
Based on 🔥Thief Trading style technical and fundamental analysis🔥, here is our master plan to heist the DOGE/USD "Dogecoin vs US Dollar" Altcoin market. Please adhere to the strategy I've outlined in the chart, which emphasizes long entry. Our aim is the high-risk Red Zone. Risky level, overbought market, consolidation, trend reversal, trap at the level where traders and bearish robbers are stronger. 🏆💸Be wealthy and safe trade.💪🏆🎉
Entry 📈 : "The heist is on! Wait for the breakout (0.30000) then make your move - Bullish profits await!"
however I advise placing Buy Stop Orders above the breakout MA or Place Buy limit orders within a 15 or 30 minute timeframe. Entry from the most recent or closest low or high level should be in retest.
Stop Loss 🛑:
Thief SL placed at the recent / nearest low level Using the 4H timeframe (0.27000) swing trade basis.
SL is based on your risk of the trade, lot size and how many multiple orders you have to take.
Target 🎯:
1st Target - 0.36500 (or) Escape Before the Target
Final Target - 0.44000 (or) Escape Before the Target
Scalpers, take note 👀 : only scalp on the Long side. If you have a lot of money, you can go straight away; if not, you can join swing traders and carry out the robbery plan. Use trailing SL to safeguard your money 💰.
📰🗞️Fundamental, Macro, COT, Sentimental Outlook:
DOGE/USD "Dogecoin vs US Dollar" Altcoin market is currently experiencing a bullish trend,., driven by several key factors.
🎈 Fundamental Analysis: Bullish
- The fundamental analysis of DOGE/USD suggests a bullish trend.
- This means that the underlying factors that affect the price of Dogecoin, such as its blockchain technology, adoption rate, and community support, are all indicating a potential increase in price.
🎈 Macro Economics: Uncertain
- The macroeconomic outlook for DOGE/USD is uncertain.
- This means that global economic factors, such as inflation rates, interest rates, and geopolitical events, are not clearly indicating a bullish or bearish trend for Dogecoin.
🎈 COT Report: Not Available
- The Commitment of Traders (COT) report is not available for DOGE/USD.
- The COT report provides insights into the positions held by institutional traders, such as hedge funds and banks, and can be a useful tool for analyzing market sentiment.
🎈 Sentimental Market Analysis: Bullish
- The sentimental market analysis of DOGE/USD suggests a bullish trend.
- This means that the overall market sentiment, as indicated by factors such as social media sentiment, online searches, and trader surveys, is positive and indicating a potential increase in price.
🎈 Positioning: Institutional Traders Holding Long Positions
- Institutional traders, such as hedge funds and banks, are holding long positions in DOGE/USD.
- This means that these traders are betting on an increase in the price of Dogecoin and are holding positions that will benefit from a price increase.
🎈Overall Outlook: Bullish in the Short Term
- The overall outlook for DOGE/USD is bullish in the short term.
- This means that, based on the analysis of the above data points, the price of Dogecoin is expected to increase in the short term (next 30 days).
⚠️Trading Alert : News Releases and Position Management 📰 🗞️ 🚫🚏
As a reminder, news releases can have a significant impact on market prices and volatility. To minimize potential losses and protect your running positions,
we recommend the following:
Avoid taking new trades during news releases
Use trailing stop-loss orders to protect your running positions and lock in profits
📌Please note that this is a general analysis and not personalized investment advice. It's essential to consider your own risk tolerance and market analysis before making any investment decisions.
📌Keep in mind that these factors can change rapidly, and it's essential to stay up-to-date with market developments and adjust your analysis accordingly.
💖Supporting our robbery plan will enable us to effortlessly make and steal money 💰💵 Tell your friends, Colleagues and family to follow, like, and share. Boost the strength of our robbery team. Every day in this market make money with ease by using the Thief Trading Style.🏆💪🤝❤️🎉🚀
I'll see you soon with another heist plan, so stay tuned 🤑🐱👤🤗🤩

DOGEUSD Giant Bull Flag or Channel Down rebound?Dogecoin (DOGEUSD) is trading within a 2-month Channel Down, which on the wider scale may be a Bull Flag for this Bull Cycle. Regardless of the time-frame, the price got sold aggressively today and hit its 1D MA200 (orange trend-line) for the first time since October 25 2024.
If that's just a 1D Channel Down, then today's Low is technically a bottom on the pattern's Lower Lows trend-line. The previous one (December 20 2024), rebounded towards almost the 0.786 Fibonacci retracement level.
With an oversold (<30.00) 1D RSI for the first time since August 07 2024 making the buy opportunity even stronger, we expect the new Bullish Leg to target 0.3800 (just below the 0.786 Fib).
-------------------------------------------------------------------------------
** Please LIKE 👍, FOLLOW ✅, SHARE 🙌 and COMMENT ✍ if you enjoy this idea! Also share your ideas and charts in the comments section below! This is best way to keep it relevant, support us, keep the content here free and allow the idea to reach as many people as possible. **
-------------------------------------------------------------------------------
💸💸💸💸💸💸
👇 👇 👇 👇 👇 👇

DOGE about to rally on Double Bottom Bullish Cross signalDogecoin (DOGEUSD) has been trading within a Channel Up pattern since the December 20 2024 bottom. A very distinct buy signal emerges every time the price makes a Double Bottom near the Higher Lows trend-line of the pattern and the 4H MACD forms two Bullish Crosses in a row.
As you can see, this has already happened two times, with the price reaching at least the 2.618 Fibonacci extension for a Higher High and this is the 3rd time within the Channel Up that we see this indicator combo.
As a result, we turn bullish short-term, targeting 0.43250 (Fib 2.618 ext).
-------------------------------------------------------------------------------
** Please LIKE 👍, FOLLOW ✅, SHARE 🙌 and COMMENT ✍ if you enjoy this idea! Also share your ideas and charts in the comments section below! This is best way to keep it relevant, support us, keep the content here free and allow the idea to reach as many people as possible. **
-------------------------------------------------------------------------------
💸💸💸💸💸💸
👇 👇 👇 👇 👇 👇

DOGEUSD preparing a rally to $1.60Dogecoin (DOGEUSD) is trading on its 1D MA50 (blue trend-line) as despite yesterday's attempted break-out, the pull-back brought the price down around this key trend-line again.
The key for buyers is now to turn this level into a Support and hold it, as this is what took place during the September - November 2024 rally. As you can see, once the price broke above the 1D MA50 and re-tested as Support, it sustained a 2-month rally, which reached the 3.0 Fibonacci extension from its bottom point (August 05 2024).
We can clearly see how similar the two fractals are, both started with a correction (red Rectangle) and then after the bottom, a Channel Down (also evident on their 1D RSI sequences) paved the way for the rally.
As a result, if DOGE tests the 1D MA50 again and holds it this time, we will have a confirmed buy signal to target $1.600 (Fibonacci 3.0 extension).
-------------------------------------------------------------------------------
** Please LIKE 👍, FOLLOW ✅, SHARE 🙌 and COMMENT ✍ if you enjoy this idea! Also share your ideas and charts in the comments section below! This is best way to keep it relevant, support us, keep the content here free and allow the idea to reach as many people as possible. **
-------------------------------------------------------------------------------
💸💸💸💸💸💸
👇 👇 👇 👇 👇 👇

DOGEUSDT 1DDOGE ~ 1D
#DOGE Buy gradually inside this bullish pattern,. it is only a matter of time that this resistance line is successfully broken. minimum target 15%++

DOGEUSD Don't let this consolidation discourage you.Dogecoin (DOGEUSD) has been trading sideways for the past 10 days, ever since the December 20 Low, following the 1D MA50 (blue trend-line) bearish break-out from the December 08 High. That was a -45% decline and naturally the current inability to reclaim those levels has many investors worried.
Technically however, this is nothing more than a standard Accumulation Phase, where investors tend to take their time and buy DOGE below the 1D MA50 following a rally's correction. During this Bull Cycle, we have already seen two such phases and the one most common to the current one is the one exactly one year ago following the December 10 2023 High.
As you can see both of those Highs were formed after a 1D Golden Cross. The January - February 2024 Accumulation Phase took place also after the 1D RSI bottomed on the 34.00 level. After this 2-month consolidation, the price started the Parabolic Rally sequence that peaked on the 3.0 Fibonacci extension.
If the pattern continues to be repeated, we are looking at a $1.500 Target at least by March - April 2025.
-------------------------------------------------------------------------------
** Please LIKE 👍, FOLLOW ✅, SHARE 🙌 and COMMENT ✍ if you enjoy this idea! Also share your ideas and charts in the comments section below! This is best way to keep it relevant, support us, keep the content here free and allow the idea to reach as many people as possible. **
-------------------------------------------------------------------------------
💸💸💸💸💸💸
👇 👇 👇 👇 👇 👇

DOGEUSD Its Parabolic Growth Channel targets minimum $3.500.Dogecoin (DOGEUSD) is having an excellent bullish run since our last buy signal (October 17, see chart below), hitting all targets in the process:
As the price broke above Resistance 2 as well, we now zoom out to the long-term charts again (1W time-frame) where Doge's historic trend is more clearly displayed. The underlying pattern that it may have gone unnoticed is a Parabolic Channel, which we call Doge's Parabolic Growth Channel (PGC).
This Channel encompasses all of Doge's Cycles and only broke once (to the upside) peaking during last Cycle's mania (April 2021). Furthermore, this week the 1W MA50 (blue trend-line) will complete a cross above the 1W MA200 (orange trend-line), forming the 1W Golden Cross, technically a very bullish pattern.
The last time this was formed was on the week of December 28 2020, right when the Bull Cycle's Parabolic Rally (green Rectangle) started. That reached the 1.618 Fibonacci extension and as mentioned rose even further, breaking above the PGC. The 1.618 Fib is of high importance as this is where the January 01 2018 High of the first Cycle was priced.
At the same time, the 1W RSI is already on a Bullish Cross since the week of October 07 2024, which is exactly what happened again during the previous two Cycles, where it preceded the Golden Cross of the price.
As a result, we believe that Doge has started its Parabolic Rally, the final and most aggressive part of the Bull Cycle, and based on the previous 1.618 Fib peaks, we are expecting at least a $3.500 High.
-------------------------------------------------------------------------------
** Please LIKE 👍, FOLLOW ✅, SHARE 🙌 and COMMENT ✍ if you enjoy this idea! Also share your ideas and charts in the comments section below! This is best way to keep it relevant, support us, keep the content here free and allow the idea to reach as many people as possible. **
-------------------------------------------------------------------------------
💸💸💸💸💸💸
👇 👇 👇 👇 👇 👇

DOGEUSD Hit its 1DMA200. Rejection or breakout? Pick your poisonDogecoin (DOGEUSD) hit yesterday its 1D MA200 (orange trend-line) for the first time since July 29. A little before that date on the last High (July 21), the Lower Highs trend-line started, which is currently exactly on the 1D MA200.
As a result today's pull-back is so far a double level rejection (1D MA200 and Lower Highs trend-line). As long as it stays intact, there are more probabilities to pull-back towards the 1D MA50 (blue trend-line) again, which held twice this month already (closed all candles above it). In that case, our Target is 0.11000.
If on the other hand the 1D MA200 breaks first, we will accept the loss on the short (tight SL anyway) and buy the break-out targeting 0.14380 (Resistance 1). The 1D MACD formed a Bullish Cross on Monday, which favors the bullish break-out.
-------------------------------------------------------------------------------
** Please LIKE 👍, FOLLOW ✅, SHARE 🙌 and COMMENT ✍ if you enjoy this idea! Also share your ideas and charts in the comments section below! This is best way to keep it relevant, support us, keep the content here free and allow the idea to reach as many people as possible. **
-------------------------------------------------------------------------------
💸💸💸💸💸💸
👇 👇 👇 👇 👇 👇

DOGEUSD entering its Parabolic Rally phase. Can it hit $2.00?More than a year ago (July 24 2023, see chart below), we published our long-term expectations and pattern for Dogecoin's (DOGEUSD) Bull Cycle:
As you can see, it filled our projection quite effectively as it extended the Accumulation Phase (blue). That was a phase which, as you can see, was present during both of its previous Cycles and after a 1W MA50/100 Bullish Cross and a subsequent hold of the 1W MA100 (green trend-line), it came out of a (dotted) Channel Down/ Bull Flag and entered its Parabolic Rally phase (green).
As far as timing of the Cycle Top is concerned, we have a very consistent pattern which suggests that it is priced just after the 3.0 Fibonacci Time extension from the bottom of the Bear Cycle. That was accurate for both of the January 01 2018 and April 26 2021 Cycle Tops. As a result, the Top of the current Cycle should be expected a little after August 04 2025, assuming the true bottom of the last Bear Cycle was on the week of October 03 2022 (just before the FTX crash).
But what about the actual Top in price terms, you might be wondering? Well the first two Cycle Highs (January 20 2014 and January 01 2018) were priced just below the 0.786 Fibonacci Channel level. The next one (April 26 2021) was priced higher on the 1.0 Fib on a technical overextension as it was the Cycle where Dogecoin experienced its strongest adoption and awareness.
It would be difficult to repeat this feat this time, unless some news/ fundamentals introduce new uses/ adoption for Doge and the market reacts with very aggressive capital inflows. In this new overextension case, we may see $6.00.
But our proper Target for this Cycle always was and remains $2.00, which falls marginally below the 0.786 Fib, just like the Tops of the first two Cycles.
-------------------------------------------------------------------------------
** Please LIKE 👍, FOLLOW ✅, SHARE 🙌 and COMMENT ✍ if you enjoy this idea! Also share your ideas and charts in the comments section below! This is best way to keep it relevant, support us, keep the content here free and allow the idea to reach as many people as possible. **
-------------------------------------------------------------------------------
💸💸💸💸💸💸
👇 👇 👇 👇 👇 👇

DOGEUSD No time left! If you want to BUY do it NOW!Dogecoin (DOGEUSD) has been filling out our July 24 2023 call (see chart below) with impressive precision so far as after 6 months of sideways trading within the Cycle's Accumulation Phase, it posted the Bull Flag that typically precedes the parabolic rally:
Technically this implies that there is little (if any) time left before DOGE starts its aggressive rally phase where traditionally it doesn't offer many opportunities to catch it. The Sine Waves that accurately grasp the Cycle's Top, show that the coin will be entering its Peak Phase at the start of next year and may last until May 2025.
In any event, back to today, with the 1W MA100 (green trend-line) holding this month, the Bull Flag is about to break upwards and our Target remains the 0.786 Fibonacci level of the Fib Channel at 2.000. An overextension Target for those who wish to leave some coins running, can be 6.000, right at the top of the pattern.
-------------------------------------------------------------------------------
** Please LIKE 👍, FOLLOW ✅, SHARE 🙌 and COMMENT ✍ if you enjoy this idea! Also share your ideas and charts in the comments section below! This is best way to keep it relevant, support us, keep the content here free and allow the idea to reach as many people as possible. **
-------------------------------------------------------------------------------
💸💸💸💸💸💸
👇 👇 👇 👇 👇 👇
