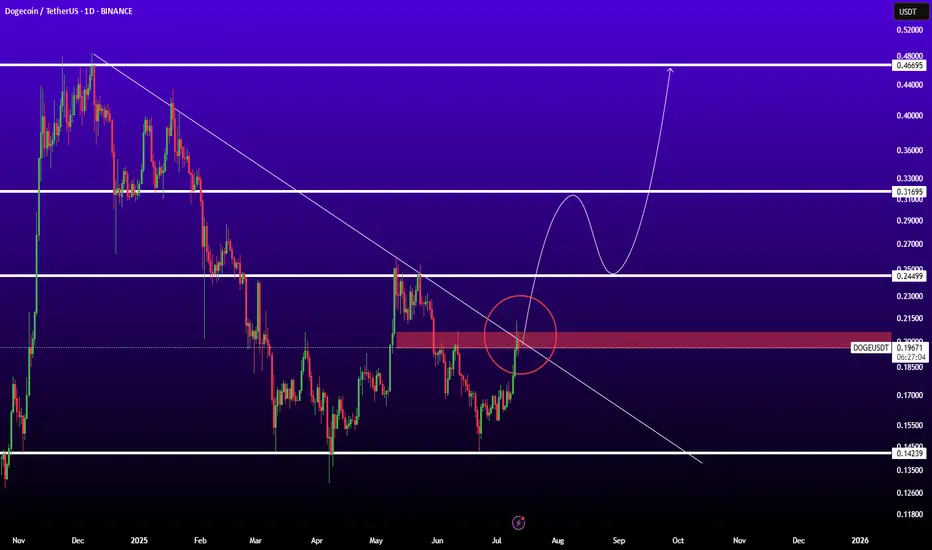
DOGEUSDTBINANCE:DOGEUSDT is in good level for pump because if breaked trendline and resistance 0.200$ ready for sharp movement to next levels.
Resistances: 0.25 - 0.32 - 0.45
Support: 0.15
Dogeusdt
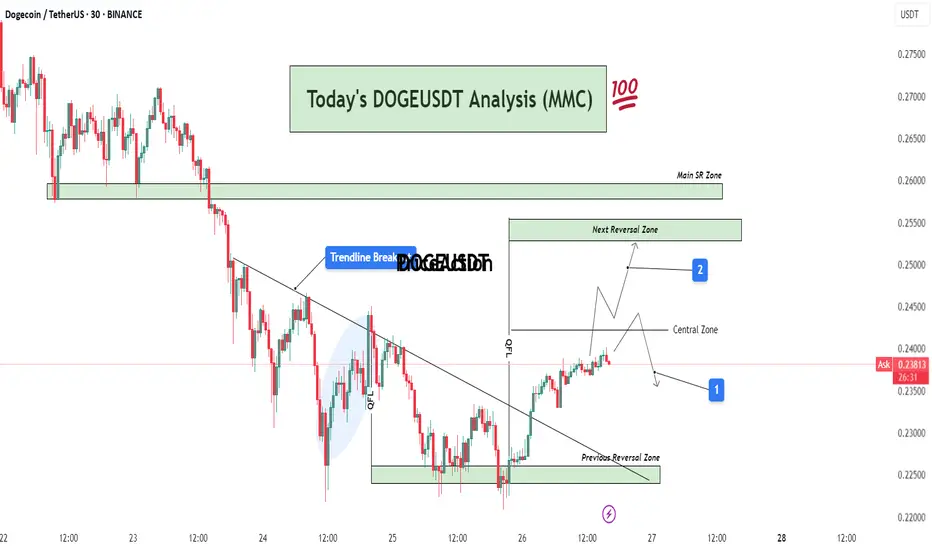
DOGEUSDT Analysis : Bullish Breakout, Reversal Zones + Target📊 Full Technical Analysis:
This chart presents a structured and precise MMC-based analysis of DOGE/USDT on the 30-minute timeframe, integrating key price action zones, trendline structure, and potential market scenarios.
🧩 1. Downtrend Phase and Trendline Formation
DOGE was in a continuous downtrend, creating lower highs and lower lows. A bearish trendline had been acting as dynamic resistance for multiple sessions. Price consistently respected this trendline, indicating strong seller dominance.
However, after repeated taps on the trendline and rejection from lower support, price finally broke above the trendline — marking a potential trend reversal or corrective phase.
🔄 2. Previous Reversal Zone – Demand Zone (0.225–0.228)
This zone acted as the major turning point where buyers aggressively stepped in. The demand was previously tested and respected, indicating strong accumulation here.
From this zone, a bullish reversal was initiated, leading to the current price rally.
This area can now be considered a structural support base – ideal for watching future re-tests or consolidation.
🔁 3. Central Zone – Decision Area (0.238–0.240)
This is a critical intraday resistance zone acting as a central decision-making area for traders.
Two Key Scenarios Could Play Out from Here:
Scenario 1 (Marked by Blue Box 1):
Price could face rejection from this zone and fall back slightly toward minor support levels for a retest or liquidity grab. If bullish pressure sustains, a higher low may form before continuation upward.
Scenario 2 (Marked by Blue Box 2):
If price breaks above the central zone with strong volume, momentum can push it toward the Next Reversal Zone between 0.250–0.255.
In either case, watching price behavior and candle structure near the central zone is critical for confirmation of the next move.
🔼 4. Next Reversal Zone – Supply/Resistance (0.250–0.255)
This zone marks a historical resistance area where DOGE faced heavy selling pressure before.
If price reaches this zone, expect:
Either profit-taking and short-term selling from intraday traders.
Or a possible breakout continuation if broader market sentiment remains bullish.
This zone will act as a key test of DOGE's strength and market conviction.
📌 5. Main SR Zone – Strong Structure (0.258–0.260)
Beyond the Next Reversal Zone lies the Main SR (Support-Resistance) Zone, where price has reacted strongly in the past.
If DOGE manages to break and hold above the 0.255 range, this zone will likely become the next upside target and strong resistance zone.
🔍 Additional Market Context:
Breakout Volume: The trendline breakout was accompanied by rising volume, which suggests stronger conviction behind the move.
QFL Zone: Price structure also aligned with a QFL (Quick Flip Level) bounce within the shaded region before breakout, further validating the bullish pressure.
Psychological Levels: 0.240 and 0.250 are psychological levels, which often act as magnet points and temporary resistance/support.
🧠 Mirror Market Concepts (MMC) Insight:
This analysis is rooted in Mirror Market Concepts, where the market tends to reflect past behavioral zones. Each marked zone (Demand, Central, Reversal, SR) is based on previous reaction points that guide current sentiment.
The market is now in a mirror reaction phase, moving from the previous demand zone toward historical supply zones. If the symmetry continues, the pattern supports a gradual bullish continuation with measured pullbacks.
✅ Trading Plan (Educational Purpose Only – Not Financial Advice):
Entry Zone 1: Breakout traders may have entered after the trendline breakout near 0.233–0.235.
Entry Zone 2: Conservative traders can look for retest confirmation in the Central Zone.
Target Zone: Next Reversal Zone (0.250–0.255) and possibly Main SR (0.260).
Stop Loss: Below the Previous Reversal Zone (~0.224) for swing setups.
Risk-to-Reward: RR setup of 1:2 or higher possible depending on entry strategy.
#DOGE/USDT falling wedge#DOGE
The price is moving within a descending channel on the 1-hour frame and is expected to break and continue upward.
We have a trend to stabilize above the 100 Moving Average once again.
We have a bearish trend on the RSI indicator, supporting the upward break.
We have a support area at the lower boundary of the channel at 0.22270, acting as strong support from which the price can rebound.
We have a major support area in green that pushed the price upward at 0.21777.
Entry price: 0.2320
First target: 0.24210
Second target: 0.25380
Third target: 0.26920
To manage risk, don't forget stop loss and capital management.
When you reach the first target, save some profits and then change the stop order to an entry order.
For inquiries, please comment.
Thank you.

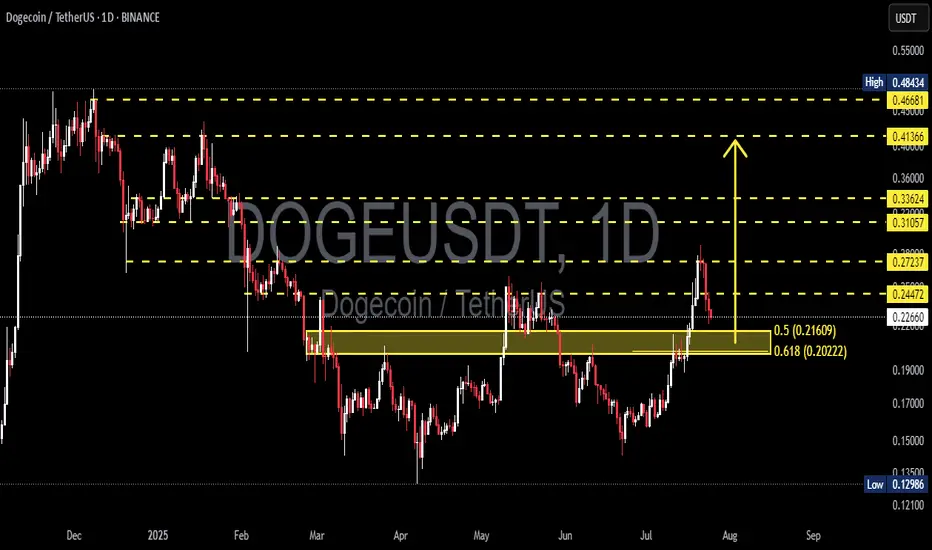
DOGEUSDT at a Make-or-Break Level: Bounce or a Breakdown?📉 Overview:
After a strong rally from the $0.13 zone to a recent local high of $0.272, DOGE is now undergoing a healthy correction. The price has retraced to a critical Fibonacci Golden Pocket zone (0.5–0.618) between $0.21609 and $0.20222 — historically one of the most powerful zones for market reactions.
This area also aligns with a previous resistance zone that is now being retested as support — a classic SR Flip (Support/Resistance Flip).
---
📌 Key Technical Structure:
🔸 Support & Demand Zone (Golden Pocket):
$0.21609 (Fib 0.5) and $0.20222 (Fib 0.618) – key retracement levels of the recent bullish swing.
Acts as a confluence zone with horizontal support from prior consolidation.
🔸 Major Resistance Levels:
$0.24472 – immediate resistance to reclaim.
$0.27237 – recent high and a major supply zone.
$0.31057, $0.33624 – historical distribution zones.
$0.41366 – breakout confirmation zone for a full trend reversal.
---
🧠 Market Psychology & Patterns:
Breakout & Retest: DOGE recently broke out from a long-term range and is now retesting the breakout zone.
Potential Bull Flag or Descending Channel: Current pullback resembles a flag or bull pennant — both continuation patterns if confirmed with volume.
---
✅ Bullish Scenario (Bounce):
If DOGE holds the Golden Pocket ($0.216–$0.202) and prints a strong bullish reversal candle:
A bounce may push price back to $0.244, and if reclaimed, back to $0.272.
A confirmed breakout above $0.272 with volume could lead to:
Mid-term targets: $0.310 → $0.336 → $0.413 → $0.466.
📈 Confirmation: Daily candle close above $0.244 with rising volume.
---
❌ Bearish Scenario (Breakdown):
If price fails to hold above $0.202 and breaks below with daily close:
It signals invalidation of the bullish structure and possible reversal.
Downside targets:
$0.186 – short-term support.
$0.150 – psychological support.
$0.129 – Year-to-date low (YTD Low).
This would also form a Lower High – Lower Low structure indicating a shift to a bearish trend.
---
🔍 Volume & Momentum Clues:
Watch for volume spikes near $0.202–$0.216.
Strong green candle + volume = likely reversal.
Weak reaction or breakdown on low volume = potential continuation downward.
---
🎯 Trader Playbook:
Signal Action Target
Bounce from $0.216–$0.202 Long Entry $0.244 – $0.272
Daily close below $0.202 Short / Avoid Longs $0.186 → $0.150
Breakout above $0.272 w/ volume Breakout Entry $0.31 → $0.336 → $0.41+
---
🏁 Conclusion:
DOGE is currently at a critical inflection point. The Golden Pocket zone will likely determine whether bulls are accumulating for another leg up or bears are about to reclaim control.
💡 This is a time for strategy, not prediction. Wait for confirmation before committing to either direction. The market is speaking — all we have to do is listen.
---
📊 Chart Summary:
Timeframe: Daily (1D)
Pattern: Breakout Retest + Fibonacci Retracement + Bull Flag
Structure: Higher High – looking for Higher Low confirmation
#DOGEUSDT #Dogecoin #CryptoTA #GoldenPocket #AltcoinAnalysis #FibonacciTrading #BreakoutSetup #BullishContinuation #BearishReversal
DOGECOIN : Should we expect an increase?Hello friends🙌
📈Given the decline we had, you can see that buyers entered at the specified support and formed a double bottom reversal pattern, which is a strong signal on support.
📉Considering the possible market correction, we placed two more buy levels lower so that we can buy there if the price corrects.
⚠Don't forget about capital and risk management, friends.
🔥Follow us for more signals🔥
*Trade safely with us*

DOGE Swing Trade – Key Support in PlayDOGE is currently holding a major support zone, offering a strong risk-reward opportunity for a long swing position. With bullish sentiment and meme coin narratives returning, this level is worth watching for upside continuation.
📌 Trade Setup:
• Entry Zone: $0.23 – $0.24
• Take Profit Targets:
o 🥇 $0.27 – $0.28
o 🥈 $0.37 – $0.44
• Stop Loss: Just below $0.215

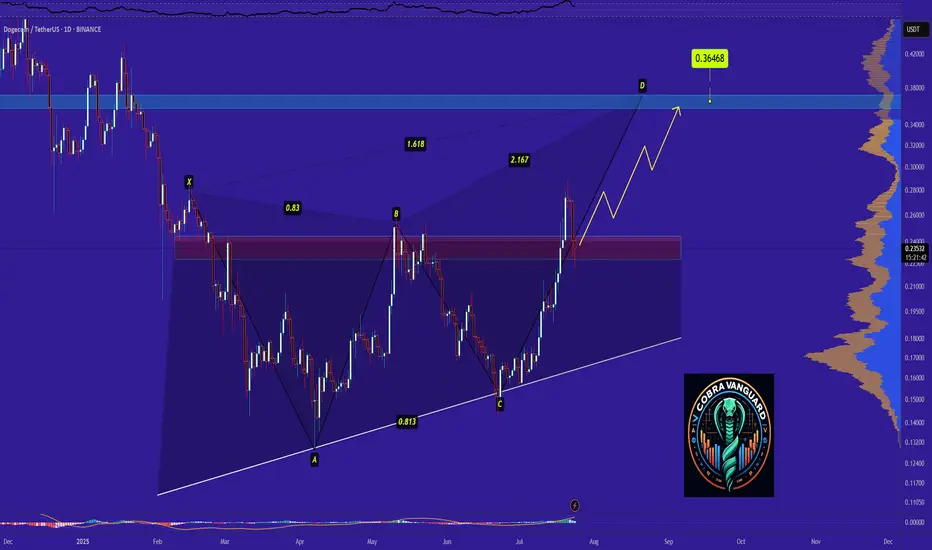
Dogecoin Ready for PUMP or what ?Dogecoin has completed and broken the ascending triangle in the daily timeframe, The price is currently supported well, which can increase the price. I expect the price to rise to around 0.36 .
Stay Awesome , CobraVanguard
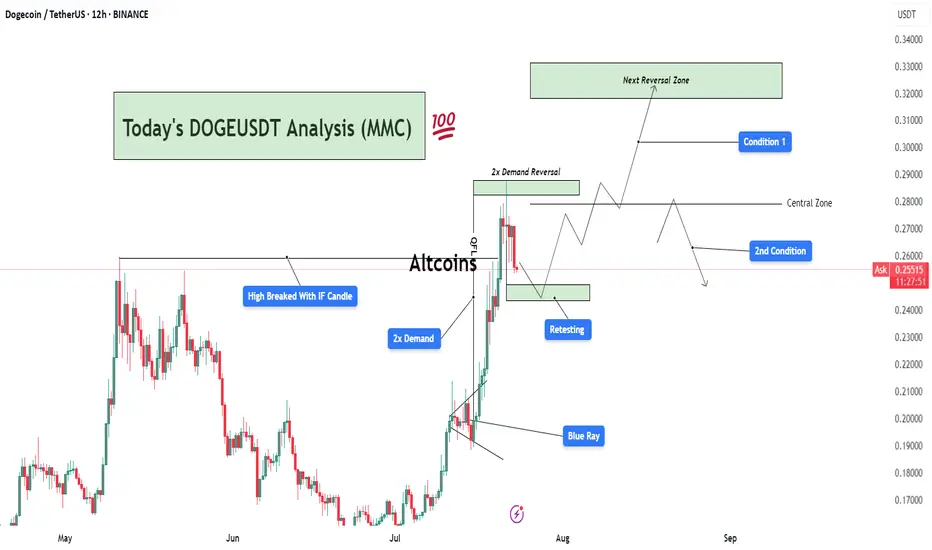
DOGEUSDT Analysis : Demand Zone Retest Before New Highs Target📊 Overview:
Today's DOGEUSDT analysis (12H chart) under the Mirror Market Concept (MMC) framework reveals a potential bullish continuation or corrective phase based on two major conditions. The market structure is transitioning after a strong impulsive move, triggered by a 2x Demand Zone breakout, and is now in the retesting phase.
🔍 Key Technical Breakdown:
High Broken with IF Candle:
A significant previous swing high was broken decisively by an Initiation Flow (IF) candle, indicating institutional activity or aggressive buying pressure.
This confirms a shift in market structure toward a bullish trend.
2x Demand Zone:
This zone has served as a strong base for price accumulation and an impulsive breakout.
The market responded well with a sharp rally post this demand, validating it as a critical support.
Blue Ray Zone (Support Zone):
The bullish breakout was partially driven by this inner trendline zone (referred to as Blue Ray), where price respected the rising support channel before breakout.
This shows smart money liquidity engineering prior to the breakout.
Retesting Zone:
Currently, the price is retracing toward a previously broken demand zone.
If this zone holds, it could provide an optimal entry for continuation.
📈 Two Scenarios (Conditions):
✅ Condition 1: Bullish Breakout to Next Reversal Zone
If the retest holds and price prints bullish confirmation (e.g., engulfing or pin bar), we can expect price to move up toward the next key reversal zone between $0.3100–$0.3300.
This zone is marked as a potential supply/reversal zone, where large sell-offs may occur.
This path follows the continuation structure under MMC, aligning with trend-following buyers.
⚠️ Condition 2: Failure to Hold Demand → Deeper Pullback
If the current demand zone fails to hold and price re-enters below the central zone (~$0.2700), we could expect a deeper correction.
Price may then revisit lower demand regions, potentially toward $0.2200 or lower, depending on rejection strength.
📌 Important Notes:
The central zone acts as a pivot level, defining whether bulls or bears gain short-term control.
Monitor the reaction from retesting area closely — candle confirmation is key before any trade execution.
This chart follows Mirror Market Concepts (MMC), combining smart money behavior, demand/supply reversal logic, and psychological market zones.
💬 Final Thoughts:
DOGEUSDT is currently in a critical phase. The market has shown strength, but now it's about confirmation. Patience is key — wait for a clean break or rejection around the retesting zone to determine the next direction. The analysis favors bullish continuation, but being flexible with both scenarios gives traders an edge.
Bullish DOGE Setup: $0.60, $0.80, and $1 Main TargetsHello✌
Let’s analyze Dogecoin’s upcoming price potential 📈.
BINANCE:DOGEUSDT , I expect a long-term upward bullish trend.
There are three main targets in this analysis: $0.60, $0.80, and a final target of $1. These targets could be reached within 2 to 6 years.
The price may form parallel channels at times, which are shown on the chart. There is also a strong trendline and a good daily support level backing this movement.
✨We put love into every post!
Your support inspires us 💛 Drop a comment we’d love to hear from you! Thanks , Mad Whale🐋
🐋Many of the points and levels shown on the chart are based on personal experience, feeling, and over 7 years of research and daily study of crypto charts.
Some of the lines, channels, and price zones are drawn to make the chart easier to understand and to help imagine possible future price movements.
I’ve also included one very big drop in price even bigger than the others because in the crypto market, it’s common for prices to suddenly fall hard and push out small investors and traders with positions.
The targets on the chart are not guaranteed; they might be reached, or they might not.📚
📜Please make sure to do your own research before investing, and review the disclaimer provided at the end of each post.

DOGE | Gearing up For a BIG MOVEDoge is looking mighty bullish after establishing a clear bottom.
Together with confirmation from BTC, we can safely say that altseason is yet ahead of us. BTC's recent increase show that the bullish impulse is still upon us. And after ETH increases, the rest of the altcoin market will follow suit as per usual.
DOGE is bullish because:
✅ Clear bottom
✅ Higher lows, daily looking to reclaim the moving averages:
✅ Altseason upon us after ETH increase
Ultimately, we need to wait for confirmation - if THIS major resistance zone is cleared (in other words if daily candles close ABOVE this zone) then we're full bull mode.
________________
BINANCE:DOGEUSDT

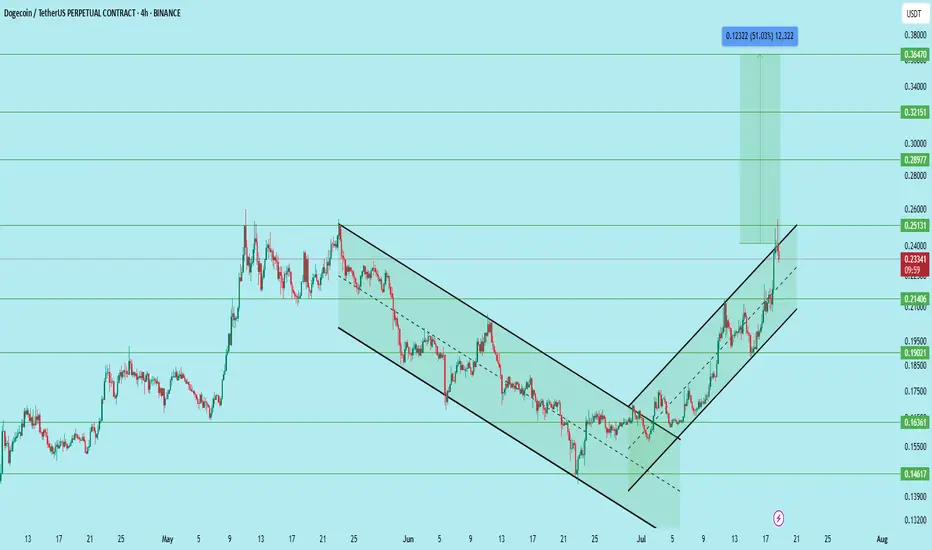
DOGE/USDT – Bullish Setup with Clear Channel BreakoutDogecoin has successfully broken out of a falling wedge and is now trending within a rising channel on the 4H timeframe. The price recently reclaimed the 0.214 support zone and is now showing continuation with strong volume and structure.
After the breakout and multiple retests, the pair offers a compelling long opportunity.
Setup Details:
Entry Zone: 0.208 to 0.214
Stop Loss: 0.186
Targets:
• 0.251 – First major resistance
• 0.289 – Mid-level breakout target
• 0.321 – Psychological round number
• 0.364 – Final target (approx. 51% move)
Technical Structure:
Breakout from falling wedge followed by bullish channel, Higher highs and higher lows clearly forming, Volume supports accumulation near breakout levels, Support holding above 0.214, confirming demand
Support Zones:
0.214 (reclaimed)
0.190 (intermediate)
0.163 (major demand zone)
Resistance Zones:
0.251
0.289
0.321
0.364
This setup offers a clean risk-reward ratio with confirmation on trend continuation. A rejection at 0.251 may present another opportunity to re-enter on a retest.
DYOR. Not financial advice.
#DOGE Update #1 – July 21, 2025#DOGE Update #1 – July 21, 2025
Dogecoin has made healthy retracements after both of its last impulsive moves, maintaining a technically sound structure. I took a profit yesterday but didn’t share it due to higher risk.
Now, I've opened the Long position visible in the chart because I believe DOGE is targeting the second leg of this impulsive move, aiming for the $0.29 zone. I’m expecting approximately 6% gain from this setup.
The trend remains bullish, and pullbacks have been met with solid support, giving this trade a high probability of continuation. That said, always be cautious with sharp volatility.

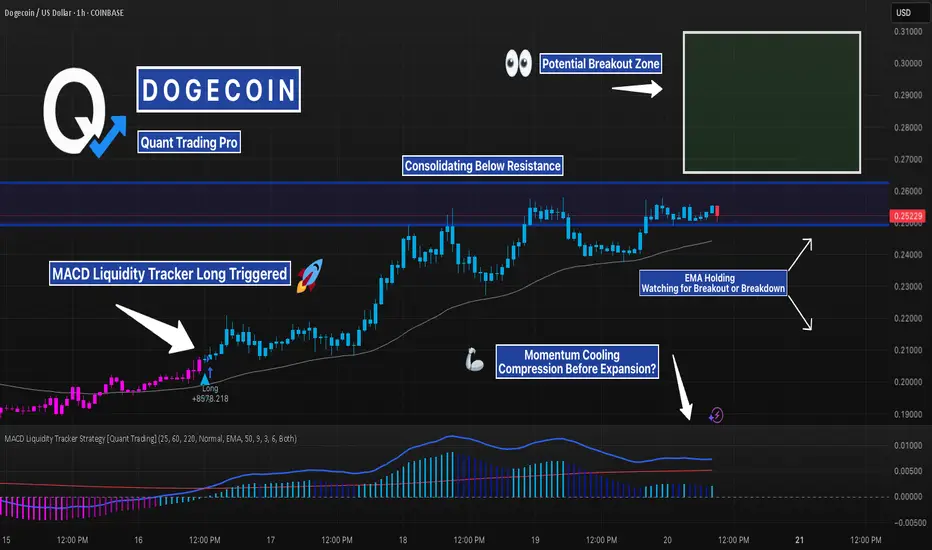
DOGE Coiling Below Resistance — Liquidity Tracker Already TriggeDOGE broke structure last week and pushed into a key resistance zone — but now price is going flat, consolidating just below breakout territory. This type of pause can either lead to continuation or a trap, and that’s exactly what we’re watching for.
The MACD Liquidity Tracker Strategy already triggered long earlier in the move, right around the $0.226 reclaim — a clean entry confirmed by bullish histogram shift, crossover, and trend alignment.
Since then, price has respected the EMA and gradually built up pressure just under the $0.257–0.270 zone.
The strength of this strategy is in combining MACD compression/expansion with trend filters, so it avoids whipsaw entries and only triggers when momentum AND structure align. This helps traders catch the beginning of a move — not the middle or end.
Right now, momentum is compressing again on lower timeframes, which often leads to a volatility expansion. The strategy is quiet for now, but the earlier long is still holding and valid.
We’re watching closely for a clean breakout above resistance — or signs of weakness that invalidate the move.
Whether this consolidates further or explodes from here, the setup has already shown how effective good filtering and timing can be.
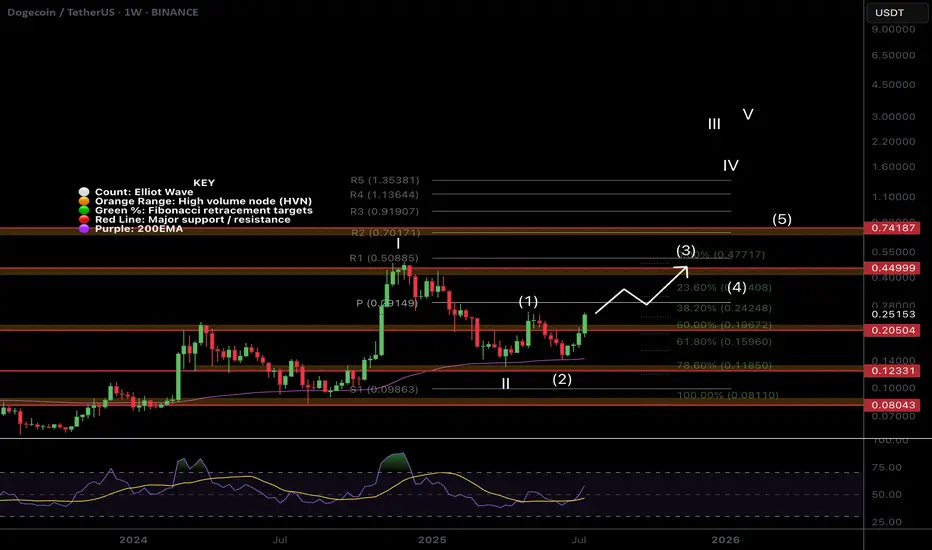
$DOGE Flipping to Bullish Structure!CRYPTOCAP:DOGE is coming to life after a second test of the weekly 200EMA as support and about to make a higher high, cementing in that higher low and flipping the macro structure bullish!
If the count is correct wave 3 of (III) should be powerful! The weekly pivot should put up a challenge as the first resistance before the High Volume Node at $0.45
Safe Trading
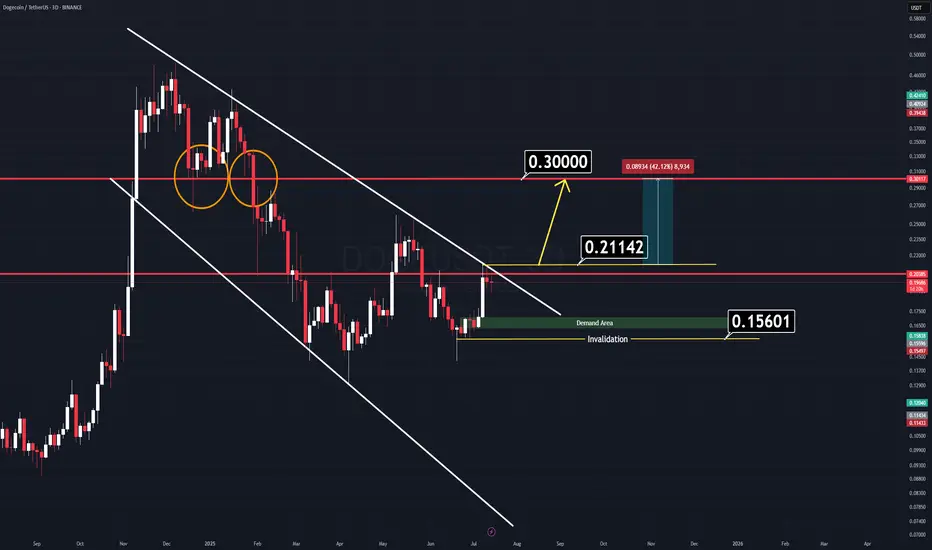
DOGE Analysis (3D)There’s a very simple and clear chart setup on Dogecoin (DOGE) right now.
We have two major horizontal key levels and a channel that is about to break down. If the price manages to close above the yellow-marked line ($0.21142), we can expect a strong rally to follow.
There’s no need for complicated indicators cluttering the screen — all relevant levels are clearly marked on the chart.
Two Logical Entry Approaches:
1️⃣ Breakout Entry: Enter on a confirmed breakout. (Waiting for a daily candle close on a memecoin might slightly reduce your profit range, but it’s the safer approach.)
2️⃣ Demand Zone Entry: Wait for the price to retrace to the green demand zone — though this scenario seems less likely for now.
A combined approach can work best: enter on breakout, use the horizontal levels as support, and set a tight stop-loss to manage risk.
Good Luck.
$1 in the Horizon for $DOGE!We’ve got something interesting brewing on CRYPTOCAP:DOGE right now:
Monthly trend is active
Uptrend in place for over a year (not relying on that timeline, but historically, targets hit within it)
If we can get above $0.30 and hold, the path to $1 opens up for the first time.
Other similar charts are also aligning for exponential moves, setting up to break out of multi-year consolidation patterns.
Keep a close eye on CRYPTOCAP:XLM as well — it’s shaping up with a very similar structure.

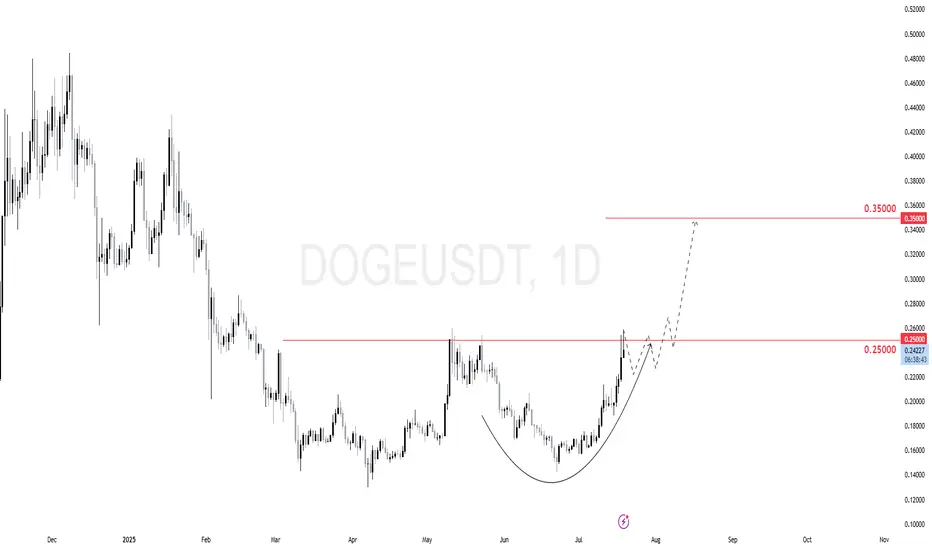
$DOGE (DOGECOIN) 1DDOGE just broke above the 0.25 key resistance.
The daily chart shows a clean cup-and-handle formation with a potential continuation setup.
Price might consolidate just above 0.25, creating a bullish base.
Then we expect a continuation move toward 0.35 as next target.
DOGE/BTC: HTF Retest Complete — Reversal BrewingDiving into DOGE/BTC, we’re seeing strong bullish confluences that align well with the DOGE/USDT structure and support the idea that the macro low is in.
Looking back across all available data, DOGE/BTC has traded within a clear 7-year accumulation range dating back to 2014, bounded by a defined range high resistance and range low support. This long period of consolidation enabled massive accumulation, ultimately leading to the first breakout in 2021, which rejected at the highs, pulled back, and then exploded into a cycle ATH.
Since that 2021 high, DOGE/BTC has been in a 4-year downtrend, retracing back into discount pricing, right into the range high of that original accumulation zone — which now acts as a major HTF demand level and last point of support before the original breakout.
📉 What’s happened recently?
- Price swept 2024 swing lows (SSL)
- Tagged the HTF demand zone
- Retested the 2021 breakout level (accumulation range high)
- Coiling inside a descending wedge with contracting volatility
This entire region is a key reversal zone from both a structural and psychological standpoint. It’s where we typically see major trend shifts form, and the structure suggests we’re forming a HTF swing low and bottom from this area.
🧠 Add this to the confluence from DOGE/USDT — which also appears to have printed its bottom — and the case for a macro reversal gets even stronger.
As this wedge tightens and price continues to compress against long-term support, I’m anticipating an explosive breakout that kickstarts the next leg of the HTF uptrend — effectively a continuation of the original breakout from the 7-year range.
5D:

DOGE - Another Perspective- DOGE is currently trading nearing the trendline resistance and pending breakout
- A clear breakout from this resistance line is a must to continue to bullish momentum.
- we will enter the trade after confirmed breakout
Entry: 0.221
SL at: 0.14103
TP1: 0.26035
TP2: 0.33892
TP3: 0.47751
Stay tuned for more updates.
Cheers
GreenCrypto

#DOGEUSDT: Swing Move In Making! Get ReadyThe cryptocurrency market is currently experiencing a rally due to the bullish trend of the underlying assets. The price has experienced a period of accumulation, followed by a distribution process. We have established a swing target based on the potential for the price to reach the previous record high. Technical indicators support our analysis, but we acknowledge the need for strong fundamental support to achieve this level.
We wish you the best of luck in your trading endeavours and encourage you to share our insights by liking and commenting on this post.
Sincerely,
Team Setupsfx_

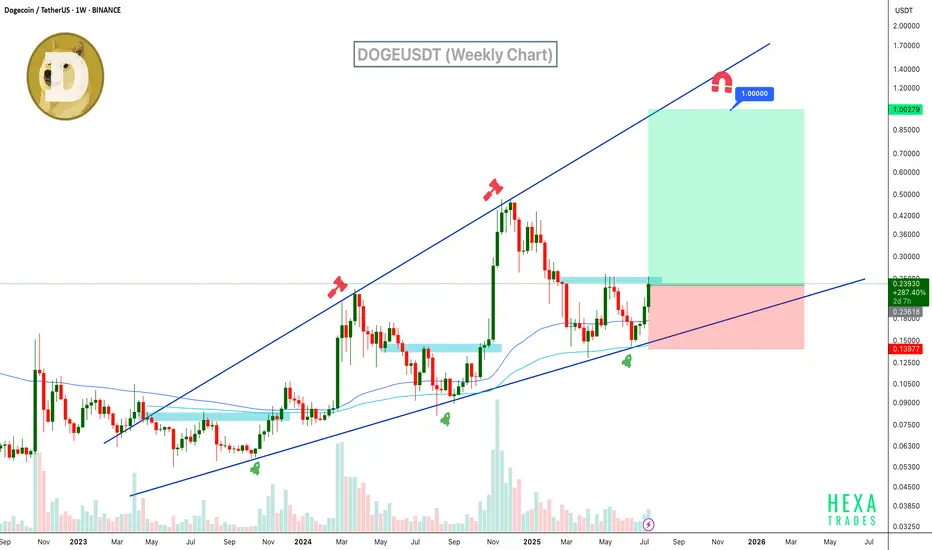
Will DOGE Hit $1? Ascending Broadening Wedge in PlayDogecoin is trading within a clear ascending broadening wedge on the weekly chart. The price has bounced strongly from wedge support and the 100 and 200 EMAs, now pushing upward with growing volume and bullish candles. If momentum sustains, DOGE could rally toward the $1 psychological target and broadening wedge resistance.
Resistance 1: $0.35
Resistance 2: $0.60
Resistance 3: $1.00
Stop Loss: $0.14
Cheers
Hexa
COINBASE:DOGEUSD BINANCE:DOGEUSDT
DO GE - Call the Ambulance!Okay DOGE thinks he is smart but he aint he will be taking hype and fall down and fall down in the place where no one can expect! Quasimodo in position!

$DOGE Double Bottom TargetIf this double bottom "W" pattern on CRYPTOCAP:DOGE plays out, the target is $0.47.
Two notes:
1. The double-bottom pattern has a 60-65% success rate (no guarantees).
2. The Alt market has been very strong, with new dollars entering the market. If we close above $0.25-0.26 and retest, I think this target is likely as it returns to the high for this cycle.
