Bullish DOGE Setup: $0.60, $0.80, and $1 Main TargetsHello✌
Let’s analyze Dogecoin’s upcoming price potential 📈.
BINANCE:DOGEUSDT , I expect a long-term upward bullish trend.
There are three main targets in this analysis: $0.60, $0.80, and a final target of $1. These targets could be reached within 2 to 6 years.
The price may form parallel channels at times, which are shown on the chart. There is also a strong trendline and a good daily support level backing this movement.
✨We put love into every post!
Your support inspires us 💛 Drop a comment we’d love to hear from you! Thanks , Mad Whale🐋
🐋Many of the points and levels shown on the chart are based on personal experience, feeling, and over 7 years of research and daily study of crypto charts.
Some of the lines, channels, and price zones are drawn to make the chart easier to understand and to help imagine possible future price movements.
I’ve also included one very big drop in price even bigger than the others because in the crypto market, it’s common for prices to suddenly fall hard and push out small investors and traders with positions.
The targets on the chart are not guaranteed; they might be reached, or they might not.📚
📜Please make sure to do your own research before investing, and review the disclaimer provided at the end of each post.
Dogeusdt

DOGE | Gearing up For a BIG MOVEDoge is looking mighty bullish after establishing a clear bottom.
Together with confirmation from BTC, we can safely say that altseason is yet ahead of us. BTC's recent increase show that the bullish impulse is still upon us. And after ETH increases, the rest of the altcoin market will follow suit as per usual.
DOGE is bullish because:
✅ Clear bottom
✅ Higher lows, daily looking to reclaim the moving averages:
✅ Altseason upon us after ETH increase
Ultimately, we need to wait for confirmation - if THIS major resistance zone is cleared (in other words if daily candles close ABOVE this zone) then we're full bull mode.
________________
BINANCE:DOGEUSDT

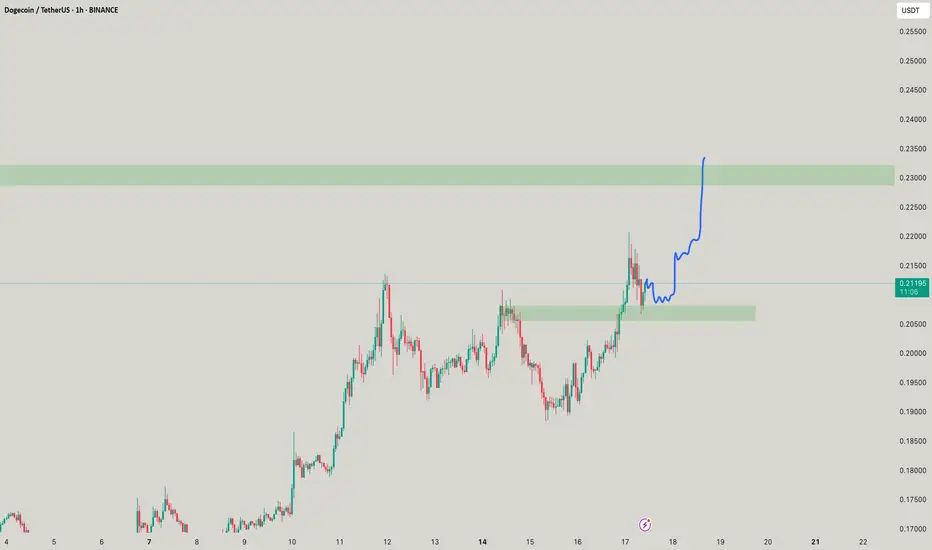
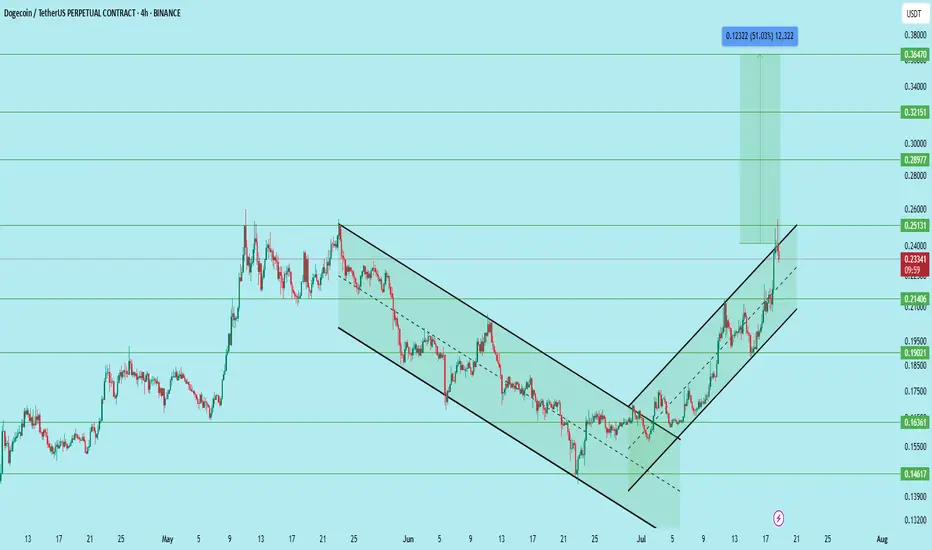
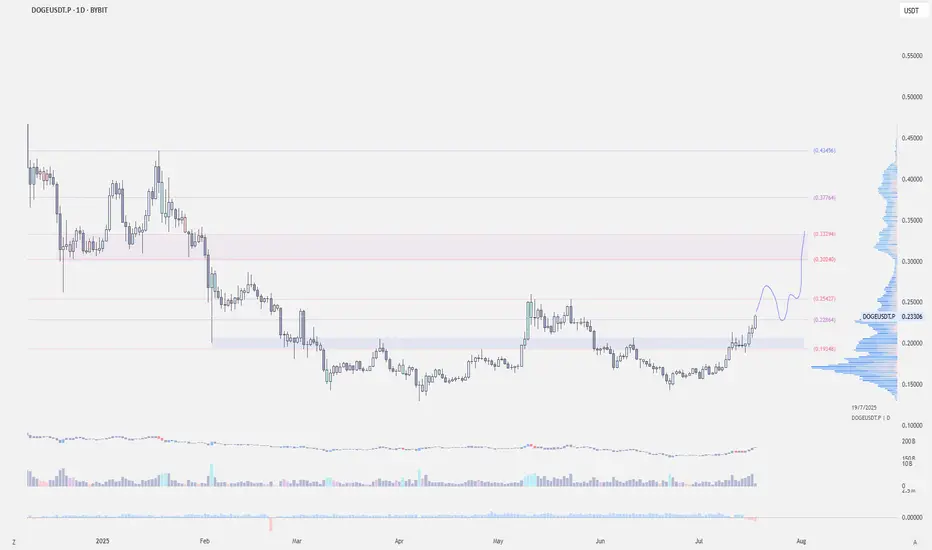
DOGE/USDT – Bullish Setup with Clear Channel BreakoutDogecoin has successfully broken out of a falling wedge and is now trending within a rising channel on the 4H timeframe. The price recently reclaimed the 0.214 support zone and is now showing continuation with strong volume and structure.
After the breakout and multiple retests, the pair offers a compelling long opportunity.
Setup Details:
Entry Zone: 0.208 to 0.214
Stop Loss: 0.186
Targets:
• 0.251 – First major resistance
• 0.289 – Mid-level breakout target
• 0.321 – Psychological round number
• 0.364 – Final target (approx. 51% move)
Technical Structure:
Breakout from falling wedge followed by bullish channel, Higher highs and higher lows clearly forming, Volume supports accumulation near breakout levels, Support holding above 0.214, confirming demand
Support Zones:
0.214 (reclaimed)
0.190 (intermediate)
0.163 (major demand zone)
Resistance Zones:
0.251
0.289
0.321
0.364
This setup offers a clean risk-reward ratio with confirmation on trend continuation. A rejection at 0.251 may present another opportunity to re-enter on a retest.
DYOR. Not financial advice.
#DOGE Update #1 – July 21, 2025#DOGE Update #1 – July 21, 2025
Dogecoin has made healthy retracements after both of its last impulsive moves, maintaining a technically sound structure. I took a profit yesterday but didn’t share it due to higher risk.
Now, I've opened the Long position visible in the chart because I believe DOGE is targeting the second leg of this impulsive move, aiming for the $0.29 zone. I’m expecting approximately 6% gain from this setup.
The trend remains bullish, and pullbacks have been met with solid support, giving this trade a high probability of continuation. That said, always be cautious with sharp volatility.

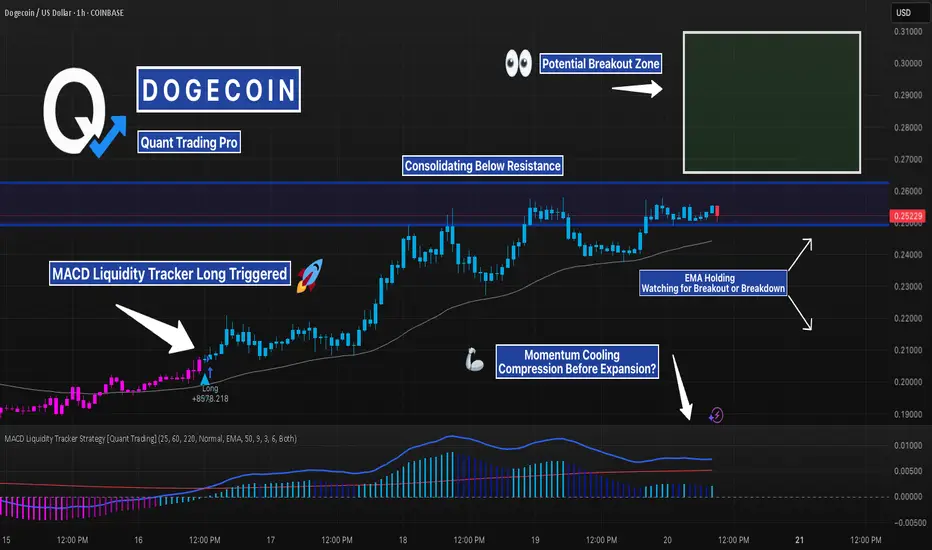
DOGE Coiling Below Resistance — Liquidity Tracker Already TriggeDOGE broke structure last week and pushed into a key resistance zone — but now price is going flat, consolidating just below breakout territory. This type of pause can either lead to continuation or a trap, and that’s exactly what we’re watching for.
The MACD Liquidity Tracker Strategy already triggered long earlier in the move, right around the $0.226 reclaim — a clean entry confirmed by bullish histogram shift, crossover, and trend alignment.
Since then, price has respected the EMA and gradually built up pressure just under the $0.257–0.270 zone.
The strength of this strategy is in combining MACD compression/expansion with trend filters, so it avoids whipsaw entries and only triggers when momentum AND structure align. This helps traders catch the beginning of a move — not the middle or end.
Right now, momentum is compressing again on lower timeframes, which often leads to a volatility expansion. The strategy is quiet for now, but the earlier long is still holding and valid.
We’re watching closely for a clean breakout above resistance — or signs of weakness that invalidate the move.
Whether this consolidates further or explodes from here, the setup has already shown how effective good filtering and timing can be.
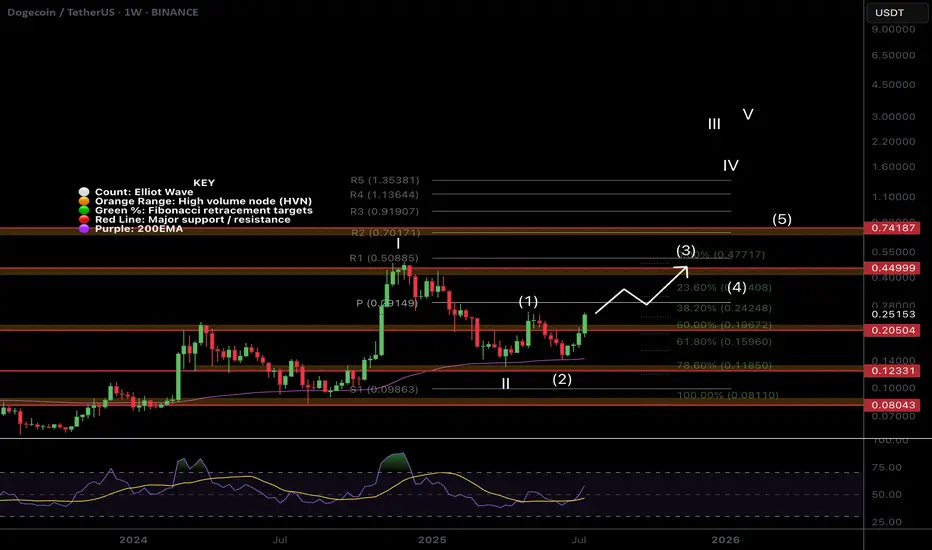
$DOGE Flipping to Bullish Structure!CRYPTOCAP:DOGE is coming to life after a second test of the weekly 200EMA as support and about to make a higher high, cementing in that higher low and flipping the macro structure bullish!
If the count is correct wave 3 of (III) should be powerful! The weekly pivot should put up a challenge as the first resistance before the High Volume Node at $0.45
Safe Trading
$1 in the Horizon for $DOGE!We’ve got something interesting brewing on CRYPTOCAP:DOGE right now:
Monthly trend is active
Uptrend in place for over a year (not relying on that timeline, but historically, targets hit within it)
If we can get above $0.30 and hold, the path to $1 opens up for the first time.
Other similar charts are also aligning for exponential moves, setting up to break out of multi-year consolidation patterns.
Keep a close eye on CRYPTOCAP:XLM as well — it’s shaping up with a very similar structure.

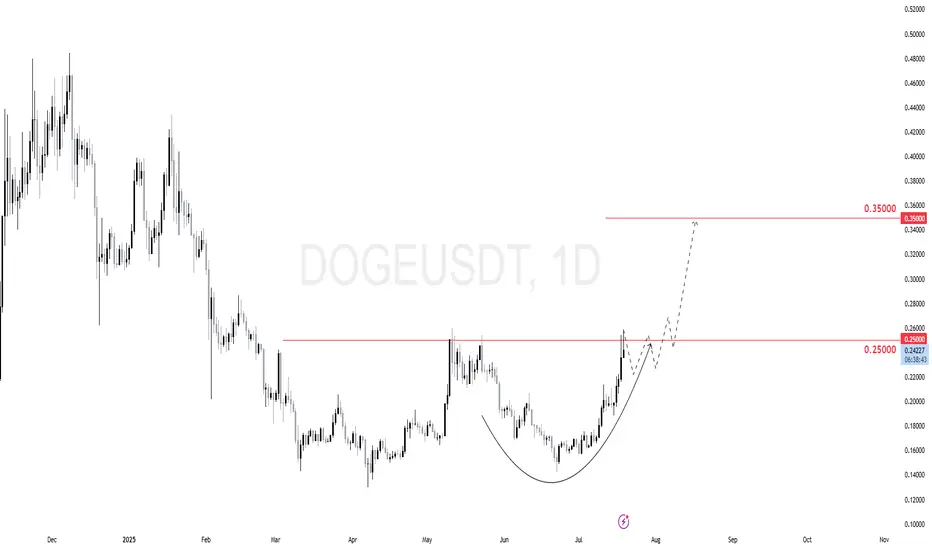
$DOGE (DOGECOIN) 1DDOGE just broke above the 0.25 key resistance.
The daily chart shows a clean cup-and-handle formation with a potential continuation setup.
Price might consolidate just above 0.25, creating a bullish base.
Then we expect a continuation move toward 0.35 as next target.
DOGE/BTC: HTF Retest Complete — Reversal BrewingDiving into DOGE/BTC, we’re seeing strong bullish confluences that align well with the DOGE/USDT structure and support the idea that the macro low is in.
Looking back across all available data, DOGE/BTC has traded within a clear 7-year accumulation range dating back to 2014, bounded by a defined range high resistance and range low support. This long period of consolidation enabled massive accumulation, ultimately leading to the first breakout in 2021, which rejected at the highs, pulled back, and then exploded into a cycle ATH.
Since that 2021 high, DOGE/BTC has been in a 4-year downtrend, retracing back into discount pricing, right into the range high of that original accumulation zone — which now acts as a major HTF demand level and last point of support before the original breakout.
📉 What’s happened recently?
- Price swept 2024 swing lows (SSL)
- Tagged the HTF demand zone
- Retested the 2021 breakout level (accumulation range high)
- Coiling inside a descending wedge with contracting volatility
This entire region is a key reversal zone from both a structural and psychological standpoint. It’s where we typically see major trend shifts form, and the structure suggests we’re forming a HTF swing low and bottom from this area.
🧠 Add this to the confluence from DOGE/USDT — which also appears to have printed its bottom — and the case for a macro reversal gets even stronger.
As this wedge tightens and price continues to compress against long-term support, I’m anticipating an explosive breakout that kickstarts the next leg of the HTF uptrend — effectively a continuation of the original breakout from the 7-year range.
5D:

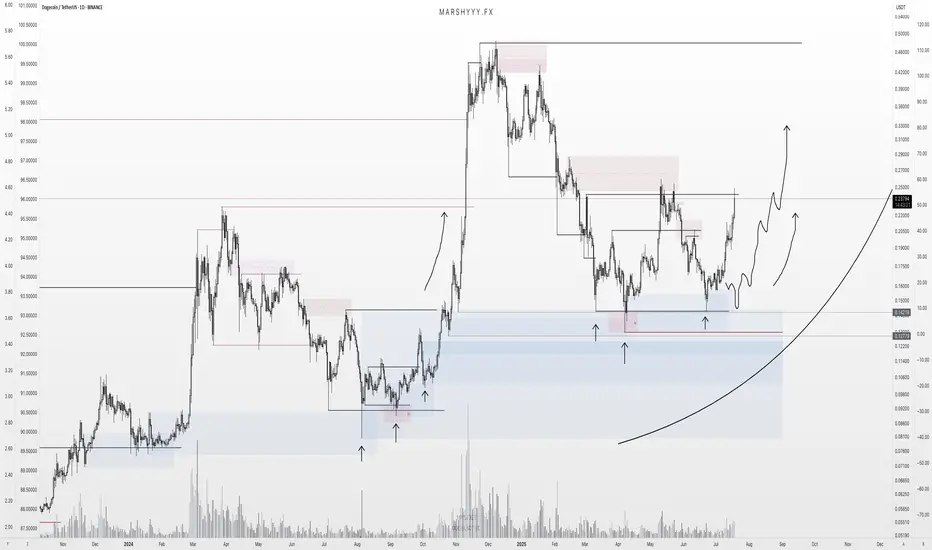
DOGE - Another Perspective- DOGE is currently trading nearing the trendline resistance and pending breakout
- A clear breakout from this resistance line is a must to continue to bullish momentum.
- we will enter the trade after confirmed breakout
Entry: 0.221
SL at: 0.14103
TP1: 0.26035
TP2: 0.33892
TP3: 0.47751
Stay tuned for more updates.
Cheers
GreenCrypto

#DOGEUSDT: Swing Move In Making! Get ReadyThe cryptocurrency market is currently experiencing a rally due to the bullish trend of the underlying assets. The price has experienced a period of accumulation, followed by a distribution process. We have established a swing target based on the potential for the price to reach the previous record high. Technical indicators support our analysis, but we acknowledge the need for strong fundamental support to achieve this level.
We wish you the best of luck in your trading endeavours and encourage you to share our insights by liking and commenting on this post.
Sincerely,
Team Setupsfx_

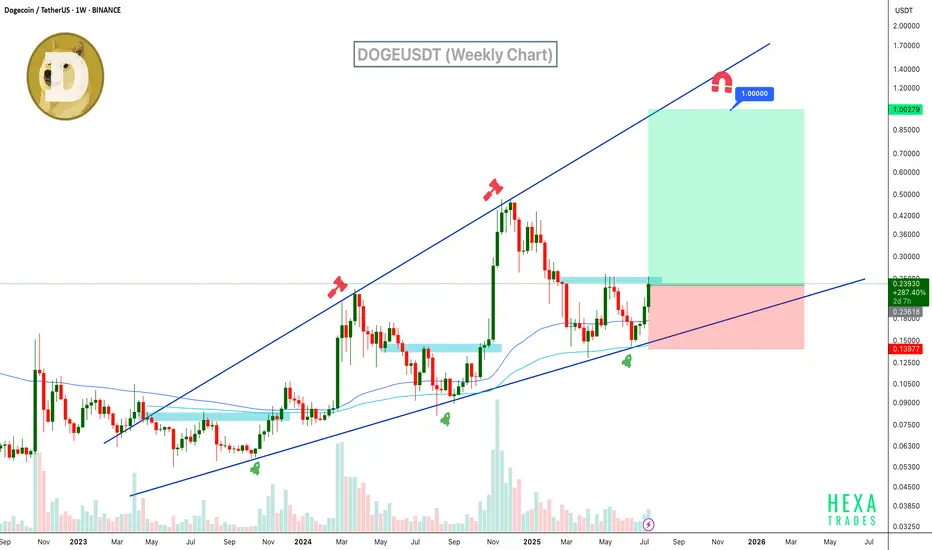
Will DOGE Hit $1? Ascending Broadening Wedge in PlayDogecoin is trading within a clear ascending broadening wedge on the weekly chart. The price has bounced strongly from wedge support and the 100 and 200 EMAs, now pushing upward with growing volume and bullish candles. If momentum sustains, DOGE could rally toward the $1 psychological target and broadening wedge resistance.
Resistance 1: $0.35
Resistance 2: $0.60
Resistance 3: $1.00
Stop Loss: $0.14
Cheers
Hexa
COINBASE:DOGEUSD BINANCE:DOGEUSDT
DO GE - Call the Ambulance!Okay DOGE thinks he is smart but he aint he will be taking hype and fall down and fall down in the place where no one can expect! Quasimodo in position!

$DOGE Double Bottom TargetIf this double bottom "W" pattern on CRYPTOCAP:DOGE plays out, the target is $0.47.
Two notes:
1. The double-bottom pattern has a 60-65% success rate (no guarantees).
2. The Alt market has been very strong, with new dollars entering the market. If we close above $0.25-0.26 and retest, I think this target is likely as it returns to the high for this cycle.

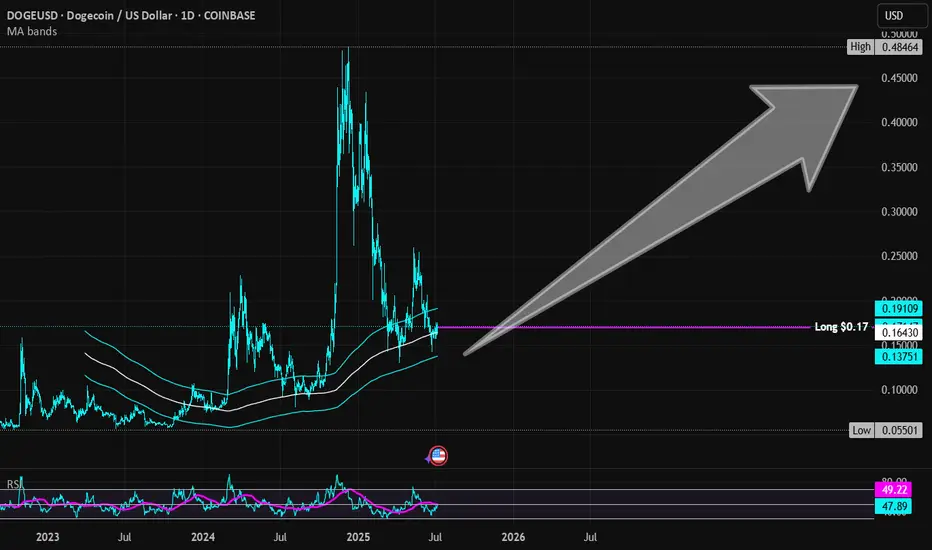
Dogecoin | DOGE | Long at $0.17Currently within my historical simple moving average area and consolidating. I suspect a move up is imminent, but 100% speculation. Crypto "bros" know more than I do.
Targets into 2028:
$0.25 (+47.1%)
$0.45 (+164.7%)
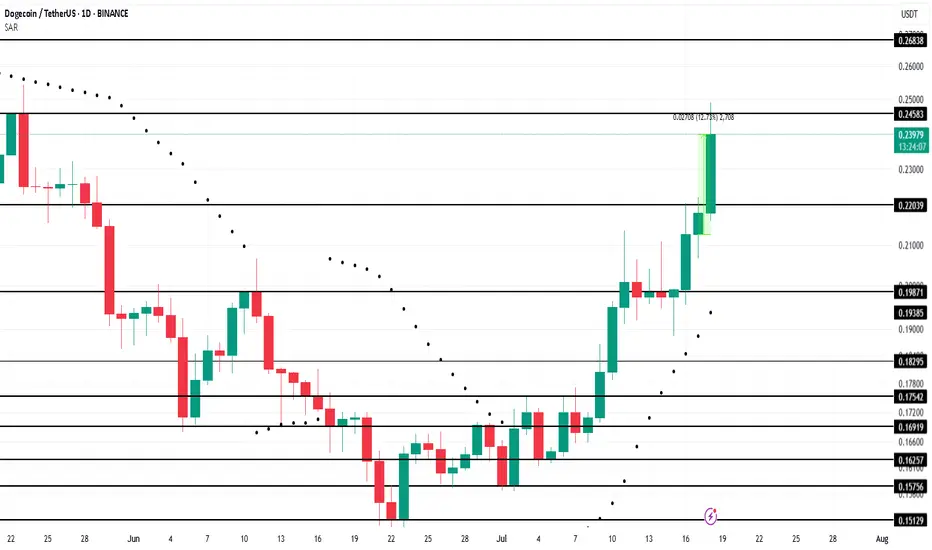
Dogecoin Leads Meme Coins With 12% Rally In 24 HoursBINANCE:DOGEUSDT , the leader of meme coins, surged 12% over the last 24 hours , reaching $0.239. This rally has positively impacted other meme tokens, showcasing DOGE’s influence within the market.
Currently facing resistance at $0.245, BINANCE:DOGEUSDT has reached a 2-month high . The Parabolic SAR below the candlesticks signals that DOGE is likely to maintain its upward trend in the coming days. If this support holds, the meme coin could continue pushing towards higher price levels, attracting more buyers and momentum.
However, meme coins are volatile. If BINANCE:DOGEUSDT holders decide to cash out their profits, the price could drop back down to $0.220 . Losing this support would invalidate the bullish outlook, signaling a possible downturn for the altcoin in the short term.
DOGE Update: Reversal Playing Out — $1+ in Sight?DOGE is playing out almost exactly as forecast back on June 14th, where I was monitoring for price to sweep the SSL and tap into range low demand within this larger HTF range.
Price did exactly that — pushing into discount, tagging the marked demand zone, and bottoming out right where I expected the reversal. I DCA’d hard at $0.165 after the initial low printed — just as planned.
Now sitting around +50% on those buys, and my plan remains to ride this out toward the ATH at $0.74 and potentially $1+.
The HTF closes forming here — across 3D, 4D, 5D, 6D candles — are showing clear strength. For me, the low is likely in, and I’m expecting new higher highs and ATHs from here. Now it’s just about letting the market do its thing, trailing stops, and taking profits into strength as alerts and targets get hit.
Zooming way out — I’m also watching DOGE’s 10-year uptrend channel. Price has once again tagged the lower bound of that channel, and historically, this has led to moves back to the channel highs.
🧠 Layer on a fib projection from the previous ATH to the bear market low, and we get:
1.272 Fib → ~$1.54
1.618 Fib → ~$3.92
Both of which align perfectly with the upper bounds of that long-term trend channel — giving us a key HTF reversal zone to monitor in the future.
In summary:
- Reversal from demand ✅
- DCA filled ✅
- HLs printing ✅
- Targets = ATH and beyond
- Watching HTF fibs + channel highs for eventual cycle top formation
DOGE is doing what DOGE does — don’t overcomplicate it.
1D:
3D:
1W:
1M:
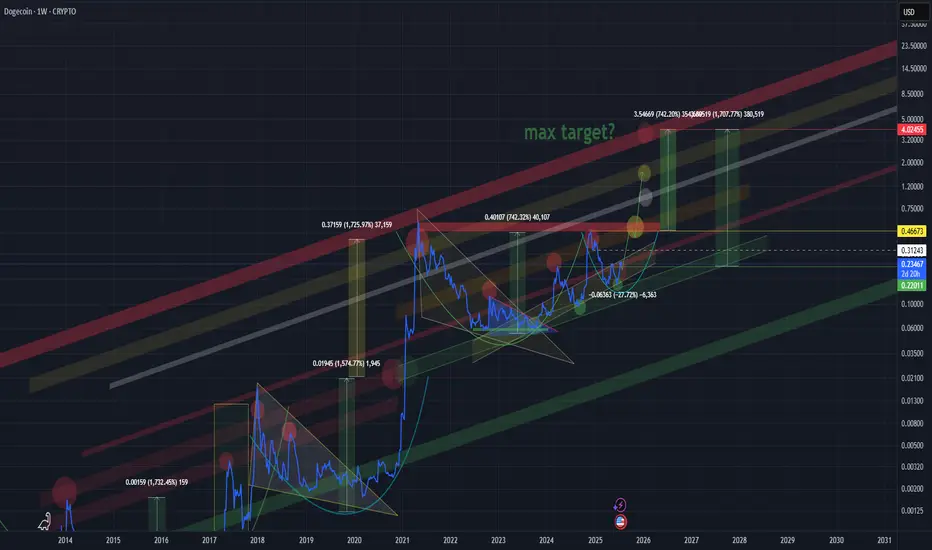
DOGE DOGECOIN DOGEUSDT long/midium term☕ Cup and Handle Forming Again – Targeting $4!
Just like before — we are seeing a massive “Cup and Handle” pattern forming.
Last time, the exact same structure played out, and the price perfectly reached the previous high upon completion of the pattern.
📌 Current Setup
The cup is already formed, and now we are clearly drawing the handle
If history repeats — and it often does in crypto — the price should break out and target above the previous high
🎯 Projected Target:
Based on the structure, the full Cup & Handle breakout points toward a move up to $4.
⚠️ Things to watch
Fakeouts are possible, so use proper risk management
💬 "Patterns don’t repeat exactly — but they often rhyme."
Let the chart guide your plan, not emotions.
$DOGE to the moon?CRYPTOCAP:DOGE | 1D
Currently retesting the 0.25 resistance. If we break through, a push to 0.27 is likely.
Expect a minor pullback to the 0.23–0.22 region before a potential full move toward 0.30 region
$Doge Dogecoin about 60% retracement from all time high...CRYPTOCAP:DOGE dogecoin has retraced about 60% from an all time high of about 0.49
Current price: 0.20
Reasons why i am bullish on #Doge
CRYPTOCAP:DOGE price action has remained above the 200ema on the weekly timeframe ...bullish!
- $dogecoin has committed an over 60% retracement from all time high of 0.49
- It is currently at double bottom support seen in April
#dogecoin negative money flow is thinning out
- Sentiments are neutral : neither greedy for fearful
- Price action is exactly at point of control on the weekly time frame!
Resistances above to watch: 0.32, 0.42 up to 0.69

The Meme Coin Race Has Begun, DOGE fighting for top spot!📈 The Meme Coin Race Has Begun
🔥 The battle for the throne is heating up...
🐶 DOGE, the original meme coin, isn’t giving up its crown without a fight.
Fractals from the past seem to echo in today's chart – history doesn’t repeat, but it rhymes.
⚔️ With new challengers lining up in the meme arena, one question remains:
Can DOGE reach $2.45 and reclaim the top spot?
🚀 Volume is rising. Patterns are aligning.
The king is awake.
👑 The OG vs the New School. Who will win the meme war?
Comment your prediction 👇
#DOGE #MemeSeason #CryptoFractals #Altseason #DOGEUSDT #CryptoTrading #TradingView #FractalAnalysis #CryptoWar #MemeCoins

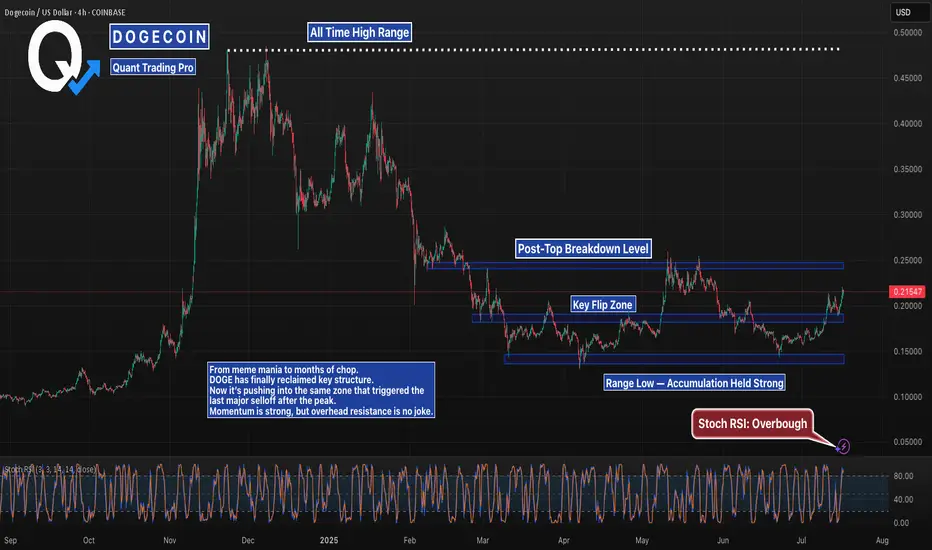
DOGE Is Climbing Back Toward Its Post-Hype BreakdownDOGE peaked near $0.50 during peak hype and crashed hard.
After grinding sideways for months, it’s now reclaiming lost ground.
The $0.245–0.25 zone is where the real test begins — it’s the same area that triggered the major breakdown after the blowoff top.
If bulls hold above $0.20, this push might have real legs.
#Dogecoin #DOGEUSD #CryptoCharts #ChartBreakdown #ResistanceTest #QuantTradingPro #CryptoAnalysis #BacktestEverything #TradingView
DOGESH DOGE again!DOGESH looks an Indian name I like it hahahhahaa, but yes have power to fly up without farts help